Drink. Water Eng. Sci., 3, 1–9, 2010 www.drink-water-eng-sci.net/3/1/2010/
©Author(s) 2010. This work is distributed under the Creative Commons Attribution 3.0 License.
Drinking Water
Engineering and Science
NOM removal technologies – Norwegian experiences
H. Ødegaard1, S. Østerhus2, E. Melin2, and B. Eikebrokk2
1Department of Hydraulic and Environmental Engineering, Norwegian University of
Science and Technology (NTNU), 7491 Trondheim, Norway
2Water and Environment, SINTEF, 7491 Trondheim, Norway
Received: 15 July 2009 – Published in Drink. Water Eng. Sci. Discuss.: 9 October 2009 Revised: 5 January 2010 – Accepted: 7 January 2010 – Published: 13 January 2010
Abstract. The paper gives an overview of the methods for removal of natural organic matter (NOM) in wa-ter, particularly humic substances (HS), with focus on the Norwegian experiences. It is demonstrated that humic substances may be removed by a variety of methods, such as; molecular sieving through nanofiltration membranes, coagulation with subsequent floc separation (including granular media or membrane filtration), oxidation followed by biofiltration and sorption processes including chemisorption (ion exchange) and physi-cal adsorption (activated carbon). All these processes are in use in Norway and the paper gives an overview of the operational experiences.
1 Introduction
NOM in water is a major concern and should be removed from drinking water for a number of reasons, including that NOM: a) affects organoleptic properties of water (colour, taste and odour); b) reacts with disinfectants used in wa-ter treatment, thus reducing their disinfection power; c) in-fluences disinfectant demand and – process design, opera-tion and maintenance; d) produces disinfecopera-tion by-products (DBPs) of various kinds; e) affects stability and removal of inorganic particles; f) influences heavily on coagulant de-mand; g) may control coagulation conditions and coagula-tion performance; h) affects corrosion processes; i) affects biostability and biological regrowth in distribution systems; j) forms complexes with and increases mobility of chemical substances found in nature; k) fouls membranes; l) reduces adsorption capacity of granular or powdered activated car-bon (GAC/PAC) by pore blocking, m) competes with taste and odour compunds for adsorption sites in GAC/PAC (Eike-brokk et al., 2006).
The main NOM component in Norwegian water is at-tributed to humic substances (HS) that have several charac-teristics that influence on how NOM may be removed from water (Fabris et al., 2008; Eikebrokk et al., 2007):
Correspondence to: H. Ødegaard
1. Because of the large size of humic substance molecules (MW 1000–100 000), it is possible to separate HS di-rectly from water by molecular sieving through a suffi -ciently tight membrane (nano-filtration).
2. Because the HS molecules are negatively charged at drinking water pH, they can be coagulated, adsorbed to metal hydroxide and subsequently removed by floc separation.
3. Because of the negative charge, HS may be removed by chemical sorption (ion exchange). HS may also be adsorbed on activated carbon (physical adsorption). 4. Since the color of HS is associated with its aromatic
content and C=C bonds, the color can be removed by breaking these bonds through the addition of a strong oxidant.
5. Since HS is the end-point of nature’s biodegradation, HS is close to being non-biodegradable. By use of a strong oxidising agent, however, the large HS molecules may be broken into smaller, biodegradable components, removable by biofiltration.
2 H. Ødegaard et al.: NOM removal technologies – Norwegian experiences
4
membranes. The typical pore size of the membranes is 1-5 nm (1000-2000 Da) operated at a
pressure of 4-8 bar (Ødegaard et al, 2000). The typical flow diagram of a membrane filtration
plant is shown in Figure 1. The raw water passes first through a pre-treatment unit, normally a
micro-sieve with a sieve opening of typically 50
m. After the sieve, the pressure is raised up
to the operating pressure of the membrane unit by a circulation pump. Cross-flow filtration
takes place in the membrane unit resulting in a cleaned water stream (the permeate) that has
passed through the membrane and a dirty water stream (the concentrate) that passes a
reduction valve bringing the pressure in the concentrate back to that of the atmosphere. Some
of the concentrate is recycled to the inlet in order to increase the recovery.
Fig. 1.
Typical flow diagram and picture of a nanofiltration plant for NOM removal
Since the reduction of calcium and bicarbonate concentration through the membrane filter is
about 15-30 %, an alkaline filter (calcium carbonate) is often included in order to increase the
level of calcium and bicarbonate in the typically soft and corrosive Norwegian water.
In order to prevent capacity reduction over time as a result of membrane fouling, the
membranes cleaned by two different cleaning procedures: a frequent (daily) cleaning
(chemical rinse) and a main cleaning that is carried out once or twice a year. In the daily
cleaning, that normally lasts for about an hour and takes place during night, a chemical
solution, also containing an oxidant (normally chlorine) for disinfection purposes, is pumped
into the membrane module and circulated here for 20-30 minutes after which it is pumped out.
Raw water is then lead through the membrane module for rinsing for 20-40 minutes before
the plant is again put into operation. The plants are fully automated and the operator has only
to see to that there are sufficient amounts of washing solutions and that the pressures in the
plant are as intended. The main cleaning is normally carried out a couple of times per year
coupled to a general service of the plant by the contractor. The washing chemicals may
contain wetting agents (tensides, phosphates etc), sequesters (phosphates, EDTA etc),
oxidation chemicals (peroxides, chlorine etc) and enzymes (Ødegaard et al, 2000).
The NF process is often selected when the NOM-content/color is high (> 30 mg Pt/l) and
turbidity low (< 1 NTU). The most typical problems encountered are those connected to
capacity loss caused by fouling. In most cases this is either caused by too high design flux
relative to the characteristics of the water in question, especially too high flux for waters with
high particle concentration and high NOM-content. Model calculations made by Thorsen
(1999) indicated that particles in the size range of about 0.1 – 3 µm are particularly critical for
fouling. Thorsen and Fløgstad (2006) demonstrated when using a lab scale plant (flux 24
L/m
2h) on a colored surface water that the permeability decline was 31 % over a 700 hrs
period when using a 100 µm pre-filter before the spiral wound NF membrane and almost the
same when using a 5 µm prefilter, while it was close to 0 % when using a 0.1 µm prefilter.
This demonstrates the importance of correct design relative to the water characteristics.
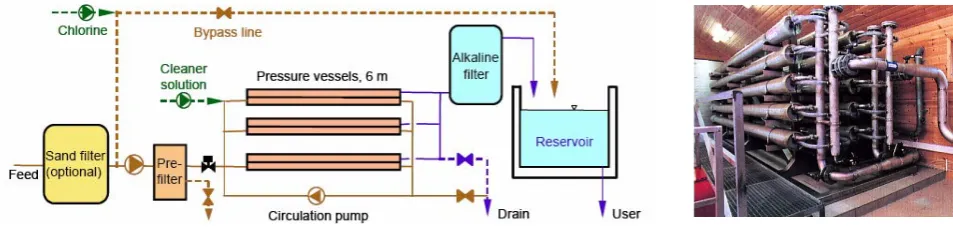
Figure 1.Typical flow diagram and picture of a nanofiltration plant for NOM removal.
Since the colour of the water is a major concern for users in Norway, emphasis will be given to colour (mg Pt/l) as a NOM characterization parameter in this paper. Typical re-lationships between colour, DOC and UV-absorption for the Norwegian raw waters referred to in this paper are:
DOC (mg C/l)=0.120 Colour (mg Pt/l)+1.0 (R2=0.935)
DOC (mg C/l)=0.241 UV−abs.(1/m)+0.4 (R2=0.997)
2 Membrane (nano) filtration
Research on membrane filtration (nano/ultra-filtration) for the removal of humic substances was started at the university in Trondheim around 1975 (Ødegaard and Kootatep, 1982) and the first full-scale plant was put into operation in 1990. Since then membrane filtration has become very popular in Norway and more than 100 nanofiltration (NF) plants are in operation at this time. Most of the plants are small, the largest plant having a design flow of 16 000 m3/d.
All the Norwegian NF plants are based on spiral wound modules and the majority on cellulose acetate (CA) mem-branes, with a few exceptions based on polyamide (PA) membranes. The typical pore size of the membranes is 1– 5 nm (1000–2000 Da) operated at a pressure of 4–8 bar (Øde-gaard et al., 2000). The typical flow diagram of a membrane filtration plant is shown in Fig. 1. The raw water passes first through a pre-treatment unit, normally a micro-sieve with a sieve opening of typically 50µm. After the sieve, the pres-sure is raised up to the operating prespres-sure of the membrane unit by a circulation pump. Cross-flow filtration takes place in the membrane unit resulting in a cleaned water stream (the permeate) that has passed through the membrane and a dirty water stream (the concentrate) that passes a reduction valve bringing the pressure in the concentrate back to that of the atmosphere. Some of the concentrate is recycled to the inlet in order to increase the recovery.
Since the reduction of calcium and bicarbonate concentra-tion through the membrane filter is about 15–30%, an alka-line filter (calcium carbonate) is often included in order to increase the level of calcium and bicarbonate in the typically soft and corrosive Norwegian water.
In order to prevent capacity reduction over time as a result of membrane fouling, the membranes cleaned by two diff er-ent cleaning procedures: a frequer-ent (daily) cleaning (chem-ical rinse) and a main cleaning that is carried out once or twice a year. In the daily cleaning, that normally lasts for about an hour and takes place during night, a chemical solu-tion, also containing an oxidant (normally chlorine) for disin-fection purposes, is pumped into the membrane module and circulated here for 20–30 min after which it is pumped out. Raw water is then lead through the membrane module for rinsing for 20–40 min before the plant is again put into op-eration. The plants are fully automated and the operator has only to see to that there are sufficient amounts of washing so-lutions and that the pressures in the plant are as intended. The main cleaning is normally carried out a couple of times per year coupled to a general service of the plant by the contrac-tor. The washing chemicals may contain wetting agents (ten-sides, phosphates etc.), sequesters (phosphates, EDTA etc.), oxidation chemicals (peroxides, chlorine etc.) and enzymes (Ødegaard et al., 2000).
The NF process is often selected when the NOM-content/color is high (>30 mg Pt/l) and turbidity low (<1 NTU). The most typical problems encountered are those connected to capacity loss caused by fouling. In most cases this is either caused by too high design flux relative to the characteristics of the water in question, especially too high flux for waters with high particle concentration and high NOM-content. Model calculations made by Thorsen (1999) indicated that particles in the size range of about 0.1–3µm are particularly critical for fouling. Thorsen and Fløgstad (2006) demonstrated when using a lab scale plant (flux 24 L/m2h) on a colored surface water that the permeability
de-cline was 31% over a 700 h period when using a 100µm pre-filter before the spiral wound NF membrane and almost the same when using a 5µm prefilter, while it was close to 0% when using a 0.1µm prefilter. This demonstrates the im-portance of correct design relative to the water characteris-tics. Practical full-scale experiences show that the best spiral wound membranes can be operated for weeks with an almost constant flux up to 20 L/m2h (Thorsen and Fløgstad, 2006)
H. Ødegaard et al.: NOM removal technologies – Norwegian experiences 3
5
Practical full-scale experiences show that the best spiral wound membranes can be operated
for weeks with an almost constant flux up to 20 L/m
2
h (Thorsen and Fløgstad, 2006) and the
design flux recommended is therefore in the range of 15 – 18 L/m
2
h. The criteria for success
in operating NF-plant for NOM-removal in Norway seem to be use of low flux (< 20 L/m
2
h)
combined with low recovery (< 70%) and selection of CA-membranes (to avoid adsorptive
fouling) with proper cleaning procedures (daily with a diluted solution to prevent a bound
fouling layer combined with a more comprehensive chemical cleaning once or twice a year).
3.
COAGULATION/FILTRATION
The conventional coagulation/floc separation method (see Figure 2) is globally probably the
most commonly used method for NOM substance removal. Principally it is constructed in a
similar way as plants for turbidity removal. Since Norwegian lake water commonly is low in
turbidity, the more compact flow diagrams (direct- or contact filtration), are dominating in
Norway. The conventional process is used only when turbidity is higher than normal.
Compact separation units (flotation and microsand ballasted lamella sedimentation) before the
filter are favored when the conventional process is used.
Fig. 2. Coagulation/floc separation
flow schemes
Fig. 3. Typical flow scheme for a contact filtration
plant for NOM removal in Norway
Coagulation is normally carried out by the addition of aluminium sulfate, prepolymerised
aluminium chloride of iron chloride as coagulants. The primary NOM-coagulation
mechanisms are: a) complexation of NOM with dissolved metal coagulant species (Al or Fe),
leading to direct precipitation of a Me-NOM solid phase, b) complexation of NOM with
dissolved coagulant species, leading to adsorption of this complexed material onto
precipitated Me(OH)3 solids, and c) direct adsorption of NOM onto the surface of precipitated
Me(OH)3 solids. The coagulation of waters containing both particles and NOM becomes more
complicated, involving several important factors: a) the dissolved coagulant species present
upon coagulant addition, b) the presence of precipitated metal hydroxide solids, c) the
concentration of particles and NOM, d) the chemical properties of these contaminants and
their reactivity with dissolved coagulant species, and e) the pH of coagulation, which is
affected by the chemistry of the coagulant and the water alkalinity (Eikebrokk et al, 2006).
The two most important factors in order to achieve optimal coagulation, flocculation and
subsequent floc attachment and retainment on the filter grains, are the coagulant dosage and
the coagulation pH (see Table 1).
Introduction
Convent-ional
Direct filtration
Contact filtration
Coagulant
addition ulationFlocc- Settling/flotation Filtration
Introduction
Convent-ional
Direct filtration
Contact filtration
Coagulant
addition ulationFlocc- Settling/flotation Filtration
Anthracite,d60=1,5 mm
Sand,d60=0,6 mm Sand, 1-2mm
Gravel, 2-5mm Gravel, 5-10mm
50cm
30cm Flocculant (Polymer)
Raw water CO2
Ca(OH)2
Chlorine
Treated water
Coagulant (Al or Fe)
3x10cm support Anthracite,d60=1,5 mm
Sand,d60=0,6 mm Sand, 1-2mm
Gravel, 2-5mm Gravel, 5-10mm
50cm
30cm Flocculant (Polymer)
Raw water CO2
Ca(OH)2
Chlorine
Treated water
Coagulant (Al or Fe)
3x10cm support
Introduction
Convent-ional
Direct filtration
Contact filtration
Coagulant
addition ulationFlocc- Settling/flotation Filtration
Introduction
Convent-ional
Direct filtration
Contact filtration
Coagulant
addition ulationFlocc- Settling/flotation Filtration
Anthracite,d60=1,5 mm
Sand,d60=0,6 mm Sand, 1-2mm
Gravel, 2-5mm Gravel, 5-10mm
50cm
30cm Flocculant (Polymer)
Raw water CO2
Ca(OH)2
Chlorine
Treated water
Coagulant (Al or Fe)
3x10cm support Anthracite,d60=1,5 mm
Sand,d60=0,6 mm Sand, 1-2mm
Gravel, 2-5mm Gravel, 5-10mm
50cm
30cm Flocculant (Polymer)
Raw water CO2
Ca(OH)2
Chlorine
Treated water
Coagulant (Al or Fe)
3x10cm support
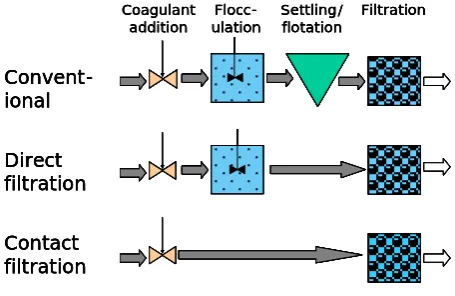
Figure 2.Coagulation/floc separation flow schemes.
15–18 L/m2h. The criteria for success in operating NF-plant
for NOM-removal in Norway seem to be use of low flux (≤20 L/m2h) combined with low recovery (≤70%) and
se-lection of CA-membranes (to avoid adsorptive fouling) with proper cleaning procedures (daily with a diluted solution to prevent a bound fouling layer combined with a more com-prehensive chemical cleaning once or twice a year).
3 Coagulation/filtration
The conventional coagulation/floc separation method (see Fig. 2) is globally probably the most commonly used method for NOM substance removal. Principally it is constructed in a similar way as plants for turbidity removal. Since Norwegian lake water commonly is low in turbidity, the more compact flow diagrams (direct- or contact filtration), are dominating in Norway. The conventional process is used only when tur-bidity is higher than normal. Compact separation units (flota-tion and microsand ballasted lamella sedimenta(flota-tion) before the filter are favored when the conventional process is used.
Coagulation is normally carried out by the addition of aluminium sulfate, prepolymerised aluminium chloride of iron chloride as coagulants. The primary NOM-coagulation mechanisms are: a) complexation of NOM with dissolved metal coagulant species (Al or Fe), leading to direct precip-itation of a Me-NOM solid phase, b) complexation of NOM with dissolved coagulant species, leading to adsorption of this complexed material onto precipitated Me(OH)3 solids,
and c) direct adsorption of NOM onto the surface of pre-cipitated Me(OH)3 solids. The coagulation of waters
con-taining both particles and NOM becomes more complicated, involving several important factors: a) the dissolved coagu-lant species present upon coagucoagu-lant addition, b) the presence of precipitated metal hydroxide solids, c) the concentration of particles and NOM, d) the chemical properties of these contaminants and their reactivity with dissolved coagulant species, and e) the pH of coagulation, which is affected by
the chemistry of the coagulant and the water alkalinity (Eike-brokk et al., 2006).
The two most important factors in order to achieve optimal coagulation, flocculation and subsequent floc attachment and retainment on the filter grains, are the coagulant dosage and the coagulation pH (see Table 1).
Pre-polymerised aluminium chloride (PAX in Table 1) has the advantage of consuming less alkalinity than alum and is often preferred in the soft, low-alkalinity Norwegian waters. In most cases the most difficult water quality criteria to com-ply with, is the residual metal concentration after filtration (Eikebrokk, 2001). This has led to an increased use of iron based coagulants, especially in plants that use calcium car-bonate as a filter media for corrosion control. The low opti-mum coagulation pH of ferric coagulants combines very well with the alkaline post-filtration because of the rapid disso-lution of calcium carbonate (i.e. low contact time) and the supplementary removal of Fe-residuals in the alkaline filter bed.
The high molecular weight NOM fractions that are dom-inant in Norway are easier to coagulate than low molecular weight NOM. Since it is the high molecular weight fraction that contribute most to the color of the water, the color/ DOC-ratio (or UV-absorption/DOC or SUVA-index) gives an in-dication of the dominating MW-factions in the water and consequently of the efficacy of coagulation. A color to DOC ratio higher than 5–10 mg Pt/mg C is considered favor-able, and in such cases specific dosages in the range of 0.3– 0.6 mg Al/mg C or 0.03–0.06 mg Al/mg Pt, are typical (Eike-brokk, 2001).
Cationic, synthetic polymers (Bolto et al., 1998; Kvin-nesland and Ødegaard, 2004) can also be used for NOM-coagulation but there is no tradition for this in Norway. How-ever, the cationic biopolymer chitosan is used for coagulation to some extent. Chitosan can remove color reasonably well, but it is not comparable to metal coagulants with respect to DOC removal. The main advantages are related to the ease of sludge handling (biodegradable and toxic) and the non-existing residual metal problem. Chitosan can be used alone or in combination with a metal coagulant. In contact floccu-lation plants a non-ionic or anionic synthetic polymer is often used to enhance flocculation and increase filter run lengths.
Sub-optimal coagulation conditions (pH and dosage) rep-resent various operational challenges for the whole plant as such. First of all it may lead to too high residual metal con-tent as well as reduced filtrate quality levels (NOM, turbidity, pathogens etc.), but sub-optimal conditions impact on the fil-ter performance as well. Too high coagulant dosage, for in-stance, may lead to: a) short filter runs (early breakthroughs, head loss), b) reduced alkalinity/increased base consump-tion, c) increased sludge production (metal hydroxide), d) increased backwash water consumption and e) increased op-eration costs. Eikebrokk et al. (2006, 2007) developed sev-eral empirical models for the purpose of optimization of op-eration performance in Norwegian contact filtration plants:
4 H. Ødegaard et al.: NOM removal technologies – Norwegian experiences
Table 1.Recommended pH and dose using alum (ALG), iron (JKL) or chitosan (Chi) in contact filtration of raw waters at color levels of 15, 30 and 50 mg Pt/L (Eikebrokk, 2001).
Raw water colour Raw water SUVA Recommended specific coagulant dosage and
L/mg C m pH mmol Me or mmol Chi/gTOC; (µg Me orµg Chi/mgPt)
ALG pH 5.8–6.6 JKL pH 4.0–5.5 PAX pH 5.7–6.7 CHI pH 5.0–6.0
RW15 3.8 16 (78) 16 (162) 14 (67) 0.6 (110)
RW30 4.3 20 (63) 20 (128) 17 (54) 0.7 (80)
RW50 4.8 26 (61) 26 (100) 20 (49) 0.8 (70)
ALG-aluminium sulphate, JKL-ferric chloride; PAX-poly aluminium chloride; Chi-Chitosan.
For Me-coagulants: Dose levels needed to obtain<0.1 mg residual Me/L,>90% and 50–60% colour and TOC reduction Absolute minimum doses are 25% lower than the given practical minimum doses.
For Chitosan: Dose levels needed to obtain>60% and 20–35% colour and TOC reduction, resp.
Practical full-scale experiences show that the best spiral wound membranes can be operated
for weeks with an almost constant flux up to 20 L/m
2h (Thorsen and Fløgstad, 2006) and the
design flux recommended is therefore in the range of 15 – 18 L/m
2h. The criteria for success
in operating NF-plant for NOM-removal in Norway seem to be use of low flux (< 20 L/m
2h)
combined with low recovery (< 70%) and selection of CA-membranes (to avoid adsorptive
fouling) with proper cleaning procedures (daily with a diluted solution to prevent a bound
fouling layer combined with a more comprehensive chemical cleaning once or twice a year).
3.
COAGULATION/FILTRATION
The conventional coagulation/floc separation method (see Figure 2) is globally probably the
most commonly used method for NOM substance removal. Principally it is constructed in a
similar way as plants for turbidity removal. Since Norwegian lake water commonly is low in
turbidity, the more compact flow diagrams (direct- or contact filtration), are dominating in
Norway. The conventional process is used only when turbidity is higher than normal.
Compact separation units (flotation and microsand ballasted lamella sedimentation) before the
filter are favored when the conventional process is used.
Fig. 2.
Coagulation/floc separation
flow schemes
Fig. 3.
Typical flow scheme for a contact filtration
plant for NOM removal in Norway
Coagulation is normally carried out by the addition of aluminium sulfate, prepolymerised
aluminium chloride of iron chloride as coagulants. The primary NOM-coagulation
mechanisms are: a) complexation of NOM with dissolved metal coagulant species (Al or Fe),
leading to direct precipitation of a Me-NOM solid phase, b) complexation of NOM with
dissolved coagulant species, leading to adsorption of this complexed material onto
precipitated Me(OH)
3solids, and c) direct adsorption of NOM onto the surface of precipitated
Me(OH)
3solids. The coagulation of waters containing both particles and NOM becomes more
complicated, involving several important factors: a) the dissolved coagulant species present
upon coagulant addition, b) the presence of precipitated metal hydroxide solids, c) the
concentration of particles and NOM, d) the chemical properties of these contaminants and
their reactivity with dissolved coagulant species, and e) the pH of coagulation, which is
affected by the chemistry of the coagulant and the water alkalinity (Eikebrokk et al, 2006).
The two most important factors in order to achieve optimal coagulation, flocculation and
subsequent floc attachment and retainment on the filter grains, are the coagulant dosage and
the coagulation pH (see Table 1).
Introduction
Convent-ional Direct filtration Contact filtration
Coagulant
addition ulationFlocc- Settling/flotation Filtration
Introduction
Convent-ional Direct filtration Contact filtration
Coagulant
addition ulationFlocc- Settling/flotation Filtration
Anthracite,d60=1,5 mm
Sand,d60=0,6 mm
Sand, 1-2mm Gravel, 2-5mm Gravel, 5-10mm
50cm
30cm
Flocculant (Polymer) Raw water CO2
Ca(OH)2
Chlorine
Treated water
Coagulant (Al or Fe)
3x10cm support Anthracite,d60=1,5 mm
Sand,d60=0,6 mm
Sand, 1-2mm Gravel, 2-5mm Gravel, 5-10mm
50cm
30cm
Flocculant (Polymer) Raw water CO2
Ca(OH)2
Chlorine
Treated water
Coagulant (Al or Fe)
3x10cm support
Introduction
Convent-ional Direct filtration Contact filtration
Coagulant
addition ulationFlocc- Settling/flotation Filtration
Introduction
Convent-ional Direct filtration Contact filtration
Coagulant
addition ulationFlocc- Settling/flotation Filtration
Anthracite,d60=1,5 mm
Sand,d60=0,6 mm
Sand, 1-2mm Gravel, 2-5mm Gravel, 5-10mm
50cm
30cm
Flocculant (Polymer) Raw water CO2
Ca(OH)2
Chlorine
Treated water
Coagulant (Al or Fe)
3x10cm support Anthracite,d60=1,5 mm
Sand,d60=0,6 mm
Sand, 1-2mm Gravel, 2-5mm Gravel, 5-10mm
50cm
30cm
Flocculant (Polymer) Raw water CO2
Ca(OH)2
Chlorine
Treated water
Coagulant (Al or Fe)
3x10cm support
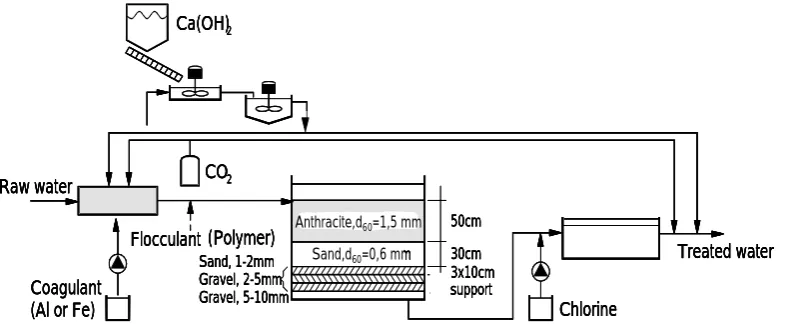
Figure 3.Typical flow scheme for a contact filtration plant for NOM removal in Norway.
Minimum required coagulant dose: Dose (mg Me/L)=A· Raw water Colour (mg Pt/L)+B where A and B are constants
depending on the coagulant and operational conditions. For alum A was found to be 0.043 and for iron 0.107, while B was found to be 0.30 for alum and 0.58 for iron. The practical minimum dose was recommended to be 25% higher than this.
Sludge production at optimum coagulation: SS (mg/L)=SSRW+k·Dose where SSRWis the suspended solid
concentration in the raw water including the contribution from additional processes like pH- and corrosion control, k is a constant depending on the type of coagulant and Dose is the coagulant dose (mg Me/L). For alum and ferric chloride as coagulant, k is found to be 4.2 and 2.5 respectively
Filter run time to break through at optimum coagulation: tBT=a (vf ·SS)b where tBT is time of filtration until
break-through (h), vfis rate of filtration (m/hr), SS is the suspended
solids concentration in coagulated water, i.e. sludge produc-tion (mg SS/L), and a and b are constants specific to the filter and coagulant. For alum without any polymer as filter aid and SSRW=0, the time of filtration has been found to be:
tBT=298 (vf ·DoseAl)−1.29.
3.1 Alternative filter configurations
The two-media anthracite/sand filter is most commonly used filter configuration, as shown in Fig. 3. An alternative two-media configuration is the one based on, Filtralite (Fig. 4), a lightweight expanded clay media produced in Norway. By using Filtralite of two different grain sizes and densities, a coarse-to-fine media filter is established.
Saltnes et al. (2001, 2002) demonstrated in a Filtralite filter with coarse grains (see Fig. 4) and consequently high sludge storage capacity/long filter runs, that bigger grain sizes could be compensated for by increasing filter depth, especially when using a polymer as filter aid.
Because of the need for corrosion control, an alternative filter configuration has become popular in Norway, where calcium carbonate is used as the bottom media in a down-flow three media filter with conventional anthracite/sand as the upper media (Fig. 5) (Ødegaard, et al., 1999). Floc sepa-ration takes place in the anthracite/sand part of the filter while the calcium carbonate part has the function of carbonation. Most of these plants use iron chloride as coagulant (typical
H. Ødegaard et al.: NOM removal technologies – Norwegian experiences 5
7
Minimum required coagulant dose
: Dose (mg Me/L) = A · Raw water Colour (mg Pt/L) + B
where A and B are constants depending on the coagulant and operational conditions. For alum
A was found to be 0.043 and for iron 0.107, while B was found to be 0.30 for alum and 0.58
for iron. The practical minimum dose was recommended to be 25 % higher than this.
Sludge production at optimum coagulation
: SS (mg/L) = SS
RW+ k · Dose
where SS
RWis the suspended solid concentration in the raw water including the contribution
from additional processes like pH- and corrosion control, k is a constant depending on the
type of coagulant and Dose is the coagulant dose (mg Me/L). For alum and ferric chloride as
coagulant, k is found to be 4.2 and 2.5 respectively
Filter run time to break through at optimum coagulation
: t
BT= a ( v
f· SS )
bwhere t
BTis time of filtration until breakthrough (hrs), v
fis rate of filtration (m/hr), SS is the
suspended solids concentration in coagulated water, i.e. sludge production (mg SS/L), and a
and b are constants specific to the filter and coagulant. For alum without any polymer as filter
aid and SS
RW= 0, the time of filtration has been found to be: t
BT= 298 ( v
f· Dose
Al)
-1.293.1. Alternative filter configurations
The two-media anthracite/sand filter is most commonly used filter configuration, as shown in
Figure 3. An alternative two-media configuration is the one based on, Filtralite (Figure 4), a
lightweight expanded clay media produced in Norway. By using Filtralite of two different
grain sizes and densities, a coarse-to-fine media filter is established.
Fig. 4
The mono-multi Filtralite
filter
Fig. 5
The three media filter
for coagulation/carbonatisation
Fig. 6
The continuous,
uplow (Dynasand) filter
Saltnes et al (2001, 2002) demonstrated in a Filtralite filter with coarse grains (see Figure 4)
and consequently high sludge storage capacity/long filter runs, that bigger grain sizes could be
compensated for by increasing filter depth, especially when using a polymer as filter aid.
Because of the need for corrosion control, an alternative filter configuration has become
popular in Norway, where calcium carbonate is used as the bottom media in a down-flow
three media filter with conventional anthracite/sand as the upper media (Figure 5) (Ødegaard,
et al, 1999). Floc separation takes place in the anthracite/sand part of the filter while the
calcium carbonate part has the function of carbonation. Most of these plants use iron chloride
as coagulant (typical dosage 3.3-5 mg Fe/l) in order to reach the operating pH of 3.5-4,0 that
is required to ensure sufficient dissolution of the CaCO
3. In some of these plants CO
2is added
as well (typically 6-15 mg/l) in order to minimize the iron dosage. pH, grain size as well as
contact time influence the dissolution of the marble in order to arrive at the combination of
Support layer Support layer Support layer Sand 0,4-0,8 mm FL HC 0,8-1,6 mm FL HC 0,8-1,6 mm FL NC 1,6-2,5 mm 178 95 60 47 35 0 -30 FL NC 1,6-2,5 mm Anthracite 0,8-1,6 mm A/S F/F F/F+ Support layer Support layer Support layer Sand 0,4-0,8 mm FL HC 0,8-1,6 mm FL HC 0,8-1,6 mm FL NC 1,6-2,5 mm 178 95 60 47 35 0 -30 FL NC 1,6-2,5 mm Anthracite 0,8-1,6 mm A/S F/F F/F+ F ilt er dep th (c m)
AS – anthracite/sand, F/F – Filtralite/Filtralite FL NC – Filtralite normal density, FL HC – Filtralite high density
Figure 4.The mono-multi Filtralite filter.
Specific ozone dose (mgO3 mgPt-1)
0.00 0.05 0.10 0.15 0.20 0.25 0.30
C/ C0 0.0 0.2 0.4 0.6 0.8 1.0 1 C/C0 =
1 + 20D/C0
Figure
7
Figure
6
Figure 5.The three media filter for coagulation/carbonatisation.
dosage 3.3–5 mg Fe/l) in order to reach the operating pH of 3.5–4.0 that is required to ensure sufficient dissolution of the CaCO3. In some of these plants CO2is added as well
(typ-ically 6–15 mg/l) in order to minimize the iron dosage. pH, grain size as well as contact time influence the dissolution of the marble in order to arrive at the combination of pH, alkalinity and Ca-concentration aimed for (see above). In a typical Norwegian situation, it is experienced that the empty bed contact time in the marble part of the filter should be at least 15–25 min. A filter depth of the marble layer of 150– 250 mm at a filtration rate of 5 m/h is required (see Fig. 5). After reaching a critical lower grain size, the smallest grains are washed out during back-washing and new marble grains have to be supplied. New grains are supplied during
back-7
Minimum required coagulant dose: Dose (mg Me/L) = A · Raw water Colour (mg Pt/L) + B
where A and B are constants depending on the coagulant and operational conditions. For alum
A was found to be 0.043 and for iron 0.107, while B was found to be 0.30 for alum and 0.58
for iron. The practical minimum dose was recommended to be 25 % higher than this.
Sludge production at optimum coagulation: SS (mg/L) = SS
RW+ k · Dose
where SS
RWis the suspended solid concentration in the raw water including the contribution
from additional processes like pH- and corrosion control, k is a constant depending on the
type of coagulant and Dose is the coagulant dose (mg Me/L). For alum and ferric chloride as
coagulant, k is found to be 4.2 and 2.5 respectively
Filter run time to break through at optimum coagulation
: t
BT= a ( v
f· SS )
bwhere t
BTis time of filtration until breakthrough (hrs), v
fis rate of filtration (m/hr), SS is the
suspended solids concentration in coagulated water, i.e. sludge production (mg SS/L), and a
and b are constants specific to the filter and coagulant. For alum without any polymer as filter
aid and SS
RW= 0, the time of filtration has been found to be: t
BT= 298 ( v
f· Dose
Al)
-1.293.1. Alternative filter configurations
The two-media anthracite/sand filter is most commonly used filter configuration, as shown in
Figure 3. An alternative two-media configuration is the one based on, Filtralite (Figure 4), a
lightweight expanded clay media produced in Norway. By using Filtralite of two different
grain sizes and densities, a coarse-to-fine media filter is established.
Fig. 4
The mono-multi Filtralite
filter
Fig. 5
The three media filter
for coagulation/carbonatisation
Fig. 6
The continuous,
uplow (Dynasand) filter
Saltnes et al (2001, 2002) demonstrated in a Filtralite filter with coarse grains (see Figure 4)
and consequently high sludge storage capacity/long filter runs, that bigger grain sizes could be
compensated for by increasing filter depth, especially when using a polymer as filter aid.
Because of the need for corrosion control, an alternative filter configuration has become
popular in Norway, where calcium carbonate is used as the bottom media in a down-flow
three media filter with conventional anthracite/sand as the upper media (Figure 5) (Ødegaard,
et al, 1999). Floc separation takes place in the anthracite/sand part of the filter while the
calcium carbonate part has the function of carbonation. Most of these plants use iron chloride
as coagulant (typical dosage 3.3-5 mg Fe/l) in order to reach the operating pH of 3.5-4,0 that
is required to ensure sufficient dissolution of the CaCO
3. In some of these plants CO
2is added
as well (typically 6-15 mg/l) in order to minimize the iron dosage. pH, grain size as well as
contact time influence the dissolution of the marble in order to arrive at the combination of
Support layer Support layer Support layer Sand 0,4-0,8 mm FL HC 0,8-1,6 mm FL HC 0,8-1,6 mm FL NC 1,6-2,5 mm 178 95 60 47 35 0 -30 FL NC 1,6-2,5 mm Anthracite 0,8-1,6 mm A/S F/F F/F+ Support layer Support layer Support layer Sand 0,4-0,8 mm FL HC 0,8-1,6 mm FL HC 0,8-1,6 mm FL NC 1,6-2,5 mm 178 95 60 47 35 0 -30 FL NC 1,6-2,5 mm Anthracite 0,8-1,6 mm A/S F/F F/F+ F ilt er dep th (c m)
AS – anthracite/sand, F/F – Filtralite/Filtralite FL NC – Filtralite normal density, FL HC – Filtralite high density
Support layer Support layer Support layer Sand 0,4-0,8 mm FL HC 0,8-1,6 mm FL HC 0,8-1,6 mm FL NC 1,6-2,5 mm 178 95 60 47 35 0 -30 FL NC 1,6-2,5 mm Anthracite 0,8-1,6 mm A/S F/F F/F+ Support layer Support layer Support layer Sand 0,4-0,8 mm FL HC 0,8-1,6 mm FL HC 0,8-1,6 mm FL NC 1,6-2,5 mm 178 95 60 47 35 0 -30 FL NC 1,6-2,5 mm Anthracite 0,8-1,6 mm A/S F/F F/F+ F ilt er dep th (c m)
AS – anthracite/sand, F/F – Filtralite/Filtralite FL NC – Filtralite normal density, FL HC – Filtralite high density
Figure 6.The continuous, uplow (Dynasand) filter.
washing in order to ensure the proper grain grading at the start of a new filtration cycle. In the three media filters a typ-ical washing routine is composed of 3 min water back-wash at 60–80 m/h, 3 min backwash with air (together with water) and finally 6.5 min water backwash. Overall this re-sults in quite high backwash water consumption, in the range of 6–11% (Ødegaard et al., 1999).
Another filter that is much used in Norway in contact fil-tration plants for NOM-removal is the continuously operated filter – the so-called Dynasand filter (see Fig. 6).
3.2 Coagulation/membrane filtration
There is now an increasing interest in replacing the granular media filtration after coagulation with membrane (ultra- or micro-) filtration. At this time only one full scale plant based on coagulation (poly aluminium chloride)/hollow fibre UF (10 nm) membrane filtration (Xiga, Norit) is in operation in Norway. It has a stable operation at a flux of 80 L/m2h at 90%
recovery on a raw water with color 40 mg Pt/L. The plant is backwashed with treated (and chlorinated) water and chem-ical cleaning (75% phosphoric acid, soaking for 20 min and 15% sodium hypochlorite, soaking for 15 min) is performed every 8th backwash.
Research is being carried out at Norwegian University of Science and Technology (NTNU) both on ultra- and micro-filtration. Two systems have been investigated for NOM re-moval:
1. A system based on coagulation, flocculation and sub-merged, hollow fibre, outside-in UF filtration (Zenon Zeeweed) (Machenbach and Ødegaard, 2004).
2. A system based on coagulation, flocculation and inside-out ceramic microfiltration membranes (Metawater) (Meyn et al., 2007).
6 H. Ødegaard et al.: NOM removal technologies – Norwegian experiences In both cases a water with a high color (50 mg Pt/L
corre-sponding to a TOC of 5.5 mg/l) has been investigated. It has been shown that the optimized coagulation (pH and coagu-lant dose) conditions for membrane filtration are pretty much the same as for sand filtration. In the UF study (Machen-bach and Ødegaard, 2004), that was carried out with operat-ing fluxes in the range of 45–75 L/m2h, it was demonstrated
that optimization of floc aggregation (flocculation) was im-portant in order to minimize trans-membrane pressure (TMP) build-up. A packed bed flocculator at low velocity gradients (G-value≤30 s−1) and≥5 min empty bed residence time gave lower TMP-build-up than a high velocity gradient (G-value '400 s−1) and 30 s residence time pipe flocculator. In the MF study, however, that was operated at fluxes in the range of 140–220 L/m2h, a pipe flocculator operated at varying con-ditions (G=60 and 300 s−1and HRT 7.5 and 30 s) gave only
moderately higher TMP build-up than the standard, tradi-tional two-stage flocculation tank with 20 min HRT (Meyn et al., 2007). The difference in experience is probably caused by the fact that conditions suitable for good flocculation exist inside the ceramic membrane module itself.
The higher flux of the MF-unit was not sustainable and it seems that the recommended fluxes for UF-membranes after coagulation of NOM is typically 50–70 L/m2h while it is the
range of 130–160 L/m2h in MF membranes.
4 Oxidation/biofiltration
4.1 Oxidation
In humic surface water where color removal and disinfection is the main target, ozonation normally is the preferred oxi-dation method. The oxioxi-dation of NOM by ozone can follow two main pathways; 1) direct oxidation by ozon which selec-tively targets mainly activated aromatics and double bonds, and 2) indirect reaction where ozone is decomposed to form hydroxyl radicals which are more powerful but less selective oxidants than ozone. Consequently, the direct reaction path-way results in high color removal, but little TOC removal, whereas the indirect pathway removes less color and more TOC. The water matrix may determine the importance of the two pathways, and also the degree of scavenging. pH is of particular importance, and at high pH the indirect reaction pathway dominates and the ozonation may be considered as an AOP (Advanced Oxidation Process, defined as using hy-droxyl radicals for oxidation). The use of an AOP may be advantageous if oxidation of ozone resistant compounds is desired (i.e. several micro-pollutants, atrazine, alachlor, etc.). A disadvantage of the AOP’s is that the hydroxyl radicals are very unstable, easily scavenged and have a very short life-time. Ozonation may become an AOP when combined with H2O2 or UV, or by using a catalytic packing media in the
ozone column. Other AOP’s may also be applied, such as UV/H2O2, UV/TiO2, Vacuum-UV, Fenton, etc.
Specific ozone dose (mgO3 mgPt-1)
0.00 0.05 0.10 0.15 0.20 0.25 0.30
C/
C0
0.0 0.2 0.4 0.6 0.8 1.0
1 C/C0 =
1 + 20D/C0
Figure
7
Figure
6
Figure 7.Color reduction versus specific ozon dose.
When using ozonation in humic surface water without any pollutants, the direct oxidation reaction pathway is advanta-geous. This would imply that using an inert ozone column packing media is beneficial and that the pH should be neu-tral to low. At high alkalinity and NOM concentration the efficiency of the system would be somewhat reduced,
In practice the ozone dose required for 80% colour re-moval that has typically been achieved in pilot- and full-scale plants, is around 0.15–0.20 mg O3/mgPt which translates to
1.0–1.5 mg O3/mgTOC, see Fig. 7 (Ødegaard et al., 2006).
4.2 Ozonation/biofiltration
Ozonation is effective in colour removal from humic surface water – see Fig. 7 in which the colour removal versus specific dose is shown for different waters (Ødegaard er at, 2006).
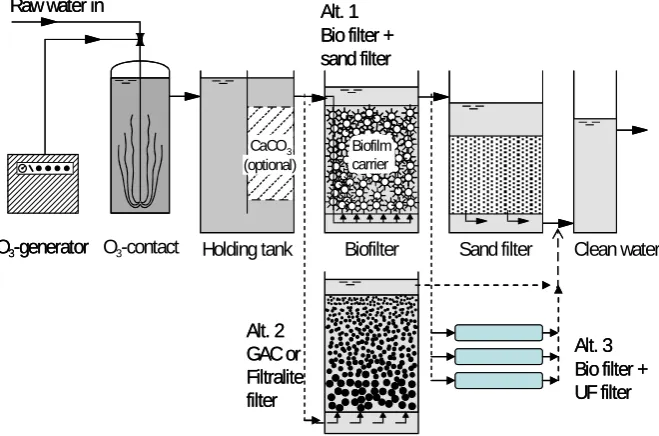
Ozonation of colored water, however, also results in reac-tion products that are far more biodegradable than the orig-inal humic substances. Biofiltration is therefore required in order to remove the easily biodegradable organic ozonation by-products. The flow-scheme of various alternatives of an ozonation/biofiltration plant is shown in Fig. 8.
H. Ødegaard et al.: NOM removal technologies – Norwegian experiences 7
9
4. OXIDATION/BIOFILTRATION
4.1. Oxidation
In humic surface water where color removal and disinfection is the main target, ozonation
normally is the preferred oxidation method. The oxidation of NOM by ozone can follow two
main pathways; 1) direct oxidation by ozon which selectively targets mainly activated
aromatics and double bonds, and 2) indirect reaction where ozone is decomposed to form
hydroxyl radicals which are more powerful but less selective oxidants than ozone.
Consequently, the direct reaction pathway results in high color removal, but little TOC
removal, whereas the indirect pathway removes less color and more TOC. The water matrix
may determine the importance of the two pathways, and also the degree of scavenging. pH is
of particular importance, and at high pH the indirect reaction pathway dominates and the
ozonation may be considered as an AOP (Advanced Oxidation Process, defined as using
hydroxyl radicals for oxidation). The use of an AOP may be advantageous if oxidation of
ozone resistant compounds is desired (i.e. several micro-pollutants, atrazine, alachlor, etc). A
disadvantage of the AOP’s is that the hydroxyl radicals are very unstable, easily scavenged
and have a very short lifetime. Ozonation may become an AOP when combined with H
2
O
2
or
UV, or by using a catalytic packing media in the ozone column. Other AOP’s may also be
applied, such as UV/H
2
O
2
, UV/TiO
2
, Vacuum-UV, Fenton, etc.
When using ozonation in humic surface water without any pollutants, the direct oxidation
reaction pathway is advantageous. This would imply that using an inert ozone column
packing media is beneficial and that the pH should be neutral to low. At high alkalinity and
NOM concentration the efficiency of the system would be somewhat reduced,
In practice the ozone dose required for 80% colour removal that has typically been achieved
in pilot- and full-scale plants, is around 0.15-0.20 mg O
3
/mgPt which translates to 1.0-1.5 mg
O
3
/mgTOC, see Figure 7 (Ødegaard et al, 2006).
4.2. Ozonation/biofiltration
Ozonation is effective in colour removal from humic surface water – see Figure 7 in which
the colour removal versus specific dose is shown for different waters (Ødegaard er at, 2006).
Fig. 7
Color reduction versus specific
ozon dose
Fig. 8
Alternative flow diagrams for
ozonation/biofiltration plants
Ozonation of colored water, however, also results in reaction products that are far more
biodegradable than the original humic substances. Biofiltration is therefore required in order
to remove the easily biodegradable organic ozonation by-products. The flow-scheme of
various alternatives of an ozonation/biofiltration plant is shown in Figure 8.
Raw water in
O3-generator O3-contact Holding tank Biofilter Sand filter Clean water
Alt. 1 Bio filter + sand filter
Alt. 2 GAC or Filtralite filter
CaCO3 (optional)
Biofilm carrier
Alt. 3 Bio filter + UF filter Raw water in
O3-generator O3-contact Holding tank Biofilter Sand filter Clean water
Alt. 1 Bio filter + sand filter
Alt. 2 GAC or Filtralite filter
CaCO3 (optional)
Biofilm carrier
Alt. 3 Bio filter + UF filter
Figure 8.Alternative flow diagrams for ozonation/biofiltration plants.
residence time is of importance. The results show that for typical Norwegian water, the EBCT should not be less than around 20 min (Ødegaard and Melin, 2006). The total TOC removal is relatively low, typically in the range of 20–30% even through the color removal is high (70–80%) at ozone dosages mentioned above (Melin and Ødegaard, 2000). The oxidation method is, therefore, not suitable for raw waters with high NOM-content, but for waters with an average color around 30 mg Pt/l, which is quite common in Norway, the experiences with the method are quite satisfactory. It is a very simple process to operate without any external chemi-cals needed and it gives a good hygienic barrier (>3 log re-duction of bacteria and virus and>2 log reduction of Giarda) because of the high ozone concentration
4.3 The OBM-process
In the European project TECHNEAU our group has investi-gated an oxidation/biofiltration/membrane filtration process (OBM-process) that is based on the “multi-barrier” concept (Azrague et al., 2009). The process is comprised of three separate independent processes.
1. The first step is oxidation, based on ozonation or an ad-vanced oxidation process (AOP – O3/H2O2, UV/TiO2
etc.). It will in addition to be a 1. hygienic barrier, also result in a) NOM-oxidation (color removal), b) oxida-tion of trace organics, c) oxidaoxida-tion and improvement of taste and odor and d) oxidation of inorganics (Fe, Mn etc.).
2. The second step (biofiltration) will improve the biosta-bility of the water by removing the easiest biodegrad-able organic matter produced by the oxidation step. 3. The third step, membrane filtration (MF, UF or NF) is
there to remove a) biomass produced in the second step, b) oxidized/precipitated inorganics and c) pathogen mi-croorganisms (constituting another hygienic barrier). In a pilot plant operated at the university (NTNU), it has been demonstrated (Østerhus and Azrague, 2009), that the OBM process achieved good colour removal (>80%) during ozonation even in high NOM water. After the biofiltration stage the produced water was bio-stable, with a very low sludge production in the biodegradation stage.
Final separation by ultrafiltration using polymeric mem-branes in an immersed configuration (Zenon, ZeeWeed) worked very well as it could be operated at high fluxes (80 l/m2h), with a high recovery (98%), still permitting
oper-ational time of approximately 400 h before chemical cleaning was needed (approx. 600 h of operation at a flux of 60 l/m2h).
By modifying the operation mode (air scouring) and reactor design, the process can probably be further optimized. The use of ceramic microfiltration membranes (Metawater) for the final separation on the other hand caused severe fouling. This may be because the MF membrane is more prone to pore blockage due to submicron particles coming from the biofilter.
The OBM process is suitable for medium to low NOM containing water (20–40 mg Pt/l), and acts as an efficient hy-gienic barrier process producing high quality water. It has shown to be very robust and flexible, and it may be designed
8 H. Ødegaard et al.: NOM removal technologies – Norwegian experiences for removal of several micro pollutants. The cost estimation
has shown that the OBM process is competitive with conven-tional treatment processes (Azrague et al., 2009).
5 Sorption processes
GAC adsorption as well as ion exchange may be used for removing humic substances.
5.1 GAC adsorption
Direct activated carbon adsorption is not recommendable since the sorption capacity is quickly reduced by pore block-ing caused by the large HS molecules (Kaastrup and Halmo, 1989). GAC adsorption of NOM may be suitable as post-treatment for other processes (coagulation, ozonation etc.) that have removed or changed the HS-molecules to the ex-tent that the residuals may be sufficiently small to arrive at sites in the finer pores. GAC is not used as the only NOM-removing process in Norway, but is used as filter medium in ozonation/biofiltration plants.
5.2 Chemisorption (ion exchange)
Humic substances may be removed by macroporous anion exchangers because of the negative charge of the humic molecules at normal pH. The raw water is pre-treated in a micro-sieve (pore opening 50µm) or a rapid sand filter when the turbidity is higher than 0.5–1.0 FTU. Thereafter, the wa-ter is passed through ion exchange filwa-ters placed in parallel or in series. The process is only used in small plants in Norway in which only two ion exchange filters are used that normally are operated in series even though parallel operation is also possible.
An empirical model for the break-through curve as a func-tion of raw water concentrafunc-tion C0 (UV-ext., m−1), empty
bed contact time, tk(min) and filter run time, t (h) and tem-perature, T (◦C) has been developed (Ødegaard et al., 1989):
C/C0=0.04·C00.46·tk−0.67·t0.37·T0.13
The contact time is a more relevant parameter than the fil-ter velocity. Typically a contact time of at least 10 min at maximum flow is used when the goal is to bring the colour down to less than 10 mg Pt/l. If a lower treated-water colour is aimed for, a longer contact time will have to be used. Typ-ically a bed depth (h) of 0.5–2 m is used resulting in filtration rates of vf=hn60/tk where n is the number of columns in series and tkis contact time. It is recommended that the filter rate at design load does not exceed 20 m/h.
After breakthrough the ion exchanger has to be back-washed and regenerated. Normally an alkaline salt solution (2% NaOH+ 10% NaCl) is used. While the flow during normal operation is downwards, the flow during backwash is upwards while the flow during regeneration may either be
downwards or upwards. The regeneration solution is typi-cally reused 7–8 times and in such a manner that about 1/8 of the regeneration solution volume is substituted after each regeneration.
Until now, the magnetic ion exchange process (MIEX) is not applied at Norwegian water treatment plants.
6 Conclusions
Natural organic matter (NOM – with its main constituent humic substances), has several negative influences in water that is to be used for water supply and needs therefore to be removed. The characteristics of humic substances (MW, charge, hydrophobic and, aromatic nature etc.) give the op-portunity of several removal methods:
1. Because of the large molecular size NOM may be re-moved by molecular sieving, i.e. filtration through NF membranes. According to the Norwegian experiences, predominantly with cellulose acetate membranes (typ-ically 3 nm effective pore size), the plants should be designed for a moderate flux (<20 LMH) and recovery (<70%) and operated with daily light cleaning for foul-ing control. NF is suitable when the NOM concentra-tion and color is high.
2. Because of the charge and colloidal nature, NOM can be removed by coagulation and floc separation. Coag-ulant dose and pH of coagulation are the two most im-portant factors for achieving optimal treatment result. In most cases, the maximum residual metal concentration level (0.15 mg Me/L) determines the required coagulant dose level. Contact filtration is often used for raw water color levels up to about 50 mg Pt/L and turbidity lev-els less than 1–2 NTU. Above this a pre-separation step (settling/flotation) is recommended.
3. The color of NOM may effectively be removed by ozonation (or another strong oxidative method). Ox-idation has to be proceeded by biofiltration in or-der to lower the growth potential of the water. Typical O3-dosages are 0.15–0.20 mg O3/mg Pt or 1–
1.5 mg O3/mg TOC. Necessary biofilter EBCT is around
20–30 min. Ozonation/biofiltration is recommended for relatively low color levels, typically below 35 mg Pt/l. Otherwise the biogrowth potential created by the ozona-tion may be too high for the biofilter to handle.
H. Ødegaard et al.: NOM removal technologies – Norwegian experiences 9
Edited by: B. Heijman
References
Azrague, K., Østerhus, S. W., and Leiknes, T.: Assessment of the OBM-process for drinking water treatment, Proc. Int. Wisa Membrane Technology Conference 2009, Stellenbosch, South-Africa, 13–15 May 2009.
Bolto, B. A., Dixon, D. R., Eldridge, R. J., and King, S. J.: The use of cationic polymers as primary coagulants in water treatment, in: Chemical water and wastewater treatment V, edited by: Hahn, H. H., Hoffmann, E., and Ødegaard, H., Springer Verlag, Berlin Heidelberg, 173–185, 1998.
Eikebrokk, B.: Removal of humic substances by coagulation, in: Chemical water and wastewater treatment V, edited by: Hahn, H. H., Hoffmann, E., and Ødegaard, H., Springer Verlag, Berlin Heidelberg, 173–187, 1996.
Eikebrokk, B.: Aspects of enhanced coagulation-contact filtration process optimisation, Proc. Workshop on utilization of NOM characteristics to improve process selection and performance. AWWARF, Vivendi Water, CRC for Water Quality and Treat-ment, Berlin Germany, 9–12 Oct 2001.
Eikebrokk, B., Juhna, T., and Østerhus, S. W.: Water treatment by enhanced coagulation – Operational status and optimization issues, Techneau, D 5.3.1, http://www.techneau.eu, December 2006.
Eikebrokk, B., Juhna, T., Melin, E., and Østerhus, S. W.: Water treatment by enhanced coagulation and oxonation-biofiltration: Intermediate report on operation optimization procedusre and trielas, Techneau, D 5.3.2A, http://www.techneau.eu, December 2007.
Eikebrokk, B., Fabris, R., Drikas, M., and Chow, C.: NOM Char-acteristics and Treatability by Coagulation, in: Chemical Water and Wastewater Treatment IX, edited by: Hahn, H. H., Hoffman, E., and Ødegaard, H., IWA Publishing, London, 207–219, 2007. Fabris, R., Chow, C. W. K., Drikas, M., and Eikebrokk, B.: Com-parison of NOM character in selected Australian and Norwegain drinking waters, Water Res., 42, 4188–4196, 2008.
Fløgstad, H. and Ødegaard, H.: Treatment of humic waters by ozone, Ozone Science and Engineering, 7, 121–136, 1985. Thorsen, T. and Fløgstad, H.: Nanofiltration in drinking water
treatment, Literature review, Techneau, D 5.3.4B, http://www. techneau.eu, December 2006.
Thorsen, T.: Fundamental studies on membrane filtration of coloured surface water, Dr-thesis, Norwegian University of Sci-ence and Technology (NTNU), November 1999.
Kaastrup, E. and Halmo, T.: Removal of aquatic humus by ozona-tion and activated-carbon adsorpozona-tion, Chapter 39, in: Suffet and MacCarthy: Aquatic Humic Substances. Influence on Fate and Treatment of Pollutants, Advances in Chemistry Series 219, American Chemical Society, 1989.
Kvinnesland, T. and Ødegaard, H.: The effects of polymer charach-teristics on nano particle separation in humic substance removal by cationic polymer coagulation, Wat. Sci. Tech., 50, 12, 185– 191, 2004.
Machenbach, I. and Ødegaard, H.: Relevance of flocculation in in-tegrated membrane processes for NOM removal, in: Chemical water and wastewater treatment VII, edited by: Hahn, H. H., Hoffmann, E., and Ødegaard, H., IWA Publishing, London, 245– 254, 2004.
Melin, E., Skog, R., and Ødegaard, H.: Ozonation/biofiltration with calcium carbonate as biofilter media, in: Recent Progress in Slow Sand and Alternative Biofiltration Processes, edited by: Gimbel, R., Graham, N. J. D., and Colllins, M. R., IWA Publishing 2006, 406–413, ISBN 9781843391203, 2006.
Melin, E. and Ødegaard, H.: The effect of biofilter loading rate on the removal of organic ozonation by-products, Water Res., 34, 18, 4464–4476, 2000.
Meyn, T., Leiknes, T., and Ødegaard, H.: Coagulation/flocculation – ceramic membrane filtration for removal of natural organic matter (NOM) under Norwegian conditions, Proc. IWA Confer-ence on Membranes for Water and Wastewater treatment, Harro-gate, UK, 15–17 May 2007.
Saltnes, T., Eikebrokk, B., and Ødegaard, H.: Contact Filtration of Humic Waters, performance of an expanded clay aggregate filter (Filtralite) compared to a dual anthracite/sand Filter, Water Science and Technology: Water Supply, 2, 5–6, 2002.
Saltnes, T., Eikebrokk, B., and Ødegaard, H.: Coagulation opti-mization for NOM removal by direct filtration in clay aggregate filters, Water Supply: Research and technology – AQUA, 51, 2, 125–134, 2001.
Ødegaard, H. and Koottatep, S.: Removal of humic substances from natural waters by reverse osmosis, Water Res., 16, 613–620, 1982.
Ødegaard, H., Brattebø, H., and Halle, O.: Removal of humic sub-stances by ion exchange, Chapter 45, in: Suffet and MacCarthy: Aquatic Humic Substances. Influence on fate and Treatment of Pollutants, Advances in Chemistry Series 219, American Chem-ical Society, 1989.
Ødegaard, H. and Thorsen, T.: Removal of humic substances by membrane processes, Chapter 42, in: Suffet and MacCarthy: Aquatic Humic Substances. Influence on Fate and Treatment of Pollutants, Advances in Chemistry Series 219, American Chem-ical Society, 1989.
Ødegaard, H., Eikebrokk, B., and Storhaug, R.: Processes for the removal of humic substances from water – An overview based on Norwegian experiences, Wat. Sci. Tech., 40(9), 37–46, 1999. Ødegaard, H., Thorsen, T., and Melin, E.: Practical experiences from membrane filtration plants for humic substance removal, Wat. Sci.Tech., 41, 10–11, 33–41, 2000.
Ødegaard, H., Melin, E., and Leiknes, T.: Ozonation/biofiltration for treatment of humic surface water, in: Recent Progress in Slow Sand and Alternative Biofiltration Processes, edited by: Gimbel, R., Graham, N. J. D., and Collins, M. R., IWA Publishing, 397– 405, ISBN 9781843391203, 2006.
Østerhus, S. W. and Azrague, K.: Removal of NOM by an
Oxidation-Biofiltration-Membrane filtration (OBM) process, Or-ganic Geochemistry, submitted, 2009.