Page 181
FUZZY LOOK-UP TABLE FOR KNOWLEDGE MANAGEMENT AND DECISION MAKING
Pascual Noradino Montes Dorantes1,2, Marco Aurelio Jiménez Gómez2, Adriana Mexicano Santoyo2, Gerardo Maximiliano Méndez3
1Universidad Autónoma del Noreste. División de Estudios de posgrado e investigación. Blvd. José Musa de León y General Medardo de la Peña S/N Col. Los Pinos, CP 25100, Saltillo, Coahuila,
México.
2Instituto Tecnológico de Ciudad Victoria/División de estudios de posgrado e investigación. Boulevard Emilio Portes Gil #1301 Pte. A.P. 175, C.P. 87010, Ciudad Victoria, Tamaulipas, México.
Ph. (52) 834 153 2000 ext. 306.
3Instituto Tecnológico de Nuevo León, Av. Eloy Cavazos 2001, Guadalupe, Nuevo León, México. Posgrado en Ingeniería Mecatrónica.
Abstract
The knowledge management is one of the most important tasks in education. The main problem presented in this process is the transmission of the knowledge and the understanding of the student. In this area, the interpretation produces variations of a concept and this condition produces errors. The use of the expert systems provides an interpretation with a degree of freedom to evaluate a concept and allows the knowledge management without expertise. The results obtained show that the expert approach provides an evaluation with a tolerable variation accepted by the principal organizations dedicated to measurement and standardization.
Key words: knowledge management, uncertainty reduction, T1 SFLS, Fuzzy, Teaching-learning process
1. INTRODUCTION
The knowledge management represents a challenge for the enterprises such as educational centers. The expert systems arise to contain and generate knowledge. In this sense there are some approaches as the evolutionary computing and its evolutionary strategies proposed by Rechenberg, I. (1973), the genetic algorithms (GA), proposed by Holland (1992), artificial neural networks (ANN) proposed by Mc Culloc & Pitts (1946), and the fuzzy logic (FL) proposed by Lofty Zadeh (1965) all of them well knowns as being capable of manage knowledge.
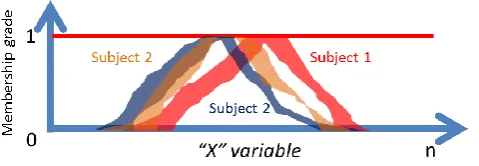
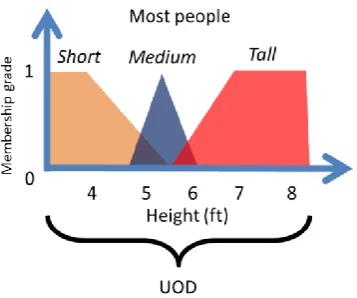
Fuzzy logic is known as having the advantage of providing a chance to use linguistic in evaluation of knowledge. The knowledge management is generated via mathematical calculus in order to obtain a standardized response that is converted on a linguistic response after evaluation, this happens because the word means different things to different people (Mendel, 2001: 68; Mendel, 2007) see, fig. 1 and the uncertainties. In literature there are several examples of it on of these examples are the linguistic codification of the height of the people (Fig. 2). See, Mendel, (2001:25).
Page 182
Fig. 2. Interpretation of height concept, obtained by expert poll Source: Mendel, JM. (2001), p. 25.
2. FUNDAMENTALS 2.1. Decision making
There are some models for decision making process documented in literature. But, the theories related to decision making require learning, knowledge and interpretation of knowledge, all of them limited in a specific community. Then, the knowledge management and its interpretation are restricted to a context or to a particular discipline (Hibbert, Siedlok and Beech, 2014). In fact, Sawant & Chakrabarti (2013) say that the context in language, learning and interpretation produce variation in the management of knowledge, that factors produce multidisciplinary variations in the understanding that generates a different answer for every discipline and for every person.
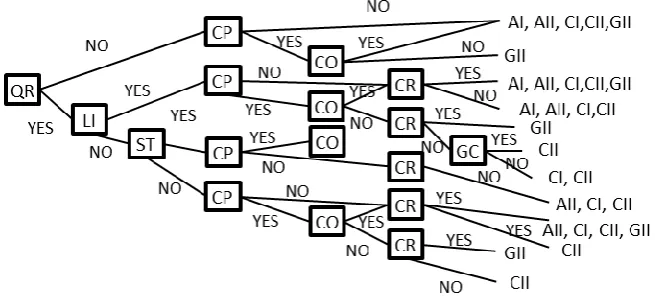
In the normative decision model (Vroom & Yetton, 1973), which presents variations in literature, the output of the model provide multiple answers for a particular case (Fig. 3). The multiple answers avoid the variations caused by the context, interpretation and knowledge management.
Fig. 3. Normative decision model
Source: Hughes, Ginnett & Curphy, (2006), p, 365.
Page 183 2.2. Computing with words
Computing with words (CWW) is a necessity when the knowledge has a lack or, it is missing, and/or too imprecise. CWW fuses the natural language with a measurement tool to produce an adequate management of knowledge when it has imprecise boundaries caused by the context and interpretation. That factors produce strife defined as incongruence, discordance or discrepancy, fuzziness or vagueness or unclearness, imprecision or non-specificity about a context (Klir and Wilerman, 1998:103, in Mendel, 2001:67). CWW avoids the context problems that include:
The meaning of words used
The measurement of the concept
The consequence of the meaning used
CWW is a method for reasoning, computing, decision making (Mendel, Zadeh, Trillas, Yager, Lawry, Hagras & Guadarrama, 2010), and knowledge management using natural language. Finally, CWW enables the codification to change the words to numbers and vice versa by using numeric intervals to produce an answer in a multivariate problem that requires a multivariate approximation when the variables are not compatible in several cases.
2.3. Fuzzy logic
Fuzzy logic provides a chance to evaluate linguistic variables instead of a crisp value using membership grades, these values are given by (1). The evaluation is more abundant and adequate to the human reasoning and natural language by the use of conditional sentences of the form (2) called fuzzy rules. The purpose of (Zadeh, 1965) and (Zadeh, 1975) provides a flexible evaluation that brings multiple answers to a concept,
2 ) ( 2 1 ) , ; ( c x
x gauss x c e
(1)
where: xis the membership grade of the variable, x represents the variable, c represents the mean of
the X set and σ represents the width of the set,
𝑅𝑢𝑙𝑒 𝑙: 𝑖𝑓 𝑋1 𝑖𝑠 𝑎 𝑎𝑛𝑑 … 𝑎𝑛𝑑 𝑋𝑝 𝑖𝑠 𝑎𝑛 𝑡ℎ𝑒𝑛 𝑦 𝑖𝑠 𝐺 (2) 𝑛 = 1, 2, … , 𝑀
where: Xn are the input variables and 𝐺 is the output response, X represents the crisp inputs of the
model.
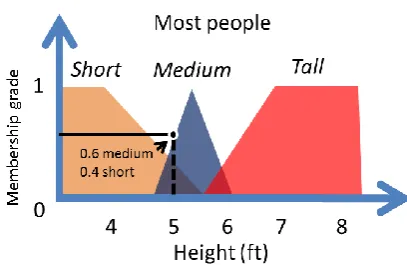
The fuzzy logic method requires a description of the space of values that the variable can take. The space is called the universe of disclosure or a universe of discussion (UOD). In Fig. 4, the variable height reduce their membership to a set when is approaching to certain value that pertains to another set. The variable can have values in two or more sets with membership grades for every set (Fig. 5).
Page 184
Fig. 5. Membership grades for 5ft height.
3. LOOK-UP TABLE PROCESS
The knowledge management represents a challenge for the educational centers. The expertise of the teachers needs to be interpreted by the students. The multi-answer solution provides a flexible evaluation based on knowledge management that includes context and the behavior of natural language.
The look-up table process consists in the use of the UOD to convert the linguistic values to numeric values that are evaluated in conjunction to obtain a response in a conditional sentence equivalent to a mathematical function that represents the whole model. This conversion gives the opportunity to use all values of membership of the linguistic input in different sets in the output. The major value obtained represents the more adequate output based on knowledge.
4. LOOK-UP TABLE METHODOLOGY FOR KNOWLEDGE MANAGEMENT The method to assemble the look-up table model following the next steps:
To Establishing the linguistic variables used as inputs.
To collecting the data from a poll.
To coding the data onto numbers.
To mapping the data onto a fuzzy UOD.
To establishing a polynomial equation that represents the whole model from a heuristic model.
To obtaining a numeric output.
To decoding the numeric output onto a linguistic answer.
5. CASE OF STUDY
Page 185
Step 1. Establish a table of numeric equivalences for every state in every input variable (Table 1). Table 1. Numeric codification of inputs
Variable states Numeric equivalence
Yes 1
No 0
Step 2. Establish a table of numeric equivalences for every state in every output variable (Table 2). Adapted from: Vroom & Yetton, (1973).
Table 2. Numeric codification of outputs
Variable Numeric
equivalence Code Meaning
A1 Autocratic 1, The student (or person) solves the problem or make the decision by itself, using the information available at that time.
100
A2 Autocratic 2, The student obtains any necessary information from subordinates, and then he decides and makes the decision by itself.
200
C1 Consultant 1, The person shares the problem with relevant subordinates in a personal way, he obtains ideas and suggestions and he does not share them together as a group. Then it makes the decision. The decision may or may not reflect the subordinates' influence.
300
C2 Consultant 2, The person shares the problem with your subordinates in a group meeting. In this meeting the person obtains ideas and suggestions. Then the person makes the decision which may or may not reflect the subordinates' influence.
400
G2 General 2, The person share the problem with your subordinates as a group. All together generate and evaluate alternatives and attempt to reach agreement (consensus) on a solution. The role of the person is like the chairman; coordinating the discussion, keeping it focused on the problem, and making sure that the critical issues are discussed.
500
Step 3. Map the input/output data onto a fuzzy UOD.
Equation (1) and its graphic depiction (Fig. 6) were obtained from the classic theory of fuzzy sets (Mendel, 2001:19).
𝐴 = 𝜇𝐴(𝑥) = {
1 𝑖𝑓 𝑥 ∈ 𝐴
0 𝑖𝑓 𝑥 ∉ 𝐴 (1)
where: A=x|x meets any condition(s), A represents the variable, 𝜇𝐴(𝑥) represents the membership to a set, and x represents the input value, subject to (2).
Page 186
Fig. 6. Crisp set. Source: Arredondo, T., (2014), p, 12.
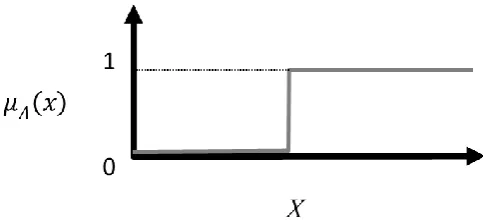
The equation 1 is used to fill the variable values in the polynomial equation to approximate the solution. In this case, a fuzzy set was used (Fig. 7) instead a crisp set that doesn’t include an indecision state. The numeric codification for the UOD input is depicted in Fig. 8.
Fig. 7. Linguistic fuzzy sets of input variables.
Fig. 8. Numeric fuzzy sets of input variables.
The UOD output is generated assembling 5 possible solutions, the solution are coded using the values in table 2. The graphical description of the linguistic UOD output is depicted in Fig. 9. The numeric output is depicted in Fig. 10.
Fig. 9. Linguistic UOD output.
Page 187
Using the fuzzy logic as a tool for computing with words, the problems of perception and adaptation presented due the personal reasoning are solved. In particular, the type-1 fuzzy logic contains the uncertainty in a set and manages the uncertainty caused by receiving multiple responses provided by multiple users. In this sense, the look-up table helps to provide an answer that takes in account all the perceptual variations.
Step 4. Establish a polynomial equation that represents the whole model using a heuristic model. To approximate a solution that manages the knowledge exist a series of mathematical algorithms called heuristics such as the least squares method.
e.g the least squares method is given by (3),
𝑦̂ = 𝛽0+ 𝛽1𝑥1+ 𝛽2𝑥2+ ⋯ + 𝛽8𝑥8+ 𝜀 (3)
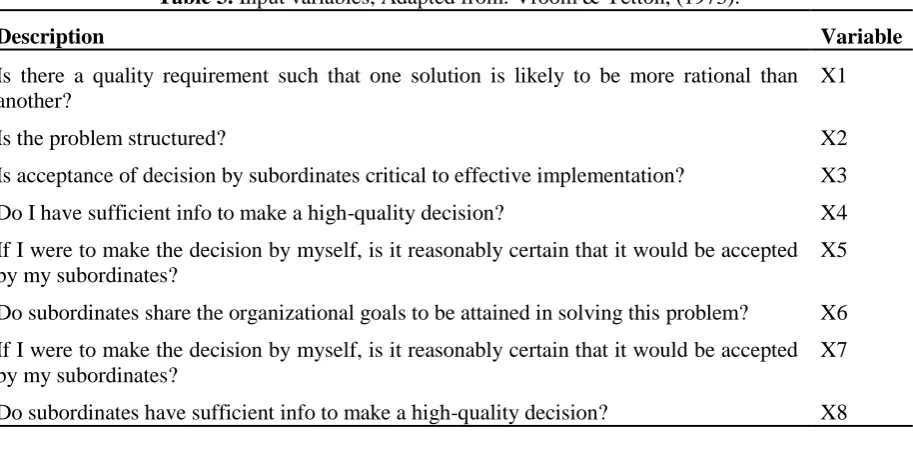
where: 𝑦̂ represents the approximation, 𝛽̂ represents the estimator set (𝛽0, 𝛽1, … , 𝛽8) obtained from the input variable matrix (X) defined in table 3 and given by (4), and 𝜀 represents an error rate.
Table 3. Input variables, Adapted from: Vroom & Yetton, (1973).
Description Variable
Is there a quality requirement such that one solution is likely to be more rational than another?
X1
Is the problem structured? X2
Is acceptance of decision by subordinates critical to effective implementation? X3 Do I have sufficient info to make a high-quality decision? X4 If I were to make the decision by myself, is it reasonably certain that it would be accepted by my subordinates?
X5
Do subordinates share the organizational goals to be attained in solving this problem? X6 If I were to make the decision by myself, is it reasonably certain that it would be accepted by my subordinates?
X7
Do subordinates have sufficient info to make a high-quality decision? X8
𝛽̂ = (𝑋′𝑋)−1𝑋′𝑦 (4)
where: 𝛽̂ represents the estimator set obtained from the input variable matrix (X), X’ represents the transpose matrix and the super index -1 represents the inverse of the matrix product, and y represents the solution vector of the knowledge used.
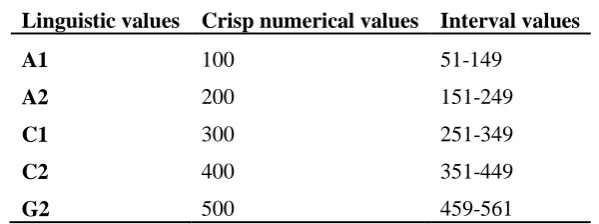
Step 5. Obtaining numeric approximation for the state achieved in step 4.
Page 188
Linguistic values Crisp numerical values Interval values
A1 100 51-149
A2 200 151-249
C1 300 251-349
C2 400 351-449
G2 500 459-561
6. RESULTS
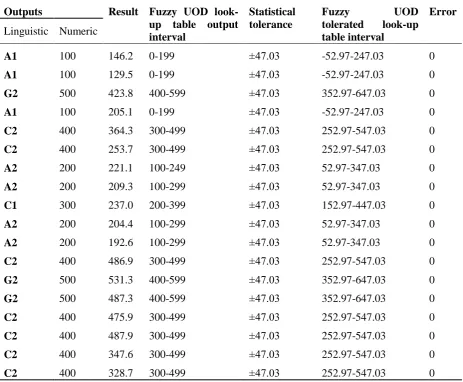
In table 5 is exposed the results obtained from the approximation equation (3) and the proposed outputs provided by expert poll.
The table 4 is divided in the following form:
Column 1 (Linguistic outputs) shows the desired output in a linguistic form.
Column 2 (Numeric outputs) shows the desired output in a numeric form.
Column 3 (Approximation) shows the output degenerated by the mathematical function designed for manage the existent knowledge.
Column 4 (Fuzzy look-up table interval) presents the interval generated by the fuzzy UOD and represents the spread (100 units for every set) of the output set (e.g. A1= 100, then their interval is 51 to 149) created for the look-up table. This column is used to compare the approximation against the desired output taking in account the uncertainty and the spread of the output category set.
Column 5 (Statistical tolerance) presents the statistical tolerance for the process. This tolerance is generated by the specifications given by the International organization for standardization (ISO), National Institute of Standards and Technology (NIST) and the Bureau international de poids et mesures (BIMP), among others. The statistical tolerance is obtained by the following steps:
1. Obtain the descriptive statistics given by (5, 6) from the existent knowledge (Column 2 of Table 4),
𝑥̅ = ∑𝑛𝑖=1𝑥𝑖 (5)
where: 𝑥̅ represents mean or the average of the variable x, 𝑥𝑖 represents the value of every observation, i represents the number of observation, and n represents the number of total of observations.
𝜎 = √∑ (𝑥𝑛𝑖 𝑖−𝑥̅)2
𝑛 (6)
where: 𝜎 represents the standard deviation of the data, 𝑥̅ represents the mean of the variable, 𝑥𝑖 represents an specific observation, and n represents the number of total observations.
Page 189
From this variation, the UOD changes their spread from 200 (Fig. 10) to 294.06 as shown in Fig. 11. It happens because the statistical spread (𝜎) of the existent knowledge is superior to the established in the original model.
Fig. 11. Numeric output for tolerated UOD.
3. From the tolerated output UOD, the coefficients to determinate the output intervals and the error in next step are obtained.
Column 6 (Error) shows the error obtained by the evaluation of the approximation versus the interval in look-up table. The difference obtained represents the magnitude of error.
Table 5. Results obtained from the approximation equation.
Outputs Result Fuzzy UOD
look-up table output interval
Statistical tolerance
Fuzzy UOD
tolerated look-up table interval
Error Linguistic Numeric
A1 100 146.2 0-199 ±47.03 -52.97-247.03 0
A1 100 129.5 0-199 ±47.03 -52.97-247.03 0
G2 500 423.8 400-599 ±47.03 352.97-647.03 0
A1 100 205.1 0-199 ±47.03 -52.97-247.03 0
C2 400 364.3 300-499 ±47.03 252.97-547.03 0
C2 400 253.7 300-499 ±47.03 252.97-547.03 0
A2 200 221.1 100-249 ±47.03 52.97-347.03 0
A2 200 209.3 100-299 ±47.03 52.97-347.03 0
C1 300 237.0 200-399 ±47.03 152.97-447.03 0
A2 200 204.4 100-299 ±47.03 52.97-347.03 0
A2 200 192.6 100-299 ±47.03 52.97-347.03 0
C2 400 486.9 300-499 ±47.03 252.97-547.03 0
G2 500 531.3 400-599 ±47.03 352.97-647.03 0
G2 500 487.3 400-599 ±47.03 352.97-647.03 0
C2 400 475.9 300-499 ±47.03 252.97-547.03 0
C2 400 487.9 300-499 ±47.03 252.97-547.03 0
C2 400 347.6 300-499 ±47.03 252.97-547.03 0
Page 190
above. All variations are according to ISO, NIST, among others (Taylor, 2009; ISO, 1993). These variations are according to a one standard deviation (spread of the fuzzy set) that represents 149 units in this case. The additional values are corresponding to a human reasoning and interpretation. This is an additional quantity (49 additional units on every side of the mean) on the limits of the set, when the uncertainties of the interpretation are taken into account.
The mean error is in order of 3.15 units that represents an acceptable variation in simulated systems processing knowledge in an artificial form (Demant & Streicher, 1999).
7. CONCLUSIONS
The obtained results show reliability equal to or superior to the model originally proposed. They provide a simplification of the process to solve by using a single mathematical formula that facilitates the knowledge management.
The knowledge management provided by the proposal shows that, the approximation model used produces an accuracy near to 100%.
The accepted tolerance described by international organizations dedicated to the standardization and measurement absorbs the uncertainties due to the interpretation and it allows the knowledge management with limited information.
REFERENCES
Arredondo, T 2014, Introducción a la Lógica Difusa, viewed 14 March 2017, <http://profesores.elo.utfsm.cl/~tarredondo/info/soft-comp/Introduccion%20a%20la%20Logica%20 Difusa.pdf>
Demant, C. & Streicher-Abel, B 1999, Industrial image processing, Springer-Verlag.
Hibbert, P, Siedlok, F and Beech, N, 2014, ‘The Role of Interpretation in Learning Practices in the Context of Collaboration’. Academy of Management Learning & Education, vol. 15, no. 1, pp.26-44.
Holland, J H 1992, Adaptation in natural and artificial systems: an introductory analysis with applications to biology, control, and artificial intelligence, MIT press.
Hughes, RL., Ginnett, RC & Curphy, GJ 2006, Liderazgo: Cómo aprovechar las lecciones de la experiencia, McGraw-Hill Interamericana.
ISO 1993. Guide to the expression of uncertainty in measurement. International Organization for Standardization (ISO), Geneva
Mc Culloch W and Pitts W, 1946, ‘A logical Calculus of the Ideas Immanent in nervous activity’, Bulletin of Mathematical Biophysics, vol. 5, no. 4, pp. 115-133.
Page 191
Mendel, JM, 2007, ‘Computing with words and its relationships with fuzzistics’, Information Sciences, vol. 177, no. 4, pp.988-1006.
Mendel, JM., Zadeh, LA, Trillas, E, Yager, R, Lawry, J, Hagras, H, & Guadarrama, S 2010, ‘What computing with words means to me’ [discussion forum]. IEEE Computational Intelligence Magazine, vol. 5, no. 1, pp. 20-26.
Nahavandi, A 2012, The art and science of leadership. Pearson Prentice Hall, Sixth edition, Upper Saddle River, New Jersey.
Rechenberg, I 1973, Evolutionsstrategie, Optimierung technischer Systeme nach Prinzipien der biologischen Evolution, Stuttgart: Frommann Holzboog.
Sawant, U, & Chakrabarti, S 2013, ‘Learning joint query interpretation and response ranking’, Proceedings of the 22nd international conference on World Wide Web. (pp. 1099-1110). ACM.
Taylor, BN 2009, Guidelines for Evaluating and Expressing the Uncertainty of NIST Measurement Results, DIANE Publishing.
Vroom, VH, & Yetton, PW 1973. Leadership and decision-making. (Vol. 110). University of Pittsburgh Press.
Zadeh, LA 1965, ‘Fuzzy Sets’, Information and control. vol. 8, no. 3, pp.338-353.