Policy and Planning Unit, published date – October 2014
2013 ANNUAL STATISTICAL DIGEST (ASD)
MINISTRY OF EDUCATION & TRAINING
Republic of Vanuatu
Ministry of Education and Training
Annual Statistical Report
2013
Published by the Policy and Planning Unit, MoET
© 2013
For statistics on education and Training in Vanuatu contact:
Ministry of Education & Training Private Mail Bag 9028
Port Vila, VANUATU
Director General of Education and Training
It is an honor to present the 6th edition of the 2013 Annual Statistical Digest (ADS) for the Ministry of Education and Training (MoET). The statistical annual digest highlights most of the recent statistical data and indicators on the Education sector. The calculation of most indicators relevant for policy development, planning, monitoring and evaluation can be generated in the Vanuatu Education Management information System (VEMIS). Most of the indicators and administrative data that are included in the digest could be used as evidence-based information to support our national development strategies and the monitoring and evaluation progresses against the national strategic goals and international commitments such as the Education For All (EFA) and the Millennium Development (MDG) goals by 2015.
While data becomes more and more relevant in all aspects of policy and planning developments in the education sector, the Vanuatu MoET among other countries in the Asia-Pacific region is committed in producing the 2015 EFA review. The national EFA review aimed to review progress and to identify gaps, problems, issues, policies and strategies for further education reform especially in ensuring that the education in Vanuatu would also reach the unreached groups. The review report is also using the same statistics data and indicator that is published in this 2013 Annual Statistical Digest.
As the MoET is responsible for its policies and actions, including that of ensuring the attainment of national and international goals, the effort to develop a Monitoring and Evaluation (M&E) framework is very critical and essential for the accountability of our government resources. The M&E development process will require input and outcome indicators as variables to measure progress against our targets and achievements. In raising the importance over the use of education statistics, it is important to highlight how data becomes very much significant in the planning and implementation process of the ministry’s annual work plans, budget preparations and other specific activities and projects that are funded under the government recurrent budget and Vanuatu Education Support Programme (VESP) funding agreement. The MoET one of the biggest portfolio in the government sectors is getting the highest portion of the national government budget and receives over 1 billion Vatu in 2013 from our main development partners in Vanuatu which are Australia and New Zealand and from the non-pool-partners.
I congratulate the Policy and Planning Unit for producing this annual statistical digest (ASD) and for the great efforts in undertaking continuous review of the VEMIS system in order to address the data needs that the MoET require in order to assess the impact of access, quality and management in the education sector.
I am pleased to see that there are promising efforts in terms of funding and resources that were set aside to support the review of the Vanuatu Education Management information system, however I strongly encouraged sustainable interactions between the New VEMIS in the MoET and other information systems within the MoET and other line Ministries that keep records of schools and all the other training institutions in the country.
The 6th edition of the Annual Statistical Report is a public document therefore I hope that all readers will make great use of the data and indicators that are published in this report for the continuous benefits of our education development.
Jesse Joe Dick
Director General of Education and Training
Director of Policy and Planning Unit
In support to the forward remarks of the Director General, I would like to acknowledge all the efforts put together in compiling the 6th edition of the 2013 Annual Statistical Digest. This Annual Statistical Digest would not have been complete without the help and the hard work of the staff and associated institutions of the MoET.
First and for most, I would like to thank all the kindergarten teachers for their time and support in completing and submitting their 2013 VEMIS survey forms. As the director of Policy and Planning Unit, I acknowledge your efforts and participation in providing your data on time to our six provincial education offices.
Secondly, I would like to thank all the primary school heads who have submitted their 2013 VEMIS survey forms. Without your interventions, the MoET would not be able to produce this digest. The MoET highly appreciated your hard work and would like to thank you and all the school managements for the assistance in helping out in this process.
Thirdly, this report covers data on secondary education as well. Therefore I would like to extend my thank you to all the school principals in the country who took time to complete and submit their 2013 VEMIS survey forms. All the school data were stored in VEMIS and 85% of the data is published in the 6th edition of the 2013 Annual Statistical Digest of the MoET.
Lastly, I would like to extend my gratitude to all the principals and Directors of the Post-Secondary Institutions in Vanuatu, the Head of USP and AUF in Port Vila, the Director of the Vanuatu Rural Development and Training Centre’s Association (VRDTCA), the Acting Director of TVET sector, the Head of the Scholarship’s unit and the Principal Officer of the National Exam’s unit, the Director of the National Statistics Office in Port Vila and the Director of Finance Unit within the MoET for their input in this annual statistical digest.
May I take this opportunity to congratulate my team within the Policy and Planning Unit especially the VEMIS team for the job well done in compiling the 6th edition of the Annual Statistics Digest (ASD) and a special thank you to the Education Services for the efficient work efforts done by the Provincial Statistics and Distribution Officers who have recorded all the school information in VEMIS on time despite the challenges faced especially with the slow access of internet to the Provinces.
I also would like to acknowledge the participation of all key officials of the MoET, the Education experts, our development partners and all the stakeholders who have proof-read this report. I take this opportunity to encourage all the users of this digest to consider this report as a source of information to all your reports in the future.
John Niroa
Director of Policy and Planning Unit
Key results
1. Increasing Access to education
There are policies and programme developed to improve access to education at all levels. School enrolment represents 28.2 percent out of the estimated total population of Vanuatu in 2013. There are new aspirations and resource integrations to improve access to education in Vanuatu. One of the major incentives back in 2010 was the earmark of the primary school grants. The enrolment change in primary education has shown a large increase in primary school enrolment from 38,762 in 2009 to 41,783 in 2010. There was an increase of more than 1 percent a year on primary school enrolment between 2010 and 2013. This increase also showed that there is no gender inequality in terms of access to education which is in line with the Universal Primary Education (UPE) policy objectives for gender equality, seeing that the gender parity is well represented in primary education.
More incentives are given in terms of finance and technical
inputs towards increasing the access in the early childhood development since 2009. The gross enrolment rate is an indicator to monitor progress against smaller children’s participation in the kindergarten schools; however the GER in ECCE was 66.1% in 2012 and decreased by 3% in 2013. The gross enrolment rate (GER) in primary education 1 to 6 has fluctuated over time since 2009; the GER was 119.4% in 2013 as compared to 110.9% in 2009. The Net Enrolment Rate (NER) in primary has increased by 1% between 2009 and 2013; however the average NER was at 86.8% between
2011 and 2013.
The average gross enrolment rate in secondary education (Years 7 - 13) is at 42.1% between 2009 and 2013. On the other hand, the gross enrolment rate (GER) in Secondary education was at 48.1% in 2013 which is way below 100%. A difference of 51% of students aged 13 to 18 years old are not enrolled in secondary schools or would have enrolled in TVET schools and other non-formal institutions.
Progression to formal tertiary studies is another
important field within the education sector which absorbs over 16% of the MoET recurrent budget. In 2013, there are more than 200 new student awardees of which more than 40% of those awardees are degree program students.
NER in primary education remains steady at 86.3% as compared to 86.7% in 2012.
(10,000)(8,000) (6,000) (4,000) (2,000) - 2,000 4,000 6,000 8,000 3 4 5 6 7 8 9 10 11 12 13 14 15 16 17 18 19 20 21 22 23
Graph showing enrolment and estimated population in 2013
Est.Population 2013 2013 Enrolment Age
111.7% 110.8% 116.9% 118.1%
121.0% 119.4%
87.1% 85.6% 87.7% 87.4% 86.7% 86.3%
2008 2009 2010 2011 2012 2013
Source: VANSTA report 2009
Progress from formal education to post-secondary institutions and rural training centers varies according to the contexts and the schooling structure of non-formal tertiary and informal institutions in the country. VEMIS has recorded over 3,000 students who enrolled in the existing post-secondary schools in the country namely the Vanuatu Maritime College, VITE, VIT, Vanuatu Agriculture College and Vanuatu Nursing College and the Australian Pacific Training College (APTC) in Vanuatu. The actual VEMIS system does store data on formal and non-formal tertiary education.
2. Improve Quality of Education
Goal one for the Education For All (EFA) is looking at “expanding and improving comprehensive Early Childhood Care and Education”, especially for the most vulnerable and disadvantaged children. The Vanuatu Government 2020 vision also looks at improving the quality of the Early Childhood in terms of introducing and providing standard professional practices for the service providers.
Moreover, in providing for universal Early Childhood Care and Education, many disparities of opportunity and attainment at the primary and later levels might thereby be eliminated. Between 2013 and 2014, the MoET has set up some policy
priorities to improve the quality of teaching and learning in schools. The student-classroom ratio is also used as an indicator of quality and is showing a big gap in urban and rural schools. In average, the student-classroom ratio (SCR) is at 52.1 in urban schools and 20.6 in rural schools. By focusing on primary schools only, the gap on the SCR between the government and government assisted
urban and rural schools is an important area to closely monitor.
Another important indicator which is relevant to measure progress against the quality of learning and teaching in our schools is the percentage of trained teachers. VEMIS shows that there are 3,738 teachers in the existing kindergarten, primary and secondary schools in the country. However, 57.6% of these teachers are certified to teach. There are 2,404 qualified teachers in Vanuatu in 2013, however the term “qualified” is defined as teachers that are not trained at VITE but has some other academic qualifications. Certified teachers are those with either an academic qualification and have been trained at VITE. The 2013 VEMIS data showed that there are 1,334unqualified teachers that are currently teaching on temporary and contract basis.
The development of the new curriculum is another milestone in the MoET. Lots of efforts were set aside to improve the learning outcomes at the school level. There was a major distribution of textbooks in 2011 and resulting with the student-textbook ratio is of 3.1 in primary and 3.3 at secondary education.
Sanma Tafea Shefa Penama Malampa Torba 17.3 23.3 24.1 18.8 19.2 19.8
45.6 54.9
Student: Classroom ratio - Primary Education - 2013 Govt & Govt Assisted Schools
However, some textbooks need to be replaced as they are currently old and in poor condition. VEMIS recorded a total of 2,742 textbooks that required immediate reprinting of which a total 2,421 textbooks in primary schools and 321 in secondary schools.
Another important area that needs to be considered is providing proper equipment and resources for our school libraries. Moreover, 399 primary schools have library resources as well as in 83 secondary schools. Improving literacy and numeracy is one of the Vanuatu MoET priority outcomes. There are researches and studies that confirmed that the level of literacy and Numeracy at the early grades of primary remain low. However two VANSTA reports have been released in 2007 and 2009.
Since 2007, the Vanuatu MoET has administered the Vanuatu Standardized Test of Achievement (VANSTA), a national assessment to monitor literacy and numeracy skills of students in
grade 4 and 6 of primary education. VANSTA’s 2007 and 2009 have revealed that a large percentage of students are failing to achieve the standard reading comprehension and writing outcomes expected at the regional level (SPBEA 2009). While VANSTA provides an indication that many students are not reading at levels thought to be appropriate for grade 4 and 6, it does not provide detailed findings around the issues and problems in primary schools that could lead to poor reading performance in grades 1 to 3. These levels of achievements are derived from the curriculum outcomes at Year 4 in English and Math subjects. Six levels are used to describe the learning outcomes in primary, ranging from L5, the highest through L4, L3, L2, L1, to L0, the lowest.
The assessment results of the year 8 examination are based on the standard means and scores as set by the MoET. The actual means by subject are categorized out of the average score range (31-69). The highest mean out of 100 was 48.8 in the English subject for the year 8 English speaking schools and 48.7 in the French subject for the French speaking schools.
Between 2009 and 2013, the transition rate to year 9 in average was 83.9%, where VEMIS recorded a gradual increase at 79.1% in 2009 to 89.2% in 2013. Out of the 100% of students who sat the national year 8 examinations, less than 100% were selected to year 9; it is likely that the difference of 89.2% out of 100% transition rate to year 9 could repeat year 8 in 2014. However there is a need for a more in-depth analysis to actually track where these students are.
Since 2009, the transition rate to year 11 and to year 12 has fluctuated; there is a decrease of 4% difference in 2013 from 85.9% in 2012 to 81.6% in 2013. However the transition rate to year 13 showed a big decrease over years from 28.8% in 2009 to 11.6% in 2013. The big gap in the transition rate between the years 11 and 13 is significant; it could be defined by the high drop out after the year 10 and year 12 exams or a high percentage of students who carry on at VIT or into any formal and non-formal tertiary institutions in Vanuatu.
• English 46% • French 42.6%
Science/Science
• English 40.1% • French 38.8%
Applied Science/Science Application
• English 38.7% • French 38.1%
Maths
• English 41.7% • French 48.7%
French/Français
• English 48.8% • French 38.9%
English/Français
3. Improve planning, fiscal and financial management
The Vanuatu Education Sector Strategy (VESS) 2007-2016 focuses on better educational outcomes through long-term strategies and the implementation of annual initiatives to achieve the short-term results.
The Vanuatu Education Sector Plan (VESP) jointly funded by Australia and New-Zealand government outlined the agenda for the development of education sector over the medium term. It is based on the Millennium Development Goals (MDGs), basically on the second MDG to achieve the universal primary education. It does incorporate the strategic vision outlined in VESS, which sets the framework.
The Government of Vanuatu is considering the Education sector as the priority area for development in its budget distribution in 2013. The share of the education budget that has been allocated was 26.2 % of which 71.9% was spent on the teacher’s salaries.
In 2013 the sharing of the 28.1% the MoET operational budget is defined as the actual expenditure to each subsector priority activities set aside in the 2013 annual work plan.
The biggest share to MoET budget is 72.2%, allocated to the MOE staff and teachers’ salaries, allowances and VNPF contributions, 11.4% of that budget allocated to the government scholarships followed by 8.2% was allocated for the school grants. The MoET, has received in 2013 further VT 470,192,769 from the development partners that includes AUSAID and NZAid and other development partners such as French government, Japanese government, UNICEF and
the United nation contributions.
In 2012 the combined Government grants for the education was about 6.6% of the value of all goods and services produced in Vanuatu as measured by the Gross Domestic Product (GDP). The MoET is currently strengthening the Monitoring and Evaluation Unit to better monitor the use of funding and resources against the 2013 Ministry’s annual work plan and the VESP strategy outputs. The disbursement of the budget initiatives in 2013 has gradually given more focus on the quality of Education and therefore 60% of the MoET budget is oriented towards a more proactive attempt in terms of a realistic and coherent implementation of the actual plans and policies of the MoET.
26.2%
73.8%
0 10 20 30 40 50 60 70 80 90
MoE Gov't
2013 Budget Expenditure as share % of the total Gov't expenditure
15 Govt.other ministries
MoET Operational budget,
2013
Salaries, wages, Allowances 72.2%
Government Scholarship 11.4%
Grants 8.2%
MoET ‘Administrative “Costs 5.5%
4. Province Key results
Number of schools by level, 2009 - 2013
Sa nma provi nce ha s the hi ghe s t numbe r of s chool s , the numbe r of ki nde rga rde n s chool s s e e ms to de cl i ne a cros s a l l provi nce
e xce pt a t Pe na ma provi nce . The numbe r of pri ma ry a s chool s i n Va nua tu re ma i ns s tea dy s i nce 2011 howe ve r. Note that scale on vertical axis differs for each province
36 32 23 25 2 3 0 5 10 15 20 25 30 35 40
2009 2010 2011 2012 2013 Torba 199 151 103 101 16 16 0 50 100 150 200 250
2009 2010 2011 2012 2013 Sanma 64 80 64 63 10 14 0 10 20 30 40 50 60 70 80 90
2009 2010 2011 2012 2013 Penama 108 98 89 86 16 17 0 20 40 60 80 100 120
2009 2010 2011 2012 2013 Malampa 101 99 81 82 24 23 0 20 40 60 80 100 120
2009 2010 2011 2012 2013 Shefa 98 97 94 77 11 14 0 20 40 60 80 100 120
2009 2010 2011 2012 2013 Tafea
Kindergarden Primary Secondary
Enrolment by level, 2009 - 2013
The school enrolment shows an increasing trend with the exception of torba, Sanma and penama of which the school seem to decrease gradually.
3,052 3,309 7,538 9,080 3,695 3,721 0 2,000 4,000 6,000 8,000 10,000 12,000
2009 2010 2011 2012 2013 Sanma 1,023 1,823 5,236 5,826 2,527 2,107 0 2,000 4,000 6,000 8,000 10,000 12,000
2009 2010 2011 2012 2013 Penama 1,595 1,838 6,789 7,283 2,592 2,312 0 2,000 4,000 6,000 8,000 10,000 12,000
2009 2010 2011 2012 2013 Malampa 2,742 3,410 10,109 11,847 6,613 7,267 0 2,000 4,000 6,000 8,000 10,000 12,000 14,000
2009 2010 2011 2012 2013 Shefa 1,998 2,325 7,526 8,138 1,963 2,274 0 2,000 4,000 6,000 8,000 10,000 12,000
2009 2010 2011 2012 2013 Tafea
ECCE Primary 1-6 Secondary 7+
561 1,564 1,690 474 0 2,000 4,000 6,000 8,000 10,000 12,000
2009 2010 2011 2012 2013 Torba
TABLE OF CONTENT
FOREWORD ... 2
ACKNOWLEDGEMENT ... 3
KEY RESULTS ... 4
1. Increasing Access to education ... 4
2. Improve Quality of Education ... 5
3. Improve planning, fiscal and financial management ... 7
4. Province Key results ... 8
INTRODUCTION ... 15
1.ACCESS TO EDUCATION ... 16
1.1 SCHOOL ENROLMENT ... 17
1.1ENROLMENT BY EDUCATION AUTHORITY ... 17
1.2ENROLMENT BY PROVINCE ... 21
1.3MONO-LINGUAL, BI-LINGUAL AND DUAL LINGUAL ... 22
1.4 GROSS ENROLMENT RATE (GER) ... 24
1.5 NET ENROLMENT RATE (NER) ... 27
1.6DROPOUT,REPEATER,ABSENCES,LEAVERS AND TRANSFER IN AND OUT FROM SCHOOLS ... 29
1.7INFORMATION ABOUT SCHOOL ... 29
1.8 HIGHER EDUCATION ... 31
1.8.12013SCHOLARSHIPS ... 31
1.8.2OTHER POST-SECONDARY INSTITUTIONS,2013 ... 35
1.9 TECHNICAL VOCATIONAL EDUCATION AND TRAINING (TVET), 2013 ... 35
1.9.1RURAL TRAINING CENTER (RTC) ... 35
1.9.2 VANUATU TECHNICAL AND VOCATIONAL EDUCATION & TRAINING (TVET), 2013-2014 ... 37
2. QUALITY OF EDUCATION ... 39
2.1EXAM’S ASSESSMENT RESULTS ... 39
2.2LITERACY AND NUMERACY ... 39
2.1.1PERCENTAGE OF STUDENTS PLACED AFTER HAVING SAT OR PASSED THE 2013EXAM ... 41
2.1.2EXAM RESULTS,2013 ... 42
2.1.3EXAM MARKING BENCHMARK,2013 ... 45
2.1.4SCHOOL LIFE EXPECTANCY ... 47
2.2CO EFFICIENCY OF EFFICIENCY THE EDUCATION SYSTEM ... 47
2.3PRIMARY CYCLE COMPLETION ... 48
2.3.1INTERNAL EFFICIENCY INDICATORS... 48
2.4.2TEACHER’S BY PROVINCE ... 49
2.5MONO-LINGUAL, BI-LINGUAL AND DUAL LINGUAL ... 50
2.6STUDENT: TEACHER RATIOS ... 50
2.7TEACHER CERTIFICATION AND QUALIFICATION ... 51
2.8IN-SERVICE TRAINING OF TEACHERS... 53
2.9SCHOOL FACILITIES ... 53
2.10CLASSROOMS ... 54
2.11WATER SUPPLY ... 54
2.12SANITATION ... 55
2.13ELECTRICITY AND SCHOOL EQUIPMENT ... 56
2.13.1ICT AND COMMUNICATION LEARNING RESOURCES ... 56
2.14SCHOOL RESOURCES ... 57
3.MANAGEMENT AND PLANNING ... 58
3.1SOURCE OF FUNDING FOR MINISTRY OF EDUCATION AND TRAINING ... 59
3.2GOVERNMENT BUDGETARY ALLOCATION ... 61
3.3DONOR PARTNER ALLOCATION ... 62
3.4UNIT COSTS OF EDUCATION ... 62
ANNEX 1: ... 63
2013ANNUAL SCHOOL SURVEY AND VEMIS DATA ... 63
1.1ANNUAL SCHOOL SURVEY PROCESS ... 63
1.2DATA QUALITY MEASURES AND DATA ENTRY ... 64
1.3DATA ENTRY ... 64
ANNUAL SCHOOL SURVEY RESPONSE RATES ... 65
ANNEX 2: ... 69
PROVINCIAL ENROLMENT BY NAME AND SCHOOL TYPE,2013 ... 69
2.1 Total Enrolment, Vanuatu ... 69
2.2 Torba Province ... 69
2.3 Sanma Province ... 71
2.4 Penama Province ... 77
2.5 Malampa Province ... 81
2.6 Shefa Province ... 86
2.7 Tafea Province ... 91
ABBREVIATIONS ... 97
TABLE
Table 2-1: Exam Marking Range (VSSC) ... 45
Table 2-2: Marking benchmark, External and Internal assessment, Year 12 (VSSC) ... 45
Table 2-3: South Pacific Form Seven Certificate, Year 13 (SPFSC) ... 45
Table 2-4: School life expectancy in the Education System, 2013 ... 47
Table 2-5: Completion Rate to Year 8, Primary Education (2009-2013) ... 48
Table 2-6: Dropout, Repeater and Promotion Rate in Primary and Secondary Schools, 2009 - 2013 ... 48
Table 2-7: Total number of teachers by School type, 2008 - 2013 ... 48
Table 2-8: Total number of teachers by Authority type, 2013 ... 49
Table 2-9: Total number of teachers by School type and by province, 2011-2013 ... 49
Table 2-10: Number of teachers by language, 2011 – 2013 ... 50
Table 2-11: Students, teachers and student teacher ratio (STR), by Authority type 2012 – 2013 ... 50
Table 2-12: Students, teachers and student: teacher ratio (STR), province, 2012 – 2013 ... 51
Table 2-13: Number of teachers, number and per cent certified, school level, 2012 – 2013 ... 51
Table 2-14: Number of teachers, authority, number and percent certified, 2013 ... 52
Table 2-15: Number of teachers, province, number and per cent certified, 2013 ... 52
Table 2-16: Per cent of teachers Certified and Qualified by school type, 2011 - 2013 ... 53
Table 2-17: Number of teachers attending in-service training, by gender and school level, 2009 – 2013 ... 53
Table 2-18: Classrooms, enrolment and student: classroom ratio, school level, 2012-2013 ... 54
Table 2-19: Number by types of water supplies in schools, school level, 2012 – 2013 ... 54
Table 2-20: Number by types of water supplies in schools, school level, 2012 – 2013 ... 55
Table 2-21: Number of toilets for females and males in schools, school level, 2012 – 2013 ... 55
Table 2-22 (a): Schools by Power Supply Type, 2012-2013 ... 56
Table 2-22(b): Percent of schools that have access to communication resources and ICT equipments, 2013 ... 56
Table 2-23: Number of student textbooks and teacher guides in primary, 2009-2013 ... 57
Table 2-24: ECE, Learning and Play learning resources, 2013 ... 58
3.MANAGEMENT AND PLANNING ... 58
Table 3-1: Expenditure, enrolment and expenditure per student in government all schools, 2013 ... 62
ANNEX 1: ... 63
Table 1: Survey Return Rates by School Type and Province, 2012 – 2013 ... 65
Table 2: Enrolment Response Rates by School Type and Province, 2012 – 2013... 67
FIGURES
FIGURE 1-1: TOTAL ENROLMENT BY EDUCATION AUTHORITY, 2013 ... 18
FIGURE 1-2: TOTAL ENROLMENT BY YEAR LEVEL, 2010 AND 2013 ... 20
FIGURE 1-3: TOTAL ENROLMENT BY GENDER AND BY YEAR LEVEL, 2013 ... 20
FIGURE 1-4: % OF PRIMARY SCHOOL ENROLMENT, 2012 – 2013 ... 23
FIGURE 1-5: TOTAL ENROLMENT VS OFFICIAL AGE ENROLMENT (4-19 YEARS OLD), 2013 ... 25
FIGURE 1-6: TOTAL ENROLMENT VS. SPECIFIC AGE ENROLMENT (4-19 YEARS OLD), 2013 ... 28
FIGURE 1-7: % OF SCHOOLS IN URBAN (U) AND RURAL (R) COMMUNITIES, 2009-2013 ... 31
FIGURE 1-8: NUMBER OF NEW AND ON-GOING AWARDS BY PROVINCE FUNDED BY GOVERNMENT OF VANUATU, 2013 ... 32
FIGURE 1-9: NEW AND ON-GOING AWARDS BY PROGRAMME OF STUDY FUNDED BY GOVERNMENT OF VANUATU, 2013 ... 33
FIGURE 1.10: NUMBER OF NEW AND ON-GOING AWARDS BY PROGRAMME OF STUDY, 2013. ... 33
FIGURE 1-11: NUMBER OF GRADUATES IN RTCS, 2009-2013 ... 37
FIGURE 2-1: PERCENT OF STUDENTS PLACED AFTER HAVING SAT THE 2013 EXAM ... 41
FIGURE 2-2: TOTAL AVERAGE MEAN BY SUBJECT AND PROVINCE, YEAR 8 ENGLISH SPEAKING - 2013 ... 42
FIGURE 2-3: TOTAL AVERAGE MEAN BY SUBJECT AND PROVINCE, YEAR 8 FRENCH SPEAKING - 2013 ... 42
FIGURE 2-4: TOTAL AVERAGE MEAN BY SUBJECT AND PROVINCE, YEAR 10 ENGLISH SPEAKING - 2013 ... 43
FIGURE 2-5: TOTAL AVERAGE MEAN BY SUBJECT AND PROVINCE, YEAR 10 FRENCH SPEAKING - 2013 ... 44
FIGURE 2-6: COMPLETION RATE TO YEAR 8, PRIMARY EDUCATION (2009-2013) ... 47
FIGURE 3-1 MOET RECURRENT GOVERNMENT BUDGET AND GRANTS, IN MILLION VATU, 2010 - 2013 ... 59
FIGURE 3-2: MOET BUDGET AS A PROPORTION OF VANUATU BUDGET (RECURRENT EXPENDITURE), 2000 –2013……….60
FIGURE 3-3: TOTAL EDUCATION EXPENDITURE (GOVERNMENT AND GRANTS) AS A PERCENT OF GDP, 2010 –2013…………...60
FIGURE 3-4: MOET RECURRENT EXPENDITURE: BUDGET AND ACTUAL (MILLION VATU), 2000 – 2013 ... 61
FIGURE 3-5: MOET EXPENDITURE AND TOTAL GOVERNMENT EXPENDITURE (RECURRENT, MILLION VATU), 2000 - 2013... 61
FIGURE 3.6: VERM EXPENDITURE GROUPED BY FUNDING AGENCIES, 2013 ... 62
ANNEX 1, FIGURE 1: ANNUAL SCHOOL SURVEY PROCESS... 63
ANNEX 1, FIGURE 2: ANNUAL SCHOOL SURVEY TIMELINE (END DATES FOR EACH MAJOR ACTIVITY) ... 64
ANNEX 1, FIGURE 3: SURVEY RETURN RATES FOR ECE SCHOOLS BY PROVINCE, 2012 ... 65
ANNEX 1, FIGURE 4: SURVEY RETURN RATES FOR PRIMARY SCHOOLS BY PROVINCE, 2013 ... 66
ANNEX 1, FIGURE 5: SURVEY RETURN RATES FOR SECONDARY SCHOOLS BY PROVINCE, 2013 ... 66
Introduction
The quality of the education system in Vanuatu is a continuing concern and a major challenge at the education decision level and for policy makers. The low literacy and numeracy remains a challenge in the education system therefore the MoET are focusing all its resources to strengthen and improve the quality of education in Vanuatu. This report covers a large number of statistics of education in ECCE and Education as well as primary, secondary and tertiary education.
It is always important to keep remind ourselves of the Vanuatu’s vision which is to provide a “healthy and wealthy education for all Ni-Vanuatu citizens”. The primary objective of the MOET is to improve the level of literacy and numeracy across all schools and institutions in Vanuatu. Important resources were made available to the MoET to support the implementation of the of the key priority strategies set under VERM and the Vanuatu government recurrent budget in 2013. This statistical annual report includes key performance indicators relevant to measure and monitor progress against the major development framework of the MoET and Training as well as progress against the Millennium Development (MD) and Education For All (EFA) goals by 2015.
MoET – Vanuatu Education Sector Plan (VESP) Priorities
This report provides some facts and figures on Vocational and Technical institutions in the country. MoET is also concern about the high dropout rate in secondary schools; therefore it decided to sustain its working relationship with all the stakeholders and other government line ministries to create pathways in order to accommodate the dropouts from the formal education stream into the non-formal education.The MoET has decided at the end of 2013 to include training in its new organizational structure.
The MoET has a second major concern in regards to the poor examination results in Vanuatu. This report publishes for the first time the exam’s results using tables and graphs. It is obvious that the proportion of push outs after the year 10, 12 and 13 exams is very high. Most of the data and indicators were disaggregated by province, gender and by subjects of study; they could be used as evidence based information to everyone including the education planners and practical information for all level of studies and researches.
Another important section in this report brings in the actual expenditures of the MOET recurrent budget and the development support budget from the development partners which is approximately around six (6) billion Vatu. This section shows basically the share of expenditure as the percentage of the overall government budget and as the percentage of the gross domestic product in 2013.
Finally, the previous VEMIS surveys and data are currently used as evidence source of information in supporting the implementation progress of the emerging plans and the policy priorities of the MoET. This report is only digesting all valuable facts and figures which are relevant to better plan and manages the education system in Vanuatu.
Strategy 1 Train and support teachers to implement
the new curriculum
Strategy 2 Strengthen Early
Childhood Care Education delivery
Strategy 4 Provide locally relevant
and efficient delivery of facilities and
equipment
Strategy 5 deliver effiectif well
managed and deconcentrated education system in
Vanuatu Strategy 3
Engage the community to
1.
Access to Education
Relevant Indicators for MoET Monitoring and Evaluation
Indicator 2008 2009 2010 2011 2012 2013
NER
ECE
Primary (Year 1 – 6) Secondary (Year 7-13)
37.9% 87.1% 29.2% 38.4% 85.5% 32.4% 40.5% 88.1% 31.8% 40.5% 87.9% 30.0% 44.2% 86.7% 33.1% 42.5% 86.3% 33.0% GER ECE
Primary (Year 1 – 6) Secondary (Year 7-13)
GIR and NIR in primary year 1
NIR GIR 61.4% 111.6% 42.5% 39.7% 119.4% 57.6% 110.8% 44.4% 35.7% 106.1% 58.2% 117.4% 42.1% 39.7% 123.2% 58.3% 118.6% 40.9% 36.6% 113.3% 65.8% 121.0% 46.8% 36.0% 118.2% 63.1% 119.4% 48.1% 34.9% 112.3%
Average Dropout rate
Primary (Year 1 – 6) Secondary (Year 7-13)
6.8% 27.0% 2.1% 37.9% 6.0% 39.9% 8.0% 44.2% 3.7% 33.5% 6.6% 33.2%
Average Repetition rate
Primary (Year 1 – 6) Secondary (Year 7-13)
13.5% 1.8% 14.4% 1.9% 15.1% 2.8% 12.1% 3.0% 14.6% 3.0% 15.1% 3.6%
Average Promotion rate
Primary (Year 1 – 6) Secondary (Year 7-13)
82.8% 79.7% 80.5% 76.8% 78.2% 73.3% 75.6% 69.3% 81.7% 63.5% 78.3% 63.2%
Survival rate to Year 6* 71.2% 96.7% 74.6% 69.5% 83.6% 70.8%
Transition rate from Year 6 – 7 94.8% 89.8% 87.4% 84% 86.4% 85.2%
Survival rate to Year 13 19.6% 16.0% 9.8% 7.3% 11.7% 9.5%
Source: VEMIS 2013
Increase on GER and NER in Primary Education overtime, 2008-2013
The NER in Primary education has declined by 1% in 2013 as compared to 2012 due to the high number of under-age and over-age enrolment in 2013. The number of children in the Kindergarten schools has increased from 11,272 in 2010 to 13,388 in 2013. Lots of efforts and resources in terms of ECCE teacher training on the new curriculum, researches or studies on identifying issues of poor education on 0-5 years of children’s learning, improving literacy and numeracy at early years of education have been concentrated on ECCE activities in order to support
access of
small children’s’ participation in the kindergarten schools and to address the level of quality teaching and learning.38% 38% 41% 41% 44%
43%
87% 86% 88% 88% 87% 86%
29% 32% 32% 30% 33% 33%
0% 20% 40% 60% 80% 100%
2008 2009 2010 2011 2012 2013
Net Enrolment Trends, Primary Education (1 to 6)
1.1 School Enrolment
1.1 Enrolment by education authority
Table 1-1: Enrolment by education authority and school level, 2010 – 2013
Education Authority
ECE Primary Year 1 -6 Secondary 7 +
2010 2011 2012 2013 2010 2011 2012 2013 2010 2011 2012 2013
Government of Vanuatu
225 30,101 30,062 31,097 31,173 12,310 12,256 12,096 12,266
Church
(Government Assisted)
327 399 462 413 9,699 10,266 11,244 11,579 4,574 4,763 5,021 5,362
Not Stated 149
Subtotal Government
552 548 462 413 39,800 40,328 42,341 42,752 16,884 17,019 17,117 17,628
Church
(Not Government Assisted)
67 14 19 230 187 184 191 139 135 178 190
Private 7,417 9,151 9,208 8,565 1,313 1,278 912 905 1,099 711 734 813
Community 3,236 1,888 3,699 4,346 440 559 464 334 176 199 210 212
Total 11,272 11,601 13,388 13,324 41,783 42,352 43,901 44,182 18,298 18,064 18,239 18,843
Source: VEMIS (Vanuatu Education Management Information System), 2013
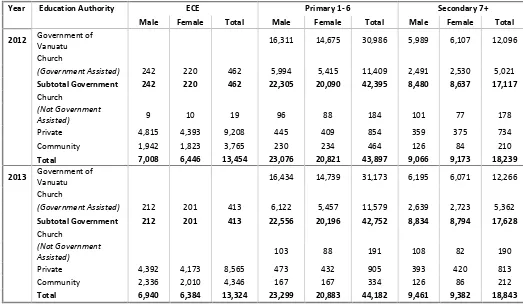
Table 1-2: Enrolment by education authority, sex and school level, 2012 – 2013
Year Education Authority ECE Primary 1- 6 Secondary 7+ Male Female Total Male Female Total Male Female Total 2012 Government of
Vanuatu 16,311 14,675 30,986 5,989 6,107 12,096
Church
(Government Assisted) 242 220 462 5,994 5,415 11,409 2,491 2,530 5,021
Subtotal Government 242 220 462 22,305 20,090 42,395 8,480 8,637 17,117
Church
(Not Government
Assisted) 9 10 19 96 88 184 101 77 178
Private 4,815 4,393 9,208 445 409 854 359 375 734
Community 1,942 1,823 3,765 230 234 464 126 84 210
Total 7,008 6,446 13,454 23,076 20,821 43,897 9,066 9,173 18,239 2013 Government of
Vanuatu 16,434 14,739 31,173 6,195 6,071 12,266
Church
(Government Assisted) 212 201 413 6,122 5,457 11,579 2,639 2,723 5,362
Subtotal Government 212 201 413 22,556 20,196 42,752 8,834 8,794 17,628
Church
(Not Government
Assisted) 103 88 191 108 82 190
Private 4,392 4,173 8,565 473 432 905 393 420 813
Community 2,336 2,010 4,346 167 167 334 126 86 212
Total 6,940 6,384 13,324 23,299 20,883 44,182 9,461 9,382 18,843
Figure 1-1: Total enrolment by education authority, 2013
Source: VEMIS 2013
Table 1-3: Enrolment in primary 1 to 6 by education authority and province, 2012 – 2013
Province
Year Education Authority Torba Sanma Penama Malampa Shefa Tafea Vanuatu 2012 Government 1,690 5,922 4,366 5,956 8,292 5,871 31,097
Church (Govt. assisted) 14 3,050 1,460 2,302 2,294 2,124 11,244
Subtotal Government 1,704 8,972 5,826 8,258 10,586 7,995 42,341
Church 86 98 184
Private 23 22 25 746 96 912
Community 417 47 464
Total 1,727 9,080 5,826 8,283 11,847 8,138 43,901 2013 Government 1,608 5,786 4,455 5,040 8,478 5,806 31,173
Church (Govt. assisted) 14 3,150 1,518 2,267 2,357 2,273 11,579
Subtotal Government 1,622 8,936 5,973 7,307 10,835 8,079 42,752
Church 82 109 191
Private 68 57 728 52 905
Community 42 244 48 334
Total 1,690 9,117 5,973 7,307 11,916 8,179 44,182
Source: VEMIS, 2013
413
4,346
8,565
0 4,500 9,000 Church (Govt
assisted) Vanuatu Government
Private Church (Not Govt
Assisted) ECE 334 905 191 11,579 31,173
0 20,000 40,000 Community
Private Church (Not Govt
Assisted) Church (Govt assisted)
Vanuatu Government Primary 1 - 6
190 813
1,003 5,362
12,266
0 5,000 10,00015,000 Church (Not Govt
Assisted) Private Community Church (Govt assisted) Vanuatu Government
Table 1-4: Total enrolment in secondary (Year 7+) by education authority and province, 2012 – 2013
Province
Year Education Authority Torba Sanma Penama Malampa Shefa Tafea Vanuatu 2012
Government 455 2,423 831 1,725 4,951 1,711 12,096
Church (Govt. assisted) 103 1,119 1,276 587 1,373 563 5,021
Subtotal Government 558 3,542 2,107 2,312 6,324 2,274 17,117
Church 162 16 178
Private 17 717 734
Community 210 210
Total 558 3,721 2,107 2,312 7,267 2,274 18,239
2013 Government 386 2,383 660 1,827 5,288 1,722 12,266
Church (Govt. assisted) 88 1,149 1,480 596 1,492 557 5,362
Subtotal Government 474 3,532 2,140 2,423 6,780 2,279 17,628
Church 158 32 190
Private 41 754 18 813
Community 17 195 212
Total 474 3,748 2,140 2,423 7,761 2,297 18,843
Source: VEMIS, 2013
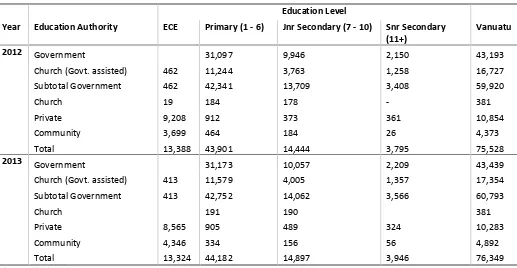
Table 1-5: Enrolment by education authority and level, 2012 – 2013
Education Level
Year Education Authority ECE Primary (1 - 6) Jnr Secondary (7 - 10) Snr Secondary (11+)
Vanuatu
2012 Government 31,097 9,946 2,150 43,193
Church (Govt. assisted) 462 11,244 3,763 1,258 16,727
Subtotal Government 462 42,341 13,709 3,408 59,920
Church 19 184 178 - 381
Private 9,208 912 373 361 10,854
Community 3,699 464 184 26 4,373
Total 13,388 43,901 14,444 3,795 75,528
2013 Government 31,173 10,057 2,209 43,439
Church (Govt. assisted) 413 11,579 4,005 1,357 17,354
Subtotal Government 413 42,752 14,062 3,566 60,793
Church 191 190 381
Private 8,565 905 489 324 10,283
Community 4,346 334 156 56 4,892
Total 13,324 44,182 14,897 3,946 76,349
Figure 1-2: Total Enrolment by year level, 2010 and 2013
0 2000 4000 6000 8000 10000 12000 14000
ECE Year 1 Year 2 Year 3 Year 4 Year 5 Year 6 Year 7 Year 8 Year 9 Year 10 Year 11 Year 12 Year 13 Year 14 13,324
9,278
3,916
2,976
1,405
718 93
2010 enrolment 2013 enrolment
Source: VEMIS, 2013
The above graph (Fig 1-2) is showing the actual enrolment figures in ECCE to year 13/14 level, which is derived from the 2013 VEMIS survey. The actual enrolment figure is decreasing gradually in each year level; where seeing more than 9,000 students were enrolled in year 1 and approximately 4,000 students enrolled in year 6 in the academic school year. Therefore it is very important to take note of the enrolment difference between these two year levels.
Figure 1-3: Total enrolment by gender and by year level, 2013
Source: VEMIS, 2013
Student’s distribution by gender is well represented throughout all levels except in ECCE to year 3; VEMIS data is showing that there are more boys than girls in enrolling in the early years of education.
0 5000 10000 15000 20000 25000 30000
ECE Year 1 Year 2 Year 3 Year 4 Year 5 Year 6 Year 7 Year 8 Year 9 Year 10
Year 11
Year 12
Year 13
1.2 Enrolment by province
Table 1-6: Enrolment by province, school type and sex, 2012 – 2013
ECE Primary (1 - 6) Secondary (7+)
Year Province Male Female Male Female Male Female
2012 Torba 283 314 896 831 282 276
Sanma 1,620 1,529 4,841 4,239 1,868 1,853
Penama 838 778 3,097 2,729 1,020 1,087
Malampa 1,045 931 3,876 3,407 1,160 1,152
Shefa 1,826 1,633 6,068 5,779 3,559 3,708
Tafea 1,366 1,225 4,298 3,840 1,177 1,097
Vanuatu 6,978 6,410 23,076 20,825 9,066 9,173
2013 Torba 299 320 886 804 253 221
Sanma 1,669 1,640 4,873 4,244 1,913 1,835
Penama 950 873 3,178 2,795 1,065 1,075
Malampa 1,005 833 3,893 3,414 1,216 1,207
Shefa 1,796 1,614 6,178 5,738 3,834 3,927
Tafea 1,221 1,104 4,291 3,888 1,180 1,117
Vanuatu 6,940 6,384 23,299 20,883 9,461 9,382
Source: VEMIS, 2013
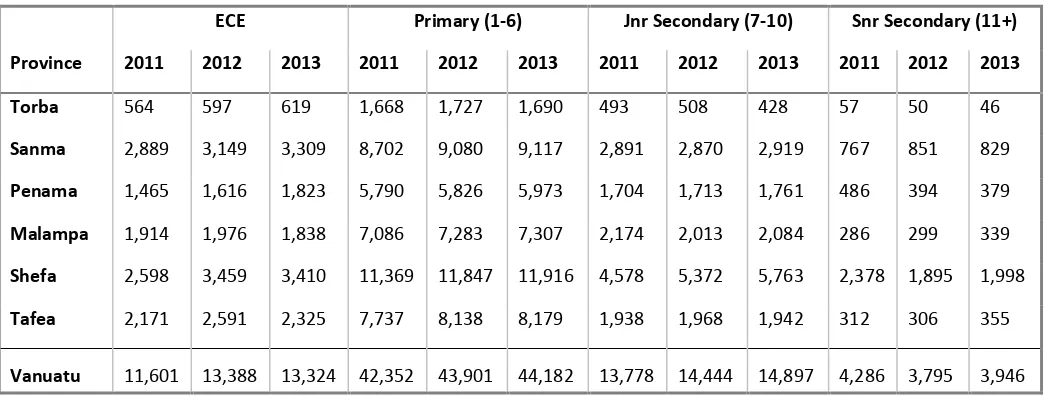
Table 1-7: Enrolment by province and school level, 2011 – 2013
ECE Primary (1-6) Jnr Secondary (7-10) Snr Secondary (11+)
Province 2011 2012 2013 2011 2012 2013 2011 2012 2013 2011 2012 2013
Torba 564 597 619 1,668 1,727 1,690 493 508 428 57 50 46
Sanma 2,889 3,149 3,309 8,702 9,080 9,117 2,891 2,870 2,919 767 851 829
Penama 1,465 1,616 1,823 5,790 5,826 5,973 1,704 1,713 1,761 486 394 379
Malampa 1,914 1,976 1,838 7,086 7,283 7,307 2,174 2,013 2,084 286 299 339
Shefa 2,598 3,459 3,410 11,369 11,847 11,916 4,578 5,372 5,763 2,378 1,895 1,998
Tafea 2,171 2,591 2,325 7,737 8,138 8,179 1,938 1,968 1,942 312 306 355
1.3 Mono-lingual, bi-lingual and dual lingual
The Education language policy encourages all children in the early years of schooling to start their education in their mother tongue, while most of the primary schools used either English or French language as a medium of instruction. All learning and teaching resources were also made available in either English or French language. The review of the new curriculum was done using both languages and also done in bislama for the kindergarten schools.
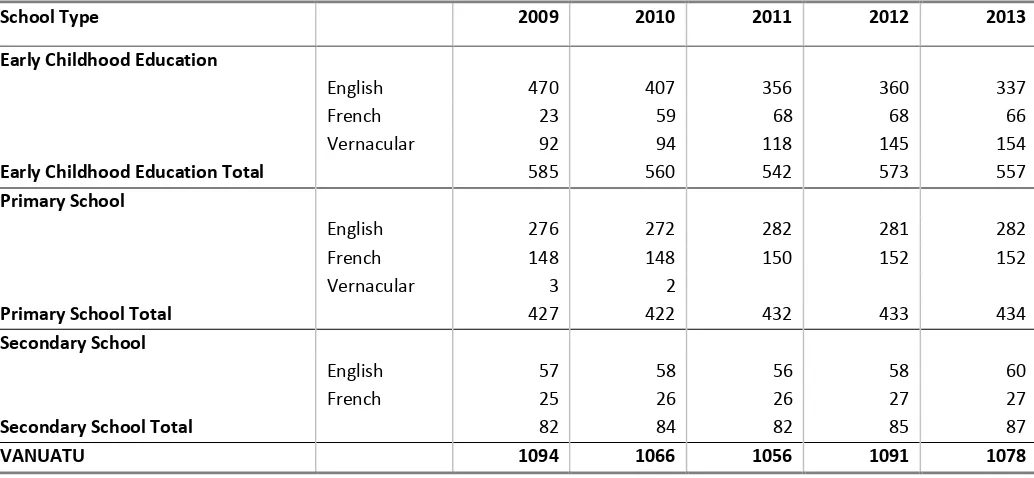
Table 1-8: Number of schools by language that the school is registered in, 2010 – 2013
ECE Primary Secondary
Language 2011 2012 2013 2011 2012 2013 2011 2012 2013
Bilingual 1 1 1
Bislama 24 25 26
English 359 359 337 281 281 282 54 58 59
French 68 68 66 150 152 152 27 27 27
Vernacular 92 119 128
Vanuatu 543 571 557 432 433 434 82 85 87
Source: : VEMIS, 2013*Primary schools include some schools which offer Year 7 and Year 8 but are classified as primary school. #Secondary schools include some technical training centres which offer courses from Year 11 level such as Lowanaton in Tanna.
Table 1-9: Number of student enrolled by language that the school is registered in, 2011 – 2013
ECE Primary Secondary
Language 2011 2012 2013 2011 2012 2013 2011 2012 2013
English 7,751 8,727 8,377 27,202 28,079 30,944 12,766 12,898 10,732
French 1,770 2,018 1,940 15,150 15,822 16,600 5,298 5,341 4,612
Vernacular 2,080 2,643 2,604
Vanuatu 11,601 13,388 12,921 42,352 43,901 47,544 18,064 18,239 15,344
Source: VEMIS, 2013
Table 1-10: Number of ECE centres by language that the school is registered in, 2012 – 2013
Year Language Torba Sanma Penama Malampa Shefa Tafea Vanuatu
2012 English 2 14 1 2 1 5 25
French 19 92 52 64 63 69 359
Bislama 1 21 5 25 8 8 68
Vernacular 12 24 19 8 29 27 119
Total 2012 34 151 77 99 101 109 571
2013 English 2 15 1 2 1 5 26
French 15 95 39 63 62 63 337
Bislama 1 19 5 25 8 8 66
Vernacular 14 22 35 8 28 21 128
Total 2013 32 151 80 98 99 97 557
Table 1-11: ECE enrolment, language school is registered in and province, 2012 – 2013
Year Language Torba Sanma Penama Malampa Shefa Tafea Vanuatu
2012 English 326 1,951 1,081 1,243 2,420 1,706 8,727
French 30 579 161 549 498 201 2,018
Bislama 44 224 15 41 45 74 443
Vernacular 197 395 359 143 496 610 2,200
Total 2012 597 3,149 1,616 1,976 3,459 2,591 13,388
2013 English 278 2,111 917 1,183 2,332 1,556 8,377
French 23 607 156 473 464 217 1,940
Bislama 34 228 20 26 51 44 403
Vernacular 284 363 730 156 563 508 2,604
Total 2013 619 3,309 1,823 1,838 3,410 2,325 13,324
Source: VEMIS, 2013 * Vernacular defines all the mother tongue languages that are used in the existing kindergarten schools.
Table 1-12: Number of primary schools, language school is registered in and by province, 2012 – 2013
Year Language Torba Sanma Penama Malampa Shefa Tafea Vanuatu
2012 English 17 68 41 52 59 44 281
French 8 33 22 34 21 34 152
Total 2012 25 101 63 86 80 78 433
2013 English 17 68 41 52 61 43 282
French 8 33 22 34 21 34 152
Total 2013 25 101 63 86 82 77 434
Source: VEMIS, 2013 *Primary schools include some schools which offer Year 7 and Year 8 but are classified as primary school. #Secondary schools include some technical training centres which offer courses from Year 11 level such as Lowanaton in Tanna.
Figure 1-4: % of primary school enrolment, 2012 – 2013
Source: VEMIS, 2013
English
64%
French
36%
Total enrolment, Primary Schools 2012
English
65%
French
35%
Table 1-13: Number of Secondary school, language school is registered in and by province, 2012 – 2013
Year Language Torba Sanma Penama Malampa Shefa Tafea Vanuatu
2012 Bilingual 0 0 0 0 0 0 0
English 2 12 10 8 17 9 58
French 1 4 3 8 6 5 27
Total 2012 3 16 13 16 23 14 85
2013 Bilingual 0 1 0 0 0 0 1
English 2 11 11 9 17 9 59
French 1 4 3 8 6 5 27
Total 2013 3 16 14 17 23 14 87
Source: VEMIS, 2013
1.4
Gross Enrolment Rate (GER)
Table 1-14: Gross Enrolment Ratio (GER), school type, 2009 – 2013
ECE Primary, 1-6 Secondary, 7+
Year Male Female Total GPI Male Female Total GPI Male Female Total GPI
2009 58.7% 56.5% 57.6% 0.96 110.7% 110.8% 110.8% 1.00 43.1% 45.8% 44.4% 1.06
2010 58.0% 58.4% 58.2% 1.01 118.2% 116.5% 117.4% 0.99 40.7% 43.7% 42.1% 1.07
2011 58.7% 57.8% 58.3% 0.98 120.4% 116.7% 118.6% 0.97 39.1% 42.8% 40.9% 1.10
2012 2013
63.3% 63.4%
65.3% 62.7%
65.8% 63.1%
1.03 0.97
122.5% 121.2%
119.5% 117.3%
121.1% 119.4%
0.98 0.97
38.2% 45.9%
41.9% 50.6%
40.0% 48.1%
1.10 1.10 Source: VEMIS, 2013
Table 1-15: Total Enrolment, level and sex, 2010 – 2013
Level 2010 2011 2012 2013
Male Female Total Male Female Total Male Female Total Male Female Total
ECE 5,779 5,493 11,272 6,020 5,581 11,601 6,978 6,410 13,388 6,940 6,384 13,324
Year 1 4,764 4,424 9,188 4,740 4,217 8,957 4,771 4,483 9,254 4,931 4,347 9,278
Year 2 3,947 3,515 7,462 4,133 3,778 7,911 4,226 3,817 8,043 4,099 3,765 7,864
Year 3 3,833 3,395 7,228 3,926 3,281 7,207 4,023 3,573 7,596 4,124 3,698 7,822
Year 4 3,455 3,068 6,523 3,457 3,281 6,738 3,686 3,052 6,738 3,688 3,288 6,976
Year 5 3,199 2,788 5,987 3,182 2,855 6,037 3,226 3,023 6,249 3,370 2,883 6,253
Year 6 2,805 2,590 5,395 2,941 2,561 5,502 3,144 2,877 6,021 3,087 2,902 5,989
Year 7 2,205 2,009 4,214 2,131 2,093 4,224 2,341 2,143 4,484 2,423 2,263 4,686
Official age definitions:
Year 8 1,759 1,825 3,584 1,858 1,787 3,645 1,912 1,914 3,826 2,053 1,863 3,916
Year 9 1,701 1,661 3,362 1,537 1,640 3,177 1,665 1,721 3,386 1,608 1,711 3,319
Year 10 1,297 1,380 2,677 1,363 1,369 2,732 1,316 1,432 2,748 1,505 1,471 2,976
Year 11 1,014 963 1,977 927 938 1,865 771 875 1646 833 897 1,730
Year 12 804 786 1,590 844 745 1,589 609 664 1273 661 744 1,405
Year 13 309 388 697 298 379 677 402 388 790 331 387 718
Year 14 95 102 197 73 82 155 50 36 86 47 46 93
Total 36,966 34,387 71,353 37,430 34,587 72,017 39,120 36,408 75,528 39,700 36,649 76,349
Source: VEMIS, 2013
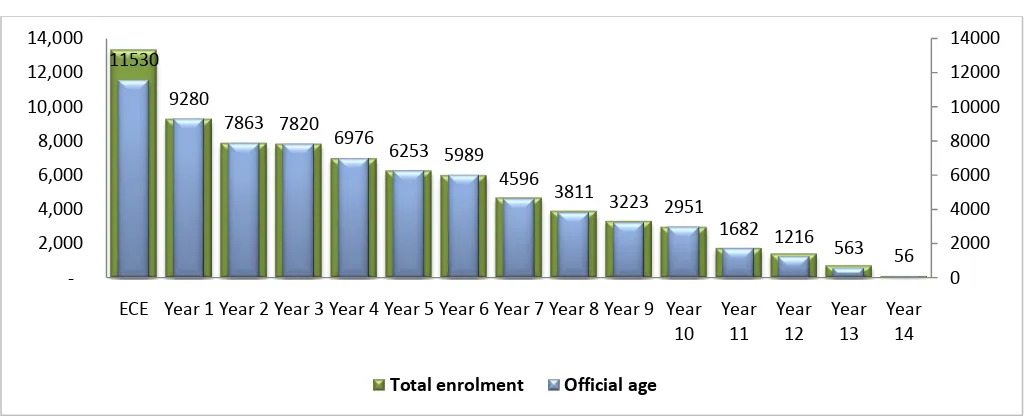
Figure 1-5: Total enrolment vs Official age enrolment (4-19 years old), 2013
Source: VEMIS, 2013
Table 1-16: Population for each year level, age for year and by gender, 2010 – 2013
Level Age 2010 2011 2012 2013
Male Female Total Male Female Total Male Female Total Male Female Total ECE 4-5 9,972 9,399 19,371 10,256 9,657 19,913 10,524 9,809 20,333 10,949 10,175 21,124
Year 1 6 3,215 2,986 6,201 3,219 2,987 6,206 3,309 3,053 6,362 3,402 3,144 6,546
Year 2 7 3,096 2,843 5,939 3,213 2,982 6,195 3,225 2,982 6,207 3,307 3,052 6,359
Year 3 8 2,946 2,675 5,621 3,094 2,840 5,934 3,153 2,924 6,077 3,223 2,981 6,204
Year 4 9 2,864 2,576 5,440 2,945 2,673 5,618 3,094 2,874 5,968 3,152 2,923 6,075
Year 5 10 3,316 3,132 6,448 2,863 2,575 5,438 3,047 2,824 5,871 3,093 2,873 5,966
Year 6 11 3,180 2,772 5,952 3,315 3,131 6,446 3,010 2,770 5,780 3,045 2,823 5,868
Year 7 12 3,047 2,513 5,560 3,178 2,771 5,949 2,984 2,712 5,696 3,009 2,769 5,778
Year 8 13 2,904 2,582 5,486 3,045 2,512 5,557 2,963 2,655 5,618 2,982 2,712 5,694
Year 9 14 2,630 2,575 5,205 2,902 2,581 5,483 2,945 2,609 5,554 2,962 2,655 5,617 11530
9280
7863 7820 6976
6253 5989 4596
3811
3223 2951
1682 1216 563
56 0 2000 4000 6000 8000 10000 12000 14000
-2,000 4,000 6,000 8,000 10,000 12,000 14,000
ECE Year 1 Year 2 Year 3 Year 4 Year 5 Year 6 Year 7 Year 8 Year 9 Year 10
Year 11
Year 12
Year 13
Year 14
Year 10 15 2,988 2,708 5,696 2,629 2,574 5,203 2,925 2,584 5,509 2,944 2,608 5,552
Year 11 16 2,681 2,567 5,248 2,986 2,707 5,693 2,900 2,588 5,488 2,924 2,583 5,507
Year 12 17 2,806 2,661 5,467 2,839 2,640 5,479 2,871 2,609 5,480 2,899 2,587 5,486
Year 13 18 2,769 2,653 5,422 2,804 2,659 5,463 2,837 2,639 5,476 2,869 2,608 5,477
Year 14 19 2,731 2,609 5,340 2,767 2,652 5,419 2,802 2,658 5,460 2,835 2,638 5,473
Total 51,145 47,251 98,396 52,055 47,941 99,996 52,589 48,290 100,879 53,595 49,131 102,726
Source: VEMIS, 2013
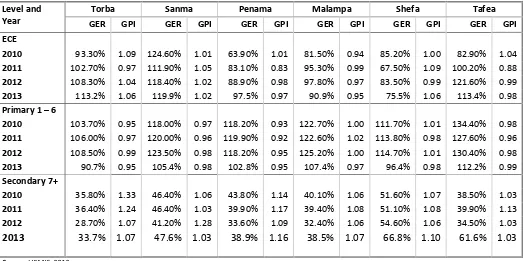
Table 1-17: Gross Enrolment Rate (GER) and the GPI of the GER, level and province 2010 –2013
Level and Year
Torba Sanma Penama Malampa Shefa Tafea
GER GPI GER GPI GER GPI GER GPI GER GPI GER GPI
ECE
2010 93.30% 1.09 124.60% 1.01 63.90% 1.01 81.50% 0.94 85.20% 1.00 82.90% 1.04
2011 102.70% 0.97 111.90% 1.05 83.10% 0.83 95.30% 0.99 67.50% 1.09 100.20% 0.88
2012 108.30% 1.04 118.40% 1.02 88.90% 0.98 97.80% 0.97 83.50% 0.99 121.60% 0.99
2013 113.2% 1.06 119.9% 1.02 97.5% 0.97 90.9% 0.95 75.5% 1.06 113.4% 0.98
Primary 1 – 6
2010 103.70% 0.95 118.00% 0.97 118.20% 0.93 122.70% 1.00 111.70% 1.01 134.40% 0.98
2011 106.00% 0.97 120.00% 0.96 119.90% 0.92 122.60% 1.02 113.80% 0.98 127.60% 0.96
2012 108.50% 0.99 123.50% 0.98 118.20% 0.95 125.20% 1.00 114.70% 1.01 130.40% 0.98
2013 90.7% 0.95 105.4% 0.98 102.8% 0.95 107.4% 0.97 96.4% 0.98 112.2% 0.99
Secondary 7+
2010 35.80% 1.33 46.40% 1.06 43.80% 1.14 40.10% 1.06 51.60% 1.07 38.50% 1.03
2011 36.40% 1.24 46.40% 1.03 39.90% 1.17 39.40% 1.08 51.10% 1.08 39.90% 1.13
2012 28.70% 1.07 41.20% 1.28 33.60% 1.09 32.40% 1.06 54.60% 1.06 34.50% 1.03
2013
33.7% 1.07
47.6% 1.03
38.9% 1.16
38.5% 1.07
66.8% 1.10
61.6% 1.03
Source: VEMIS, 2013
1.5 Net Enrolment Rate (NER)
Net Enrolment Rate (NER): Total enrolment of pupils of the official age group for ECE, Primary or Secondary education expressed as a percentage of the total population of children who are of the official age group for that level of education.
Table 1-18: Net Enrolment Ratio (NER), school type, 2009 – 2013
Source: VEMIS, 2013
Table 1-19: Official age enrolment, level and sex, 2011 – 2013
Official 2011 2012 2013
Level Age Male Female Total Male Female Total Male Female Total
ECE 3– 5 4,139 3,946 8,085 4,632 4,358 8,990 4,625 4,352 8,977
Year 1 6 1,261 1,230 2,491 1222 1256 2,478 1197 1263 2,460
Year 2 7 744 816 1,560 768 799 1,567 743 803 1,546
Year 3 8 581 636 1,217 611 602 1,213 637 718 1,355
Year 4 9 477 565 1,042 517 527 1,044 548 625 1,173
Year 5 10 445 461 906 412 504 916 390 458 848
Year 6 11 396 440 836 407 427 834 355 486 841
Year 7 12 459 483 942 370 427 797 355 381 736
Year 8 13 380 427 807 379 440 819 291 368 659
Year 9 14 288 376 664 379 440 819 281 376 657
Year 10 15 289 393 682 266 390 656 311 362 673
Year 11 16 213 283 496 208 255 463 147 237 384
Year 12 17 206 254 460 182 224 406 139 179 318
Year 13 18 111 129 240 94 104 198 95 127 222
Year 14 19 16 18 34 17 16 33 16 18 34
Total 10,005 10,457 20,462 10,464 10,769 21,233 10,130 10,753 20,883
Source: VEMIS, 2013
The above table 1.19 is only showing the enrolment by year level and by age specific. The identified enrolment does not include the under and over age students within the same year level.
ECE Primary, 1-6 Secondary, 7-13/14
Year Male Female Total GPI Male Female Total GPI Male Female Total GPI
2009 38.3% 38.5% 38.4% 1.01 84.6% 86.6% 85.5% 1.02 31.3% 33.6% 32.4% 1.07
2010 39.5% 41.6% 40.5% 1.05 87.5% 88.7% 88.1% 1.01 30.0% 33.7% 31.8% 1.12
2011 40.3% 40.8% 40.5% 1.01 87.0% 88.7% 87.9% 1.02 28.0% 32.2% 30.0% 1.15
2012 44.0% 44.4% 44.2% 1.00 86.3% 87.2% 86.7% 1.01 26.8% 31.6% 29.1% 1.09
Figure 1-6: Total enrolment vs. specific age enrolment (4-19 years old), 2013
Source: VEMIS, 2013
At ECCE level, 8,977 (enrolment) covers age 3 to 5 years old, at year 1 the official entry age is 6 years old, 7 years old in year 2, 8 years old in year 3, 9 years old in year 4, 10 years old in year 5, 11 years old in year 6, 12 years old in year 7, 13 years old in year 8, 14 years old in year 9, 15 years old in year 10, 16 years old in year 11, 17 years old in year 12, 18 years old in year 13 and 19 years old in year 14 francophone.
Tables 1-16 and 1-19 enable you to calculate the percentage of students by age specific for each year level. These tables also indicate the high number of under- and over-age students who enrolled in all year levels of education.
Table 1-20: Net Enrolment Rate (NER) and the GPI of the NER, level and province, 2010 – 2013
Level and Year
Torba Sanma Penama Malampa Shefa Tafea NER GPI NER GPI NER GPI NER GPI NER GPI NER GPI
ECE
2010 48.3% 1.06 67.6% 1.10 36.9% 1.02 48.0% 1.09 55.4% 1.11 42.3% 1.10
2011 52.8% 1.06 56.9% 1.10 49.0% 0.96 55.1% 0.92 44.5% 1.10 52.2% 1.04
2012 50.8% 1.07 48.2% 1.00 40.2% 1.00 45.0% 0.95 39.8% 0.45 49.9% 0.98
2013 54.5% 0.93 62.6% 0.99 54.0% 1.00 55.1% 0.92 48.8% 1.05 61.4% 0.97
Primary 1 – 6
2010 72.8% 0.99 86.3% 1.00 86.5% 0.96 90.5% 1.03 90.6% 1.02 97.3% 1.01
2011 73.7% 1.06 87.4% 1.00 87.5% 0.98 89.0% 1.06 90.5% 1.02 90.0% 1.00
2012 76.0% 1.01 88.9% 1.00 83.3% 0.97 89.6% 1.02 88.2% 1.02 89.5% 0.99
2013 86.3% 1.00 96.2% 1.00 96.0% 1.04 99.3% 1.00 95.7% 1.00 98.1% 1.02
Secondary 7+
2010 35.6% 1.32 45.4% 1.10 42.8% 1.17 39.8% 1.07 47.0% 1.10 37.9% 1.04
2011 36.1% 1.24 45.1% 1.00 39.4% 1.18 38.4% 1.09 47.0% 1.10 39.1% 1.14
2012 28.6% 1.07 39.9% 1.04 33.3% 1.09 31.5% 1.07 48.0% 1.07 33.4% 1.04
2013 44.9% 1.00 63.9% 1.03 55.6% 0.92 53.3% 1.07 70.0% 1.03 63.0% 0.94 Source: VEMIS (Vanuatu Education Management Information System) and Provincial estimate data was provided by VNSO, 2013
8,977
2,460
1,546 1,355 1,173 848 841 736 659 657 673
384 318 222 34
0 2000 4000 6000 8000 10000 12000 14000
ECE Year 1 Year 2 Year 3 Year 4 Year 5 Year 6 Year 7 Year 8 Year 9 Year 10 Year 11 Year 12 Year 13 Year 14