Chemistry
and Physics
and Physics
Chemistry
Discussions
Atmospheric
Measurement
Techniques
Open AccessAtmospheric
Measurement
Techniques
Open Access DiscussionsBiogeosciences
Open Access Open Access
Biogeosciences
Discussions
Climate
of the Past
Open Access Open Access
Climate
of the Past
Discussions
Earth System
Dynamics
Open Access Open Access
Earth System
Dynamics
DiscussionsGeoscientific
Instrumentation
Methods and
Data Systems
Open Access
Geoscientific
Instrumentation
Methods and
Data Systems
Open Access DiscussionsGeoscientific
Model Development
Open Access Open Access
Geoscientific
Model Development
DiscussionsHydrology and
Earth System
Sciences
Open AccessHydrology and
Earth System
Sciences
Open Access DiscussionsOcean Science
Open Access Open Access
Ocean Science
Discussions
Solid Earth
Open Access Open Access
Solid Earth
DiscussionsThe Cryosphere
Open Access Open Access
The Cryosphere
Discussions
E. Alekseenko , B. Roux , A. Sukhinov , R. Kotarba , and D. Fougere 1IFREMER, Brest, France
2M2P2 UMR 7340 CNRS – Aix-Marseille University and Ecole Centrale Marseille, Marseille, France 3Southern Federal University, Taganrog, Russia
Correspondence to: E. Alekseenko ([email protected])
Received: 7 August 2012 – Revised: 15 January 2013 – Accepted: 25 January 2013 – Published: 4 March 2013
Abstract. The paper addresses the application of the
non-linear hydrodynamics model (RANS (Reynolds-averaged Navier–Stokes) equations) in a wide semi-enclosed Mediter-ranean lagoon (Berre lagoon), considering three natural forc-ing functions, i.e., sea tide propagatforc-ing through a long narrow channel, wind and runoff. Main attention is focused to char-acteristic velocities (at free surface and bottom) and to free surface elevation associated to each of these three mecha-nisms, with special attention to the nearshore areas (i.e., in shallow water). The most interesting result concerns wind effects which, due to Berre lagoon bathymetry, give rise to downwind coastal jets, alongshore, in shallow water areas. Such coastal jets were never mentioned before in Berre la-goon literature.
1 Introduction
This paper concerns the hydrodynamics in a lagoonal ecosys-tem (called Berre lagoon) which was occupied, at the turn of the 20th century, by extensive Zostera noltii meadows (over 6000 ha), which shrinked to about 1.5 ha in 2004 due to envi-ronmental impacts of hydroelectric power and other anthro-pogenic developments as it is reported by Warner (2012). Over the last decades, there have been global declines in sea-grass abundance in many places in the world, and manage-ment decisions aimed at protecting and restoring submerged aquatic vegetation have been taken in many places (Fonseca et al., 1996; Koch et al., 2006; Pickerell et al., 2005; Van der Heide et al., 2007; Cardoso et al., 2008; Koch et al., 2009, Shafer and Bergstrom, 2010; Vacchi et al., 2012). Of course, it is known that there are a lot of abiotic and biotic factors, which can affect the losses of seagrasses and their lack of re-covery. In particular, as kindly pointed out by one reviewer,
changes in sediment properties, following the loss of sea-grass, is probably an important factor to explain the lack of recovery.
In fact, the problem of the interaction hydrodynamics-meadows needs a multiscale approach. In our case, the largest scale corresponds to the lagoon size itself (155 km2): an intermediate would be the beach scale where meadow ex-isted in the past (a few hundred square meters), and finally the meadow scale (a few square meters, for Berre lagoon) would have to be considered. But, the present research is lim-ited to the largest scale, in which we will assume constant co-efficients for both surface drag and bottom drag. As reported by Warner (2012), flow dynamics involving changes in water character, circulation and elevation in Berre lagoon, have not been studied in any detail up to now. So, the present paper is aimed to overcome this lack of knowledge and to better un-derstand the impact of three main forcings (semidiurnal tide, wind and freshwater inflow) on the 3-D hydrodynamics in Berre lagoon: the circulation patterns and the bottom current in the nearshore areas (i.e., in shallow water).
2 Study area
Berre lagoon is one of the largest Mediterranean brack-ish lagoons (155 km2; 0.98×10⁹m3) in the South of France (Fig. 1). Its three main tributaries are situated in the northern part of the lagoon: an EDF (Electricit´e de France) industrial channel (exit of EDF hydropower station), with a runoff that can reach 250 m3s−1during the peak exploitation period in winter, and two rivers (Arc and Touloubre), with mean runoff equal to 15 m3s−1and 10 m3s−1, respectively. Berre lagoon is connected to the Mediterranean Sea through a long and narrow channel, called Caronte. This complex
190 E. Alekseenko et al.: Nonlinear hydrodynamics in a Mediterranean lagoon
17
1
2
3
Figure 1. Berre lagoon and its tributaries (from Bernard et al., 2007).
4
5
Fig. 1. Berre lagoon and its tributaries (from Bernard et al., 2007).
1
2
Figure 2. Distribution of the average wind over 10 min, station of Port de Bouc - 10 m,
3
period 1992-2001 - 24,793 observations (Sogreah. 2003).
4
5
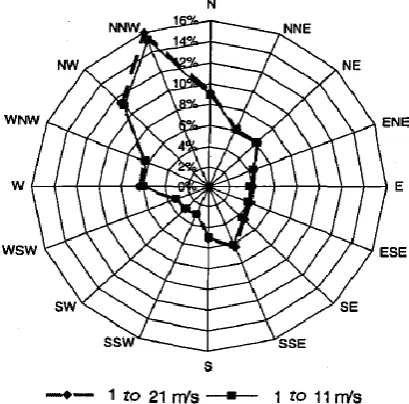
Fig. 2. Distribution of the average wind over 10 min, station of Port de Bouc – 10 m, period 1992–2001 – 24 793 observations (Sogreah. 2003).
hydrosystem is subjected to semidiurnal tide, with amplitude up to 30 cm at the entrance of the channel.
The four control areas of the “Grand Etang” of Berre lagoon, marked by rectangles in Fig. 1, correspond to the places where benthic vegetation existed 50 yr ago and then disappeared completely (Figuerolles and Martigues, on the Western shore) or partially (Arc and “Pointe de Berre”, on the Eastern shore).
Concerning the wind, the meteorological data accumu-lated by Sogreah (2003) for several years (1992–2001) near
19
1
2
Figure 3. Places of in situ experiments on September 28, 2006.
3
4
Fig. 3. Places of in situ experiments on 28 September 2006.
Berre lagoon (Port-de-Bouc station) are shown in Fig. 2 with cumulated frequency of winds overpassing 21 m s−1
(lozenge symbols) and 11 m s−1 (square symbols),
respec-tively. These data concern average winds (over 10 min) at 10 m. Wind speed less than 2 m s−1for all directions repre-sent only 8 % of observations; Berre lagoon is almost perma-nently windy.
To get a first insight about the global current structure, a few in situ experiments were realized in the “Grand Etang” of Berre lagoon to measure the velocity in the water col-umn, with an acoustic Doppler current profiler (ADCP WHS
and Dumas, 2008; Blumberg and Mellor, 1986).
Assuming that the free surface elevation is represented by the functionz=η(x, y, t ), and the bottom relief byz= −H (x, y), the model statement of MARS3D in coordinates
(x, y, z)is
∇V +w0z=0, (1)
u0t+V∇u+wu0z−f v= −(1/ρ0) Px0+ νu0z0z+Fx, (2)
vt0+V∇v+wvz0+f u= −(1/ρ0) Py0+ νvz00z+Fy, (3) where the pressure, P, is obtained by integrating hydro-static equation ρg= −∂P /∂z from the bottom to the free surface; “prime” is a partial derivative u0x;u0y;u0z
= (∂u/∂x;∂u/∂y;∂u/∂z) .
P (x, y, z, t )=Patm+ρ0gη+g 0
Z
z
ρ(x, y, z0, t )dz0, (4)
V – velocity vector with horizontal components(u, v),f – Coriolis force,ν– coefficient of vertical turbulent exchange,
ρ=ρ(S, T , P )– water density,ρ0– reference density,µ–
horizontal eddy viscosity,Fx= 2µu0x 0
x+
µ
u0y+vx0
0
y,
Fy=
2µv0y
0
y
+
µ
u0y+vx0
0
x.
The model of MARS3D contains also two equations of thermodynamics for solving salinity and temperature fields:
Tt0+V 1T+wTz0= kzTz0 0
z+FT, (5)
St0+V 1S+wSz0= kzSz0 0
z+FS, (6)
withFT ,S= kH(T , S)0x 0
x+
kH(T , S)0y 0
y, wherekH, kz– coefficients of horizontal and vertical diffusion.
−ubu0x−vbv0y, ρ0kz(T , S)=(0,0) ,
where(τbx, τby)– horizontal components vector of the ten-sion stress on the bottom.
(τ0x, τ0y)=ρaCdskWk Wx, Wy,whereW – wind ve-locity,Cds=0.0016 – surface drag coefficient,ρa – atmo-spheric density.
(τbx, τby)=ρ0CdB V
(u, v) , where CdB=
(k/ln((z+H+z0) /z0))2 – bottom drag coefficient
withk=0.4 – Von Karman constant,z0– bottom roughness
(in our modelz0=0.0035 m).
For the turbulence closure, the Prandtl model (Wilcox, 2004) was chosen to represent the vertical turbulent exchange coefficient.
4 Numerical modeling and mesh strategy
In MARS3D software, the water column is divided into lay-ers in the transformed vertical “sigma” grid adapted to the bottom and free surface shapes:σ=(z−η)/(H+η); vary-ing from−1 at the bottom−H, to 0 at the free surfaceη. For the discretization of Eqs. (1) – (6) different grids are tested. A uniform grid for the horizontal axes and a nonuniform grid for the vertical axis are implemented as follows
wh= {xi=ihx, yj=j hy, σk=khσ;i=1..Nx, j= 1..Ny, k=1..Nσ;Nxhx=Lx, Nyhy=Ly, Nσhσ =1}, where i, j, k – indexes for directions x, y, z; hx, hy, hσ – spatial steps; Nx, Ny, Nσ – number of nodes along the two horizontal coordinate directions Lx, Ly, and along “sigma” direction, respectively. Concerning the horizontal directions, most of the numerical simulations are performed forhx=hy=50 m,Nx=376, Ny=355.
As a first variant of the vertical grid, the water column is simply divided intoNσ−1 internal layers of nondimensional thickness hσ, and two limiting layers: BL (Bottom layer) and FSL (Free Surface Layer), of nondimensional thickness 0.5hσ. The relationship between the thickness of the two limiting layers1εH=0.5H hσ and the number of nodeNσ is simply given as a function of the depth H in the water basin. For example, for the maximum depth (H=9 m) the
192 E. Alekseenko et al.: Nonlinear hydrodynamics in a Mediterranean lagoon
20
1
(a)
(b)
2
Figure 4. Profiles of horizontal velocity components
V
: (a) u and (b) v for different numbers
3
of layers
N
σat point 1 in Fig. 3, for H =9m in the case of N-NW wind of 80 km/h, 24
4
hours after the beginning of simulation.
5
6
Fig. 4. Profiles of horizontal velocity componentsV: (a)uand (b)vfor different numbers of layersNσ at point 1 in Fig. 3, forH=9 m in the case of NNW wind of 80 km h−1, 24 h after the beginning of simulation.
Fig. 5. Refinement schema for the vertical direction in the two limiting layers BL and FSL; red points – additional nodes in the two limiting layers.
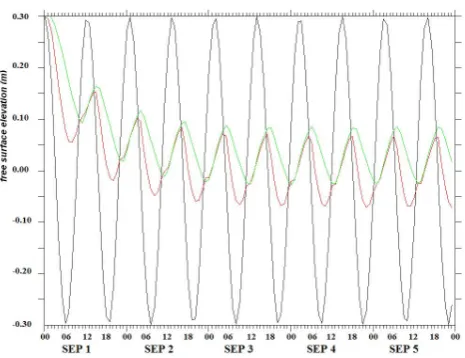
Fig. 6. Time evolution of the free surface elevation at three charac-teristic points: entrance of Caronte channel (sea level) – first line in black ; inside the Berre lagoon at the exit of Caronte channel – second line in red ; inside the Berre lagoon at the point 8 of Fig. 4 – third line in green).
step size used for the discretization withNσ=20, is 0.225 m in both limiting layers.
Figure 4 shows the grid effect on the computed horizon-tal velocity componentsV =(u, v)in the water column, in the case of a flow driven by the wind only (oriented NNW, with a speed of 80 km h−1). The componentuis positive in the sense of x increasing (from east to west), while the com-ponentvis positive in the sense of y increasing (from south to north). The results are given at a selected control place (point 1, in Fig. 3), whereH=9 m.
23 2
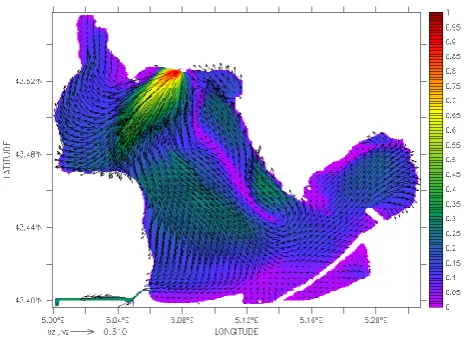
Figure 7. Barotropic currents and velocity modulus for N-NW wind of 80 km/h. 3
4
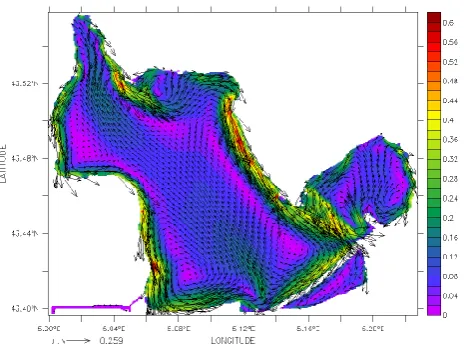
Fig. 7. Barotropic currents and velocity modulus for NNW wind of 80 km h−1.
5 Main dynamical forcing mechanisms in Berre lagoon
In this paragraph, we perform a more detailed analysis of the effect of the three main dynamical forcings in Berre lagoon, i.e.: wind, tide, and freshwater inflow (runoffs). The follow-ing model conditions are considered:
– sinusoidal tide (salt water inflow through a long and
nar-row channel, called Caronte, connecting the Mediter-ranean Sea to Berre lagoon), with amplitude up to 30 cm at the entrance of the channel;
– constant wind velocity, for the two main
orienta-tions (NNW and SSE), ranging from 18 km h−1 to 100 km h−1, according to the wind rose (Fig. 2).
– constant runoffs: (a) from EDF hydropower station,
ranging from 50–200 m3s−1, and (b) from two rivers
(Arc and Touloubre), equal to 15 m3s−1and 10 m3s−1, respectively.
We first analyze the impact of each forcing, separately, on the overall pattern of currents, and in the nearshore zones (typ-ically 500 m×500 m); in particular, the eastern nearshore zone called “Pointe de Berre” (shown in Fig. 1).
In all cases, the initial condition used for the numerical simulation is the quiescent state (zero velocity everywhere) att=0. For each set of meteorological conditions, it takes
about two or three days for the numerical simulation to con-verge to a stable state, starting from the quiescent state.
Although our numerical simulation provides 3-D currents, only a few hydrodynamical characteristics: surface current, mean bottom current and barotropic currents (average along the vertical) will be shown and discussed in the present paper.
24 2
3
Figure 8. Barotropic currents and velocity modulus for S-SE wind of 80 km/h. 4
5
Fig. 8. Barotropic currents and velocity modulus for SSE wind of 80 km h−1.
5.1 Tidal effects in the Berre lagoon
The Caronte channel by which the Mediterranean salty water penetrates into the lagoon is narrow (100–250 m wide) and long (6.5 km). To analyze how the tide propagates along the channel and inside the lagoon; we assume a scenario with-out wind and withwith-out EDF runoff. The semidiurnal sea tide is represented by a harmonic law for the free surface ele-vation at the open boundary of the Caronte channel:η(t )=
0.3 cos(2π(t−t0)/T ), wheret0 – beginning time of compu-tation,T – tidal period (about 44 712 s or 12 h 25 min). The tidal amplitude of 0.3 m was chosen according to local tide-gauge measurements in the Gulf of Fos at the entrance of the Caronte channel.
To establish the harmonic behavior of the tidal effect in the whole lagoon, several tens of hours of numerical simulation starting from a quiescent state were necessary. The time evo-lution of the free surface elevation is presented in Fig. 6 for three characteristic points: (a) entrance of the Caronte chan-nel (sea level), (b) exit of the Caronte chanchan-nel into Berre la-goon, and (c) inside the Berre lagoon at the point 8 of Fig. 3 (close to the nearshore area of Pointe de Berre, ZB). The tide amplitude reaches about 7 cm at the exit of Caronte channel (red line) and about 6 cm near ZB (green line); that means that the tide inside decreases up to 5 times compared with the sea tide amplitude of 30 cm. We also observe a phase shift-ing – a time delay of tide propagation (free surface elevation maximum): inside the Berre lagoon of about 3 h at the exit of the Caronte channel (red line) and of about 4 h near the nearshore zone ZB (green line).
The present numerical results are well coherent with tide-gauge observations reported by Ramade (1997) with tide am-plitude decreasing up to 4–6 times, and a phase shifting of about 4 h.
In most part of the “Pointe de Berre” area, the veloc-ity module is small enough (0–5 cm s−1 for the barotropic
194 E. Alekseenko et al.: Nonlinear hydrodynamics in a Mediterranean lagoon
(a)
25
1
2
(a)
(b)
3
4
5
(c)
6
7
Figure 9. Vertical velocity profile for N-NW wind of 80 km/h; u, v components for the 8
8
control points inside “Grand Etang” (a,b), and (c) velocity modulus at the 4 nearshore control
9
points PA, PB, PM and PF.
10
11
(b)
25
1
2
(a)
(b)
3
4
5
(c)
6
7
Figure 9. Vertical velocity profile for N-NW wind of 80 km/h; u, v components for the 8
8
control points inside “Grand Etang” (a,b), and (c) velocity modulus at the 4 nearshore control
9
points PA, PB, PM and PF.
10
11
(c)
25
1
2
(a)
(b)
3
4
5
(c)
6
7
Figure 9. Vertical velocity profile for N-NW wind of 80 km/h; u, v components for the 8
8
control points inside “Grand Etang” (a,b), and (c) velocity modulus at the 4 nearshore control
9
points PA, PB, PM and PF.
10
11
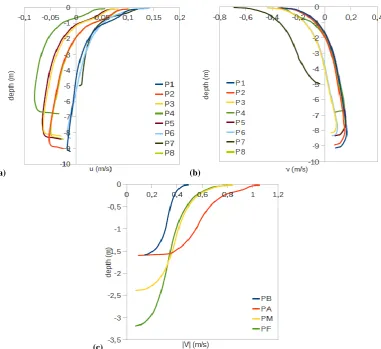
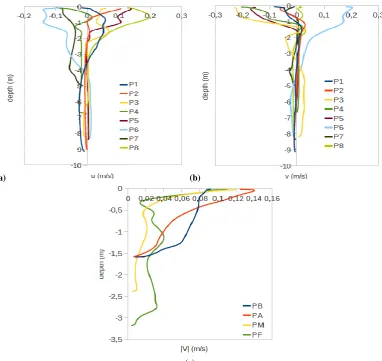
Fig. 9. Vertical velocity profile for NNW wind of 80 km h−1;u,vcomponents for the 8 control points inside “Grand Etang” (a, b), and (c) velocity modulus at the 4 nearshore control points PA, PB, PM and PF.
1
(a)
(b)
Figure 10. Nearshore currents; (a) free surface, (b) bottom; in the square domain ZB, for a N-NW
wind of 80 km/h.
2
3
Fig. 10. Nearshore currents; (a) free surface, (b) bottom; in the square domain ZB, for a NNW wind of 80 km h−1.
study; speed values of 80 km h−1 for each of the two main directions NNW and SSE will be considered; barotropic cur-rents are shown in Figs. 7 and 8, respectively.
It is observed that the (vertically integrated) barotropic current is maximal alongshore in the wind direction; it presents two principal gyres, longed downwind, which di-vide the “Grand Etang” in two parts, with opposite current to the wind direction in the deeper central part and two co-directional currents, stronger, along the eastern and western shores.
For a SSE wind of 80 km h−1, Fig. 8 shows strong down-wind currents along the eastern and western shores. Analog-ically to the NNW wind (Fig. 13), there are two main gyres, but circulating in the opposite sense.
Barotropic current fields, in Figs. 7–8, give a global (verti-cally integrated) information about current structure in the whole lagoon, but cannot reflect complexity of the veloc-ity distribution in the vertical direction. As an example of such complexity, we present in Fig. 9a, b, at the 8 control points (P1–P8) shown in Fig. 3, the vertical profiles of the two horizontal components of the velocity; the componentu
being positive in the sense of x increasing (from east to west), while the componentvis positive in the sense of y increas-ing (from south to north). A change of the current direction is observed at a depth of about 1–2 m at the points 1, 2, 4, 5 and 8 (i.e., more inside), and of about 3–4 m at the points 3 and 6 (closer to shore). Point 7 is special, with a larger velocity; it corresponds to the zone of water exchange between Berre lagoon and the Caronte channel.
Figure 9c shows the profiles of the velocity modulus for 4 nearshore control points PB, PA, PM and PF. In the bottom layer, we determined an averaged velocity modulus (mean value at the three vertical mesh points in the limiting bottom layer (i.e., ath=H /40 from the bottom). Strong enough bot-tom currents exist at the center of these four nearshore con-trol zones: 13.7 cm s−1at PB, 16.2 cm s−1at PA, 11.2 cm s−1 at PM and 10 cm s−1at PF. Due to these high enough bottom velocities, which correspond to strong enough shear stress, we can expect an impact on the sediment composition, and so, on the erosion resistance of the sediment (Ahmad et al., 2011). Indeed, the living Zostera noltii are generally growing
27 2
Figure 11. Currents near the free surface and velocity modulus for EDF runoff of 125 m3/s.
3 4
Fig. 11. Currents near the free surface and velocity modulus for EDF runoff of 125 m3s−1.
28 1
Figure 12. Currents near the free surface and velocity modulus for EDF runoff of 200 m3/s. 2
3
Fig. 12. Currents near the free surface and velocity modulus for EDF runoff of 200 m3s−1.
on mud–sand sediments; but when these plants disappeared in the past, due to fresh water stressor, the sediment compo-sition was probably changed by a decreasing of mud concen-tration.
More detailed results of nearshore velocity fields at the free surface and at the bottom are given, as an example, in a square domain ZB (Pointe de Berre) of dimension 500 m×500 m around the control point PB. The velocity fields for a NNW wind of 80 km h−1are given in Fig. 10a for
the free surface and in Fig. 10b for the sea bed. We can ob-serve that starting from the control point PB (at the centre of ZB area) in direction of the shore, the free surface velocity di-minishes monotonically when approaching the shoreline; but on the contrary, the bottom velocity reaches values substan-tially higher (Fig. 10b) in some parts of the shallow water. Typically, the bottom speed can be of the order of 0.2 m s−1 at PB (situated at 250 m from the shore), but becomes twice as fast at about 100 m of the shore. This observation is in
196 E. Alekseenko et al.: Nonlinear hydrodynamics in a Mediterranean lagoon
(a)
29
1
2
(a)
(b)
3
4
(c)
5
6
Figure 13. Vertical velocity profile for EDF runoff of 200 m
3/s; u, v components for the 8
7
control points inside “Grand Etang” (a,b), and (c) velocity modulus at the 4 nearshore control
8
points PA, PB, PM and PF.
9
10
11
(b)
1
2
(a)
(b)
3
4
(c)
5
6
Figure 13. Vertical velocity profile for EDF runoff of 200 m
3/s; u, v components for the 8
7
control points inside “Grand Etang” (a,b), and (c) velocity modulus at the 4 nearshore control
8
points PA, PB, PM and PF.
9
10
11
29
1
2
(a)
(b)
3
4
(c)
5
6
Figure 13. Vertical velocity profile for EDF runoff of 200 m
3/s; u, v components for the 8
7
control points inside “Grand Etang” (a,b), and (c) velocity modulus at the 4 nearshore control
8
points PA, PB, PM and PF.
9
10
11
(c)
Fig. 13. Vertical velocity profile for EDF runoff of 200 m3s−1;u,vcomponents for the 8 control points inside “Grand Etang” (a, b), and (c) velocity modulus at the 4 nearshore control points PA, PB, PM and PF.
agreement with the remark of Wiseman and Rouse (1980) about the importance of interaction with the topography (shallow bathymetry) mentionned by Allen (1975), in ad-dition to the barotropic nature of the flow pointed out by Csanady (1971).
5.3 Influence of large freshwater runoffs
In this subchapter, the influence of large freshwater runoffs in the northern part of “Grand Etang” is analyzed in the case without wind or tidal effects. Two different values of EDF runoffs: 125 m3s−1 and 200 m3s−1 are considered.
Addi-tional inflows of the two rivers “Arc” and “Touloubre” (see Fig. 1), are also taken into account (15 m3s−1and 10 m3s−1, respectively). To analyze the impact of the EDF runoffs, we first consider the structure and intensity of the currents at the free surface layer for two selected runoffs (Figs. 11 and 12, respectively).
The flow coming from the EDF hydropower station is de-flected by the western shore and divided in two branches;
then the southern branch impinges the southern shore and is mainly deflected to the eastern direction. The contribution of river runoffs (Arc and Touloubre) is also visible.
In Figs. 11 and 12, the global structure of the currents in the “Grand Etang” is the same, with two branches deflected by the western shore, but with stronger currents. In these cases, the deflection of the southern branch by the southern shore is stronger and gives rise to a counterclockwise gyre, with a significant returning current flowing along the eastern shore.
As in the previous subchapter, it is interesting to consider the vertical velocity profiles at some relevant places (8 con-trol points in “Grand Etang”, and 4 nearshore concon-trol points). Figure 13 permits us to understand that the EDF runoff af-fects mainly the current near the free surface, for most of the control points in the central part of the Berre lagoon (3 m un-der the free surface) and the nearshore control points (1 m under the free surface). The surface velocity does not ex-ceed 25 cm s−1. At the points P1, P3 and P5 we can see a
PM
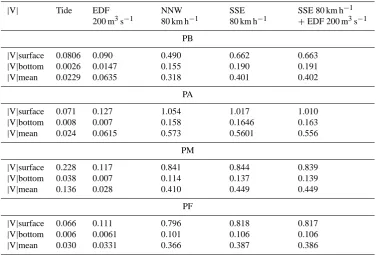
|V|surface 0.228 0.117 0.841 0.844 0.839
|V|bottom 0.038 0.007 0.114 0.137 0.139
|V|mean 0.136 0.028 0.410 0.449 0.449
PF
|V|surface 0.066 0.111 0.796 0.818 0.817
|V|bottom 0.006 0.0061 0.101 0.106 0.106
|V|mean 0.030 0.0331 0.366 0.387 0.386
downwelling current. It is to be noted that at the 4 nearshore control points, the current in the entire water column has the same direction than the surface flow shown in Fig. 12. In addition, we can see that the velocities induced by the EDF runoff taken separately (i.e., without wind or tide effect) in these 4 areas would not influence substantially bottom cur-rents, except for the PB area (Fig. 13c).
5.4 Combined effects of strong wind and inflow
Of course, the three mechanisms, analyzed in the preced-ing subchapters, occur simultaneously and are independent of each other: the tides alternate approximately every 6 h; the wind is very often changing its direction and speed, while EDF runoff is seasonal. Now, on the basis on the results ob-tained in the previous subsections, we consider a situation in which two prevailing mechanisms (except tide) occur si-multaneously and concurrently: SSE wind with a speed of 80 km h−1 and EDF runoff of 200 m3s−1. For such a cou-pling, we could expect a larger velocity inside the eastern nearshore zones, like ZB. The influence of these two cou-pled forcings on the characteristic nearshore velocities (sur-face, bottom, average) is summarized in Table 1, which per-mits, in particular, a comparison between the results for SSE wind alone and coupled with large EDF runoff, respectively. We were expecting a co-current effect at PB. But, contrary to our expectation, the velocities are almost the same. That means that the co-current effect along the eastern shore is ex-actly balanced by the counter-current effect along the west-ern shore. We observe almost the same balancing effect at
the three other control areas, PA, PF and PM, for the same reasons. This means that the current is not simply the sum of the two contributions, confirming the strong nonlinearity of the system.
6 Discussion and conclusions
We have numerically investigated the nonlinear hydrody-namics induced by three main dynamical forcings (tide, wind and runoff) in Berre lagoon, a semi-closed hydrosys-tem which is subject to strong enough and frequent winds. This study was carried out as a contribution of a project of recolonization of protected seagrass (Zostera noltii) in some nearshore places in Berre lagoon.
The problem of recolonization of damaged seagrass is a very complex multiscale problem, which is the object of an always increasing number of studies, for both abiotic and bi-otic aspects, in many places in the world. Our contribution was concerning only one of the abiotic aspects (i.e., hydro-dynamics) at the scale of the lagoon itself. That means that is was needed to make several assumptions; in particular, both free surface drag and bottom drag were assumed to be con-stant.
The use of the parallel version of MARS3D package per-mitted us to determine accurately the global influence of each mechanical forcing on the current structure in the whole la-goon and in the coastal areas. The circulation in the “Grand Etang” of Berre lagoon induced by the EDF inflow is a coun-terclockwise gyre. However, the pattern may be completely
198 E. Alekseenko et al.: Nonlinear hydrodynamics in a Mediterranean lagoon
changed as a result of windforcing. For both main wind di-rections (NNW and SSE), the barotropic current is split-ted into two separate gyres with coastal jets alongshore and windward. For strong NNW winds, the barotropic gyre is counterclockwise on the western side of the lagoon, and clockwise on the eastern side. For strong SSE winds, it is just the opposite.
The main result, which was never mentioned before in Berre lagoon literature, is the existence of these coastal jets, and the fact that the bottom velocity is varying non-monotonically in these shallow water areas when approach-ing the shore. Bottom velocity of the order of 40 cm s−1, and faster, at a distance as small as 100 m from the shore, can be induced by a wind of the order of 80 km h−1.
Such coastal jets with high enough bottom velocity, which correspond to strong enough shear stress, can be expected to have an impact on the sediment composition, and thus, on the erosion resistance of the sediment (Ahmad et al., 2011). Indeed, as the living Zostera noltii are generally growing on mud–sand sediments, we can expect that the sediment com-position was probably changed by a decreasing of mud con-centration. Such changes in sediment properties, following the loss of seagrass, could be an important factor to explain the lack of recovery.
It is known that the dependency of mud–sand composition on the erosion resistance of bottom sediments is a very open problem. So, it would be pertinent, and very challenging, in view of future recovery programs to study very carefully this question of hydrodynamics–sediment interaction, at least in the case of strong bottom current.
Acknowledgements. This study was partly supported by the French
Ministry of Higher Education and Research (French–Russian research-training programme), by the French Water Agency (AE-RMC-convention no. 2010-0042) and by the French Ministry of Foreign Affairs (ARCUS-Russia program). We also wish to thank reviewers for their pertinent remarks and questions.
Edited by: H. Kalisch
Reviewed by: two anonymous referees
References
Ahmad, M. F., Dong, P., Mamat, M., Wan Nik, W. B., and Mohd, M. H.: The critical shear stresses for sand and mud mixture, Appl. Math. Sci., 5, 2, 53–71, 2011.
Allen, J. S.: Coastal trapped waves in a stratified ocean, J. Phys. Oceanogr., 5, 300–325, 1975.
Blumberg, A. F. and Mellor, G. L.: A description of a Tree-Dimensional Coastal Ocean Circulation Model, Geophys. Fluid Dynam. Progr., Princeton Univ., Princeton, New Jersey, 1–16, 1986.
Bernard, G., Boudouresque, C. F., and Picon, Ph.: Long term changes in Zostera meadows in the Berre lagoon (Provence,
Mediterranean Sea), Estuar. Coast. Shelf Sci., 73, 617–629, 2007.
Cardoso, P. G., Raffaelli, D., and Pardal, M. A.: The impact of extreme weather events on the seagrass Zostera noltii and re-lated Hydrobia ulvae population, Mar. Pollut. Bull., 56, 483–492, 2008.
Csanady, G. T.: Large-scale motion in the Great Lakes, J. Geophys. Res., 72, 4151–4161, 1967.
Csanady, G. T.: Baroclinic boundary currents and long edge-waves in basins with sloping shores, J. Phys. Oceanogr., 1, 92–104, 1971.
Fiandrino, A., Martin, Y., Got, P., Bonnefont, J. L., and Troussellier, M.: Bacterial contamination of Mediterranean coastal seawater as affected by riverine inputs: simulation approach applied to a shellfish breeding area (Thau lagoon, France), Water Res., 37, 1711–1722, 2003.
Fonseca, M. S., Kenworthy, W. J., and Courtney, F. X.: Develop-ment of planted seagrass beds in Tampa Bay, Florida, USA. I. Plant components, Mar. Ecol. Prog. Ser., 132, 127–139, 1996. Hunter, J. R. and Hearn, C. J.: Lateral and vertical variations in the
wind-driven circulations in long, shallow lakes, J. Geophys. Res., 92, 13106–13114, 1987.
Koch, E. W. K., Sanford, L. P., and Chen, S.-N.: Waves in Seagrass Systems: Review and Technical Recommendations, USA Corps of Eng., report ERDC TR-06-15, 2006.
Koch, E. W., Barbier, E. B., Silliman, B. R., Reed, D. J., Perillo, G. M. E., Hacker, S. D., Granek, E. F., Primavera, J. H., Muthiga, N., Polasky, S., Halpern, B. S., Kennedy, Ch. J., Kappel, C. V., and Wolanski, E.: Non-linearity in ecosystem services: temporal and spatial variability in coastal protection, Front. Ecol. Environ., 7, 29–37, 2009.
Lazure, P. and Dumas, F.: An external-internal mode coupling for a 3-D hydrodynamical model at regional scale (MARS), Adv. Wat. Res., 31, 233–250, 2008.
Pickerell, C. H., Schott, S., and Wyllie-Echeverria, S.: Buoy-Deployed Seeding: Demonstration of a new eelgrass (Zostera marina L.) planting method, Ecol. Eng., 25, 127–136, 2005. Ramade, A.: Modalit´es d’ouverture du tunnel du Rove: approche
des ´echanges qualit´e; internal report, Private communication, 1997.
Shafer, D. and Bergstrom, P.: An Introduction to a Special Issue on Large-Scale Submerged Aquatic Vegetation Restoration Re-search in the Chesapeake Bay: 2003–2008, Restor. Ecol., 18, 481–488, 2010.
Sogreah: BERRE – Etudes de premiere phase, Evaluation compar-ative des impacts maritimes des solutions B et T, 28 April 2003. Van der Heide, T., van Nes, E. H., Geerling, G. W., Smolders, A. J. P., Bouma, T. J., and van Katwijk, M. M.: Positive feedbacks in seagrass ecosystems: Implications for success in conservation and restoration, Ecosystems, 10, 1311–1322, 2007.
Warner, R. F.: Environmental impacts of hydroelectric power and other anthropogenic developments on the hydro morphology and ecology of the durance channel and the Etang de Berre, southeast France, J. Environ. Manag., 104, 35–50, 2012.
Wilcox, D. C.: Turbulence Modelling for CFD, ISBN 1-928729-10-X, 2nd Ed., DCW Industries, Inc., 2004.