@Mayas Publication UGC Approved Journal Page 192 A STUDY ON CUSTOMERS’ SERVICE QUALITY OF COMMERCIAL BANKS
Dr.K.KARTHIK SRIDHAR
Assistant Professor (S.G)
Department of Business Administration
Faculty of Management
SRM University, Kattankulathur- 603 203
Abstract
Customer relationship management has been as important to the banking industry at the start of the 21st century as it has been to any other industry. Many banks have used CRM tools to acquire more customers and to improve relationships with them. More competition and increased regulation made it more difficult for banks to stand out from the crowd. However, the development of CRM gave proactive banks access to technology that helped them improve customer retention by using customer feedback to offer conveniences like ATMs and online banking. Banks can also use CRM tools to improve customer loyalty by using data collected through customer sign-ups, transactions and feedback processes.
Especially in banking industry is Customer‟s expectations are now not only limited to get best products and services, they also need a face-to-face business in which they want to receive exactly what they demand and in a quick time with quality. Important Service Quality of Commercial banks refer to process quality as
judged by customers during a service delivery and output quality judged after a service is performed. The important objective of the establishment of the CRM at the commercial banks is to enrich customer satisfaction and generate customer loyalty. In the present study, the outcome of the CRM implementation of service quality has been measured with the help of the customers perception on the overall service quality of the commercial banks
Keywords: Service Quality, Commercial
Banks, Customer Relationship Management,
Important Service Quality Factors.
Introduction
@Mayas Publication UGC Approved Journal Page 193 become increasingly important for organizations
to find ways, not only to reach the top, but to maintain that leadership in ever increasing competitive market place. In order to protect their long term interest, service organisations are seeking ways to forge and maintain service quality. The changing focus of service quality from a mere competing instrument to that basic core of service concept in meeting and exceeding customer expectation is an emerging important issue in service organization. Banking services is no exception. The banking industry, being very competitive, not only focuses on providing wide productlines to create competitive advantages, but also emphasizes the importance of its services, particularly in maintaining service quality.
In the service sector the financial services are the backbone. In financial services banking is the most important segment. This is so, because banking is a catalyst and life of modern trade and commerce. It is an integral part of all the businesses and social activities. This rapid transformation of service in the banking system has led to the evolution of a highly competitive and complex market where there is a continuous refinement of services. Hence the increased role of banking in India‟s economic development on the one hand and the changes in the business climate on the other has put increased pressure on them. These changes are compelling the banks to reorganize themselves in order to cope
with the present conditions. Hence they even try to provide services at the customers place itself. Review of Literature
Service quality is a concept that has aroused considerable interest and debate in the research literature because of the difficulties in both defining it and measuring it with no overall consensus emerging on either (Wisniewski 2001). There are a number of different "definitions" as to what is meant by service quality. One that is commonly used defines service quality as the extent to which a service meets customers‟ needs or expectations (Lewis and Mitchell 1990, Dotchin and Oakland 1994a, Asubonteng et al 1996, Wisniewski and Donnelly 1996). Service quality can be defined as the difference between customer expectations of service and perceived service. If expectations are greater than performance, then perceived quality is less than satisfactory and hence customer dissatisfaction occurs (Parasuraman et al 1985, Lewis and Mitchell 1990).
@Mayas Publication UGC Approved Journal Page 194 (Arnauld et al 2002). Grönroos (1984) and
Parasuraman et al (1985) look at perceived quality of service as the difference between customers‟ expectation and their perceptions of the actual service received. Other researchers look at perceived service quality as an attitude. Arnauld et al (2002) defined perceived quality “whether in reference to a product or service” as “the consumer‟s evaluative judgment about an entity‟s overall excellence or superiority in providing desired benefits”. Hoffman and Bateson (2001) defines service quality as an attitude “formed by a long-term, overall evaluation of a performance”. Attitude is defined, as “a consumer‟s overall, enduring evaluation of a concept or object, such as a person, a brand, or a service” (Arnauld et al 2002). Service quality as “an attitude” is consistent with the views of Parasuraman et al (1988), Cronin and Taylor (1992) and Sureshchandar et al (2002). The latter elaborates basis of the view: “As perceived service quality portrays a general, overall appraisal of service i.e. a global value Judgment on the superiority of the overall service, it is viewed as similar to attitude.” Service quality has been seen as critical for service firms to position themselves strongly in a competitive environment (Parasuraman et al 1985, Shemwell et al 1998, Mehta et al 2000) and also as indicators of business performance (Hurley and Estelami 1998). When faced with larger, powerful retail
competitor, smaller stores could compete by improving service instead of competing on price (Klemz and Boshoff 1999). Concentrating on service quality is seen as critical in markets that offer similar products in the store (Berry 1995). However, improvement of the quality of services requires 27 identification of the service quality attributes - the so-called dimensions- that are important to customers. A service has lot of intangible dimensions including reliability, responsiveness, competence, courtesy, friendliness, security, ambience etc. These dimensions are qualitative by nature and their values are subjective.
Statement of the Problem
@Mayas Publication UGC Approved Journal Page 195 to analyze the perception of customers about
customer relationship and service quality of these banks.
Need for the Study
Today‟s Banks are under pressurizing situation that to attracting, satisfying and retaining customers. Customer Relationship Management (CRM) has been focused severely and evolving as a great thrust area of research in Management. Hence, the investigator made an attempt to study the service quality in commercial banks rendering by the public and private sector banks in Sivagangai District.
Objectives
1. To identify the importance of service quality factors of commercial banks
2. To study on implementation of important service quality of commercial banks
3. To analyse the customers‟ perception on important service quality of commercial banks Research Design
In the present study, the descriptive and analytical type research designs have been administered. Since this research describes the profile of the customers in banking industry and their perception on the CRM at banks, it is descriptive in nature. Mean while, this study analyses the perception on service quality, it is diagnostic in nature.
Sample
In total, there are 83 Public and 33 Private Sector Commercial Banks branches in this district. Hence the sampled customers are 163 in private and public sector banks have been included in the present study. The applied sampling technique of the present study is purposive sampling.
Framework of Analysis
For analyzing the data collected during the investigation, the statistical following tools were used based upon the nature of data and relevance of the information required. „t‟ test, F-test EFA and CFA.
Analysis and Interpretation
@Mayas Publication UGC Approved Journal Page 196 highly satisfied to highly dissatisfied. The
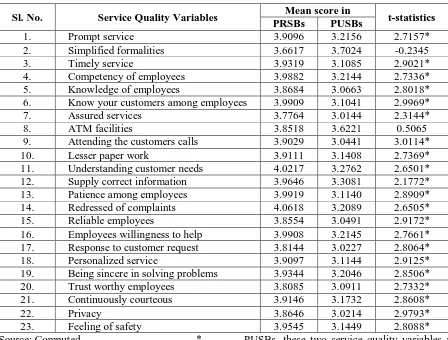
assigned scores on these scales are from 5 to 1 respectively. The mean scores of each service quality variables among the customers in the PRSBs and the PUSBs have been computed separately in order to exhibit the customers‟
perception on service quality variables. The „t‟ test has been used to find out the significant difference among the two groups of customers regarding their perception on service quality variables. The results are given in below table.
TABLE No.1
Customers‟ Perception on Service Quality Variables
Sl. No. Service Quality Variables Mean score in t-statistics
PRSBs PUSBs
1. Prompt service 3.9096 3.2156 2.7157*
2. Simplified formalities 3.6617 3.7024 -0.2345
3. Timely service 3.9319 3.1085 2.9021*
4. Competency of employees 3.9882 3.2144 2.7336*
5. Knowledge of employees 3.8684 3.0663 2.8018*
6. Know your customers among employees 3.9909 3.1041 2.9969*
7. Assured services 3.7764 3.0144 2.3144*
8. ATM facilities 3.8518 3.6221 0.5065
9. Attending the customers calls 3.9029 3.0441 3.0114*
10. Lesser paper work 3.9111 3.1408 2.7369*
11. Understanding customer needs 4.0217 3.2762 2.6501*
12. Supply correct information 3.9646 3.3081 2.1772*
13. Patience among employees 3.9919 3.1140 2.8909*
14. Redressed of complaints 4.0618 3.2089 2.6505*
15. Reliable employees 3.8554 3.0491 2.9172*
16. Employees willingness to help 3.9908 3.2145 2.7661*
17. Response to customer request 3.8144 3.0227 2.8064*
18. Personalized service 3.9097 3.1144 2.9125*
19. Being sincere in solving problems 3.9344 3.2046 2.8506*
20. Trust worthy employees 3.8085 3.0911 2.7332*
21. Continuously courteous 3.9146 3.1732 2.8608*
22. Privacy 3.8646 3.0214 2.9793*
23. Feeling of safety 3.9545 3.1449 2.8088*
Source: Computed * Significant at five per cent level.
The highly perceived service quality variables among the customers in the PRSBs understand customer needs and redressal of complaints since their respective mean scores are 4.0217 and 4.0618. Among the customers in the
@Mayas Publication UGC Approved Journal Page 197 customers have been noticed in all service
quality variables except simplified formalities and ATM facilities since their respective „t‟ statistics are not significant at five per cent level.
Important Service Quality Factors (ISQFS)
in Commercial Banks
The scores of the service quality variables have been included for the Exploratory Factor Analysis (EFA) in order to narrate the service quality variables into service quality factors. Initially, the test of validity of data for the EFA has been tested with the help of the KMO
measure of sampling adequacy and Bartletts test of sphericity. Since the KMO measure is greater than 0.5 and the level of significance of Chi-Square value is at zero per cent level, the validity of the data for the EFA has been confirmed. The EFA results in five important service quality factors (ISQFs) are Reliability, Responsiveness, Empathy, Speedy service and Assurance. The Number of variables included in each ISQF, its Eigen value and per cent of variation explained by the each ISQF are given in the table.
TABLE No.2
Important Service Quality Factors (ISQFS) in Commercial Banks
Sl.
No. ISQFs
Number of Variables
Eigen Value
Reliability co-efficient
Per cent of Variation Explained
Cumulative Per cent of
Variation Explained
1. Reliability 6 4.1082 0.7668 18.19 18.19
2. Responsiveness 5 3.6417 0.8144 16.44 34.63
3. Empathy 5 3.3092 0.7509 15.39 50.02
4. Speedy Service 4 2.4517 0.8239 12.46 62.48
5. Assurance 3 1.8245 0.7406 10.23 72.71
Source: Computed * Significant at five per cent level. The most important ISQF is reliability
since its Eigen value and the per cent of variation explained by it are 4.1082 and 18.19 per cent respectively. It consists of six variables with the reliability coefficient of 0.7668. The second and third ISQFs are responsiveness and empathy since their Eigen values are 3.6417 and 3.3092 respectively. The per cent of variation explained by these two ISQFs are 16.44 and
15.39 per cent respectively. The last two ISQFs are speedy service and assurance which consists of 4 and 3 variables with the reliability coefficient of 0.8239 and 0.7406 respectively.
@Mayas Publication UGC Approved Journal Page 198 among the customers in the PRSBs and the
PUSBs have been computed separately. Regarding the perception on the ISQFs, the significant difference among the two groups of
customers have been examined with the help of „t‟ test. The results are given in the below table.
CUSTOMERS’ PERCEPTION ON ISQFs AT COMMERCIAL BANKS
Sl. No. ISQFs Mean score in t-statistics
PRSBs PUSBs
1. Reliability 3.9138 3.1573 3.1453*
2. Responsiveness 3.8745 3.0879 3.3049*
3. Empathy 3.9808 3.1646 2.9647*
4. Speedy Service 3.8716 3.4186 1.8644
5. Assurance 3.8777 3.0984 2.8865*
Overall 3.9078 3.1816 2.6332*
Source: Computed * Significant at five per cent level. The highly perceived ISQFs among
the customers in the PRSBs are reliability and empathy since their mean scores are 3.9138 and 3.9808 respectively. Among the customers in the PUSBs, these two ISQFs are speedy service and empathy since their mean scores are 3.4186 and 3.1646 respectively. Regarding the customers‟ perception on the ISQFs, the significant difference among the two groups of customers has been noticed in reliability, responsiveness, empathy and assurance since their respective„t‟ statistics are significant at five per cent level. The overall perception ISQFs is identified as higher among the customers in the PRSBs
than among the customers in the PUSBs.
Association between the Profile of
Customers and their Perception Score on
ISQFs
@Mayas Publication UGC Approved Journal Page 199 TABLE No.3
Association between the Profile of Customers and their Perception Score on ISQFs
Sl.
No. Profile Variables
F-statistics
Reliability Responsiveness Empathy Speedy
Service Assurance
1. Gender 3.0145 3.1244 3.5672 2.7165 3.6582
2. Age 3.2142* 2.7086* 2.6584* 2.4038* 2.9161*
3. Educational status 2.6871* 2.5061* 3.1144* 2.0674 2.5142* 4. Occupational status 2.8033* 2.6565* 2.0862 1.9962 2.4508*
5. Income per month 2.6511* 2.0812 3.1412* 2.8598* 2.6562*
6. Family income per
month 2.2862 2.1144 2.9086* 2.7086* 2.5515*
7. Years of experience
in bank 2.0862 2.7108* 2.1144 2.6514* 1.8969
8. Number of accounts
in bank 2.1144 2.0886 1.9891 3.0896* 2.9969*
Source: Computed * Significant at five per cent level.
The significantly associating profile variables with the perception on reliability are age, educational status, occupational status and monthly income of the customers whereas in the perception on responsiveness these profile variables are age, educational status, occupational states and years of experience in bank since their respective „F‟ statistics are significant at five per cent level. Regarding the perception on empathy, these profile variables are age, educational status, monthly income and family income whereas in the perception on speedy service, these profile variables are age, monthly income, family income, years of experience in bank and number of accounts in bank. Regarding the perception on „assurance‟ these significant profile variables are age, educational status, occupational status, monthly income, family income and number of
accounts in bank. Conclusion
@Mayas Publication UGC Approved Journal Page 200 Reference
1) Gani, A., and Mushtag A. Bhat (2003), “Service Quality in Commercial Banks: A Comparative Study”, Paradigm, Vol.7 No.1, January-June, pp.29-36.
2) Dhillon, J.S, Dr.G.S. Batra, G.S., and Atal Dhyani (2003), “Pardigm Change: Relationship Marketing and Service Quality of Banking Services”, IBA Bulletin, June, pp.26-30.
3) Gandy A (2000), Banking Strategies and Beyond 2000, New York: AMACOM. 4) Cheu I. A (2003), “A Study of the Effect
of Internal Service Quality on External
Service Quality: Banking Industry as an Example”, Unpublished Thesis, Natural Dong. Hwa University, Taiwan.