Proc. IAHS, 370, 177–181, 2015 proc-iahs.net/370/177/2015/ doi:10.5194/piahs-370-177-2015
© Author(s) 2015. CC Attribution 3.0 License.
Open Access
in
Flood
Risk
and
P
erception
in
Catchments
and
Cities
(HS01
–
IUGG2015)
Extensive spatio-temporal assessment of flood events by
application of pair-copulas
M. Schulte and A. H. Schumann
Institute of Hydrology, Water Resources Management and Environmental Engineering, Ruhr-University Bochum, Bochum, Germany
Correspondence to: A. H. Schumann (andreas.schumann@rub.de)
Received: 25 March 2015 – Accepted: 25 March 2015 – Published: 11 June 2015
Abstract. Although the consequences of floods are strongly related to their peak discharges, a statistical clas-sification of flood events that only depends on these peaks may not be sufficient for flood risk assessments. In many cases, the flood risk depends on a number of event characteristics. In case of an extreme flood, the whole river basin may be affected instead of a single watershed, and there will be superposition of peak discharges from adjoining catchments. These peaks differ in size and timing according to the spatial distribution of precipitation and watershed-specific processes of flood formation. Thus, the spatial characteristics of flood events should be considered as stochastic processes. Hence, there is a need for a multivariate statistical approach that represents the spatial interdependencies between floods from different watersheds and their coincidences. This paper ad-dresses the question how these spatial interdependencies can be quantified. Each flood event is not only assessed with regard to its local conditions but also according to its spatio-temporal pattern within the river basin. In this paper we characterise the coincidence of floods by trivariate Joe-copula and pair-copulas. Their ability to link the marginal distributions of the variates while maintaining their dependence structure characterizes them as an adequate method. The results indicate that the trivariate copula model is able to represent the multivariate proba-bilities of the occurrence of simultaneous flood peaks well. It is suggested that the approach of this paper is very useful for the risk-based design of retention basins as it accounts for the complex spatio-temporal interactions of floods.
1 Introduction
The design of flood retention basins for small catchments usually focuses on the runoff of the main channel. The rel-evant analyses involve both the peak runoff and the corre-sponding flood volume. Both characteristics are important parameters, which decide if a flood detention measure is suf-ficient to meet the required protection targets. Consequently, both variables need to be examined together. The use of bi-variate copulas offers one possibility to do this (e.g. Favre et al., 2004; De Michele et al., 2005). However, the design of technical flood detention is getting more complex with increasing area of the watershed and the related branching of the river network. Because of the superposition of flood peaks of different sub-basins or adjoining catchments, the risk of flooding and overloading of storage (-systems) may increase downstream which increases the complexity of the
of historical flood events, and compare the different copula types. The results suggest that joint return periods are indeed able to represent the spatio-temporal flood patterns within the river basin in a meaningful way.
2 Estimation of multivariate return periods via 3-D-and pair-copulas
The conventional flood statistics analyses the univariate probability that the peak valueX exceeds a design valuex. The case of X > x characterises a critical situation. In the multivariate case, we have to consider more than one vari-able, so the critical region is multi-dimensional. Downstream of a confluence, critical discharges may only occur if the trib-utaries cause a flood at the same time. The corresponding peak discharges of the adjoining rivers usually show posi-tive statistical (non-linear) correlation, which is even higher for adjacent catchments. To describe the influence of these interdependencies copulas can be applied. They are able to relate the marginal distributions of the peaks while maintain-ing their dependence structure. Here, only a brief outline of the concept of copulas is given. More information, e.g. for parameter estimation or tests of goodness of fit, can be found in Nelsen (2006) and Joe (2014). Copulas are based on the theorem of Sklar (1959). It describes the linking of the cop-ula function C with the univariate distribution functions of correlated random variables X1, . . ., Xd (Eq. 1). F1, . . ., Fd represent the associated marginal cumulative density func-tions.
F(x1, . . ., xd)=C[F1(x1), . . ., Fd(xd)]
=P(X1≤x1, . . ., Xd≤xd) (1)
Similarly to a univariate distribution, a copula can be taken as a multivariate distribution function. A huge number of copula functions exists, which can be classified into different fami-lies. One of them is the family of Archimedean copulas. They are based on their specific generation functionφ, which is a continuous, convex and strictly monotonic decreasing func-tion. The trivariate Archimedean copula has the form
C(u, v, w)=ϕ−1[ϕ(u)+ϕ(v)+ϕ(w)], (2)
Cθ(u, v, w)=1−1−1−(1−u)θ·1−(1−v)θ
·1−(1−w)θ 1/θ. (3)
The combination of the flood peaks of the adjoining rivers characterises a flood event with regard to its spatial-temporal occurrence. The multivariate return periodsT of the event is:
TU >u∧V >v∧W >w=
µ
P(U > u∧V > v∧W > w)
= µ
1−u−v−w+C(u, v)+C(u, w)+C(v, w)−C(u, v, w). (4)
The valueµis the mean time between events. In case of an-nual maximaµis equal to 1 (a). As Eq. (4) shows, the bi-variate copula functions are needed for estimating the return periods.
Another possibility to construct copula models of higher dimensions is the use of pair-copulas (Joe, 1996; Aas et al., 2009). They are based on conditional bivariate copulas, which can be coupled by the concept of vines (Bedford and Cooke, 2002). Figure 1 shows the popular D-Vine. It is easy to imagine how a D-Vine can represent a network of three joining rivers. According to Joe (1996) the marginal condi-tional distribution functions are derived as
Fu|v(u|v)=
δC11(u, v) δFv(v)
, (5)
Fw|uv(w|u, v)=
δC21 Fw|v(w|v), Fu|v(u|v)
δFu|v(u|v)
. (6)
In case of pair-copulas we estimated the required return pe-riods by using a bootstrapping approach. We generated ten trivariate samples of 1 000 000 elements each by the fitted pair-copula model and obtained the return periods via fre-quency analysis.
3 Case study
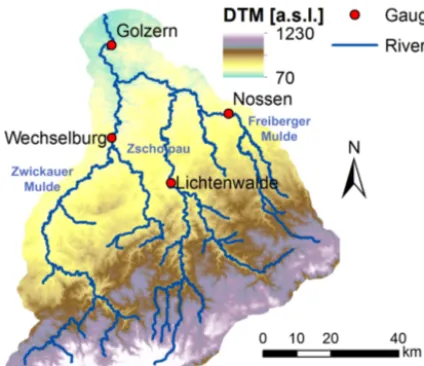
Figure 2.Position of gauging stations Wechselburg, Lichtenwalde and Nossen in the Mulde catchment.
two differing copula models. The case study illustrates the methodology for the Mulde catchment in eastern Germany, where the three streams Zwickauer Mulde, Zschopau and Freiburger Mulde merge (Fig. 2). We analysed the time se-ries from the respective gauging stations Wechselburg (area: 2107 km2), Lichtenwalde (1575 km2) and Nossen (585 km2) for the years 1926–2012. All peak discharges of simultane-ous flood events were selected if they exceeded the local 2.5-fold mean runoff. The maximum time differences allowed for peaks of adjoining catchments to be considered the same event was one day. The resulting trivariate sample consists of 178 flood events measured at the three sites. Their inter-dependent flood peaks exhibit strong correlations. The corre-sponding values of Pearson’sr, Spearman’sρand Kendall’st for the possible pairs confirm this (Table 1). This finding con-firms that simultaneous examination of the peak discharges is a useful exercise.
3.1 Determination of the univariate marginal distributions
In the next step, marginal distribution functions were esti-mated for the three univariate samples. The peak discharges at Wechselburg and Lichtenwalde were described by a log-Weibull distribution, those at Nossen by a generalized Ex-treme Value Distribution.
3.2 Selection of copulas
The fitting of several trivariate Archimedean copulas via the pseudo-likelihood method (Genest et al., 1995) showed the best goodness-of-fit for the Gumbel-Hougaard and Joe cop-ulas. Because of the better performance in the test of Genest and Rivest (1993), we finally chose the Joe-copula for the statistical model of coinciding flood events. The
superposi-Figure 3.Randomized trivariate samples of 1000 elements over-layed with the observed simultaneous peak values, 1st row: trivari-ate Joe-Copula, 2nd row: Pair-Copula (HQ stands for peak dis-charge).
tion of a copula-generated trivariate sample and the observed flood peaks in the first row of Fig. 3 shows that the choice of Joe-copula is justified. The scatter plot reproduces the shape of the measured data and their interdependencies. As can be seen from Eq. (4) we also need some bivariate copulas for es-timating multivariate return periods. Therefore, we reduced the 3-D-model to the three possible bivariate cases. The type of copula and the parameterisation were retained for consis-tency.
(m s ) (m s ) (m s ) (a) (a) (a)
Aug 2002 1000 1250 690 556 627 471
Aug 2010 521 136 54 26 26 6
June 2013 1010 774 312 257 274 172
3.3 Frequency analysis, evaluation and comparison of the results
Basin wide flood events always differ in the spatial distri-bution of the runoff contridistri-butions. Therefore, the multivari-ate probabilities differ, even if the runoff below the conflu-ence (here gauging station Golzern) is similar between flood events. Table 2 specifies the peak values of the last three ex-treme flood events in the river basin. This shows the rela-tions among the events and, by including the catchment ar-eas, the corresponding core area. So the event in August 2002 had its focus especially in the eastern part of the catchment whereas eight years later the focus was clearly in the west-ern part. Using both copula models we estimated the corre-sponding return periods. In addition, we determined the uni-variate return periods of the resulting runoff in Golzern by use of the official local gauge statistic. The table indicates that, overall, the multivariate return periods are higher than the univariate ones. This is because the copula models in-clude the probabilities of the individual catchments and their combination whereas the univariate statistics only relates to the total runoff downstream of the confluence. The spatial composition of the flood peaks are not part of the univari-ate distribution function. The flood event of August 2010 is a case in point. About 75 % of the total runoff originates in the catchment of the Zwickauer Mulde. This spatial heterogene-ity can not be considered in the univariate flood statistic for the gauge Golzern where the peak value was 697 m3s−1. As the spatial distribution of the flood-causing rainfall (and as a result of the runoff) was unusual, this event has a significantly smaller univariate than multivariate return period. The mul-tivariate return period considers the probability of the occur-rence of a certain combination of floods from different tribu-taries. Thus, the composition of this event has a smaller prob-ability than the peak which could result from several combi-nations. The composition or the spatial-temporal distribution
of the flood event in 2010 therefore affected the multivari-ate probability much stronger than the marginal distributions of peak discharges did. Accordingly, the multivariate return period of the peak values is almost four times the univariate return period of the aggregated discharge. With the exception of the 2002 flood event, both copula models give almost the same return periods.
This study shows that both multivariate copula approaches estimate very similar return periods. This indicates that both of them can be adopted for the multivariate statistical as-sessment of flood events in large river basins. Although the trivariate Joe-copula only has one parameter, it seems not to be worse than the pair-copula, at least not in this application. In addition, the effort of estimating the return periods via 3-D-Archimedean copula is minor. However, the pair-copula should provide better fits to the data because of its more de-tailed structure and because of considering conditional bi-variate dependencies. The copula-generated random samples in Fig. 3 demonstrate that this is the case. The scatter plots generated by the pair-copula show a less distinctive variation in the lower range than the 3-D-Joe-copula.
4 Summary and conclusions
varia-tion. The shape of the trivariate distribution seems to be re-produced more realistically. Flood design applications may benefit from this property.
References
Aas, K., Czado, C., Frigessi, A., and Bakken, H.: Pair-copula con-structions of multiple dependence, Insurance: Mathe. Econom., 44, 182–198, 2009.
Bedford, T. and Cooke, R. M.: Vines – a new graphical model for dependent random variables, The Annal. Stat., 30, 1031–1068, 2002.
Brechmann, E. C. and Schepsmeier, U.: Modeling Dependence with C- and D-Vine Copulas: The R Package CDVine, J. Stat. Softw., 52, 1–27, 2013.
Chen, L., Singh, V. P., Shenglian, G., Hao, Z., and Li, T.: Flood Co-incidence Risk Analysis Using Multivariate Copula Functions, J. Hydrol. Eng., 17, 742–755, 2012.
De Michele, C., Salvadori, G., Canossi, M., Petaccia, A., and Rosso, R.: Bivariate Statistical Approach to Check Adequacy of Dam Spillway, J. Hydrol. Eng., 10, 50–57, 2005.
Favre, A.-C., El Adlouni, S., Perreault, L., Thiemonge, N., and Bobée, B.: Multivariate hydrological frequency
anal-ysis using copulas, Water Resour. Res., 40, W01101,
doi:10.1029/2003WR002456, 2004.
Genest, C. and Rivest, L.-P.: Statistical Inference Procedures for Bivariate Archimedean Copulas, J. Am. Stat. Assoc., 88, 1034– 1043, 1993.
Genest, C., Ghoudi, K., and Rivest, L.-P.: A semiparametric estima-tion procedure of dependence parameters in multivariate families of distributions, Biometrika, 82, 543–552, 1995.
Ghizzoni, T., Roth, G., and Rudari, R.: Multivariate skew-t ap-proach to the design of accumulation risk scenarios for the flood-ing hazard, Adv. Water Resour., 33, 1243–1255, 2010.
Ghizzoni, T., Roth, G., and Rudari, R.: Multisite flooding hazard assessment in the Upper Mississippi River, J. Hydrol., 412–413, 101–113, 2012.
Joe, H.: Families of m-Variate Distributions with Given Margins and m(m-1)/2 Bivariate Dependence Parameters, Lecture Notes-Monograph Series (28), 120–141, 1996.
Joe, H.: Dependence Modeling with Copulas, Chapman & Hall/CRC, Boca Raton, Florida, 2014.
Kao, S.-C. and Chang, N.-B.: Copula-Based Flood Frequency Anal-ysis at Ungauged Basin Confluences: Nashville, Tennessee, J. Hydrol. Eng., 17, 790–799, 2012.
Nelsen, R. B.: An Introduction to Copulas, 2nd Edn., New York, NY Springer New York, 2006.
Sklar, A.: Fonctions de rèpartition à n dimensions et leurs marges, Publ. Inst. Stat. Univ. Paris (8), 229–231, 1959.