POINT-TO-POINT SPEED ENFORCEMENT: A CASE STUDY ON
DRIVERS’ SPEED BEHAVIOR IN TURKEY
Arzu Ilgaz1, Mehmet Saltan2
1 Akdeniz University, Building Works and Technical Head of Department, 07058 Antalya, Turkey 2 Suleyman Demirel University, Engineering and Architectural Faculty, Civil Engineering Department,
32260 Isparta, Turkey
Received 22 November 2017; accepted 29 March 2018
Abstract: A series of technologies based on information technology have been developed in the world under the name of İntelligent Transportation Systems which are based on advancing technology. The most common goals of Intelligent Transportation Systems are decreasing the speeding offences of drivers while increasing safety, capacity, harmony and comfort. Point-to-point (P2P) speed enforcement is a new and developed intelligent transportation system application with increasing popularity in highly motorized countries all over the world. The main task of the application was to measure the average speeds of motorized vehicles for traffic enforcement and speed control purposes. The objective of the study was to evaluate the speeding and violation behaviors on 11 different sections in the Akdeniz University campus located at the city of Antalya in Turkey in the direction of speed limits provided as 20, 30 and 50 km/h by way of only signs, warning and announcements without any penal sanctions. P2P speed enforcement was declared to the drivers prior to the application for measuring the 2 month average travel speeds of vehicles passing through the application sections which were then subject to an analysis. It has been observed as a result of the speeding study that the section preferences of drivers differ according to the different physical properties. The ratio of violating vehicles was 63.01%, whereas the ratio of vehicles that comply with the speed limits was 36.99%. Optimal speed limits and penal sanctions following the violations may be used for reaching a higher level of compliance to the speed limits.
Keywords: point-to-point speed enforcement, average speed, speed limit, Independent Sample t test.
1 Corresponding author: [email protected]
1. Introduction
Travelers consider different factors when selecting alternative routes or the type of transportation they will use and speed is among the primary concepts in traffic engineering for this purpose. The abilities of the drivers along with vehicle properties as well as the ratio of interventions from
positive impact with regard to economy and mobility. The significant decrease of travel time contributes to the development of national and regional economy (KGM, 2014). However, speeding is an important traffic safety problem in all section types (Christensen and Amundsen, 2005; KGM,
2014; Akpa et al., 2014). Driving at speeds
higher than the allowed speed increases the probability of getting involved in an accident (Christensen and Amundsen, 2005). Even though speeding is known as a behavior with high risk, it is a common behavior and is observed as a normal and socially acceptable behavior by majority of the drivers (Fleiter
et al., 2010; Bates et al., 2016). The culture of speeding is so settled that exceeding the speed limit is generally perceived as normal. Indeed, there are proofs that majority of the drivers consider speeding as the least severe of the traffic offences (Montella et al., 2014).
The importance of highway traffic safety is increasing every day in the world. Different countries use different speed enforcement systems for solving the problem of speeding in traffic. Police enforcement system using radar devices is among the most common systems used (Goldenbeld et al., 2005; Ilgaz and Saltan, 2017b). Speed control in Turkey in both the urban roads and express ways is generally carried out by way of radar (Sahin, 2004; Ilgaz and Saltan, 2017b). Vehicle spot speeds are measured at radar control locations where and a fine is imposed on the driver if the spot speeds exceed the speed limit. The driver may slow down if he/she is aware of the location where the radar control is made thus preventing the fine. Therefore, this system results in spot speed improvement only at and around the radar location. This improvement does not represent a certain road network and is not effective over long distances. Another
disadvantage of the current system is the requirement for large numbers of police staff, vehicles, time and resources (Bolcu, 2001; Aydın, 2009; Bates et al., 2016; Ilgaz and Saltan, 2017c). These applications cause the drivers to put forth inconsistent speeding behaviors as a result of which police efficiency is decreased and they cannot be evaluated equally and justly by the police. The objective of traffic control is to decrease the deaths and injuries due to traffic accidents rather than punishing the drivers (Acar, 2003; Bates et al., 2016). Application of the uninterrupted speed application with automation along an extended section is attained by way of P2P speed enforcement. Spot speed applications provide a system which may be effective for a spot with a known history of accidents, however P2P cameras have a more significant impact on the drivers since they are applied over a much longer section. Hence, the objective of P2P speed enforcement is to provide a sustainable speeding behavior and may be much more acceptable with regard to the public in comparison with other applications (Speed Check Services, 2006; 2009a; 2009b; Gil and Malenstein, 2007; Simcic, 2009; Australian
Transport Council, 2011; Cameron, et al.,
2011; Lynch et al., 2010; 2011; Soole et al.,
2012; 2013b; Høye, 2014; Montella et al.,
2015).
that the average number of “recorded accidents” on the campus was around 10 annually. These type of dangerous accidents in the campus should be prevented. Even though there are traffic signs in the campus which impose speed limits of “20, 30 and 50 km/h”, overspeeding vehicle intensity is still a significant issue in the campus despite the. Speed bumps are used for preventing overspeeding, but they also have their own disadvantages. Various parts of the vehicles may be damaged due to speed bumps (Pau and Angius, 2001). Mobile P2P speed enforcement was used in this study for examining the speeding behaviors of drivers with regard to section preference. The average speed values of the drivers were calculated on 11 sections in this method applied by making an announcement to the drivers about the system after which their speeding behaviors, speed limit violation and compliance behaviors were analyzed in accordance with different sections and different speed limits followed by suggestions for a greater compliance to the speed limits. The difference of this study with the applications used in our country is that data acquisition can be carried out at the desired location and time since license reading cameras were setup not on a fixed structure but on mobile vehicles. In the past, such applications were limited by expressway conditions; but, university campus sections have been used for the first time in this study.
2. Background
Many countries use speed management for increasing section safety. Enforcement of proper speed limits is the most fundamental
policy for this purpose (Cascetta et al.,
2011). Traffic regulatory signs are used for designating speed limits which can be enforced by way of legal regulations or traffic
signs. It is against the law in many countries to travel at speeds higher than those enforced by law (Roads and Traffic Authority, 2000; KGM, 2014; Ilgaz and Saltan, 2017b). Speed management in this manner has a weak spot; the efforts for increasing safety may turn out to be futile due to low compliance with speed limit. Thus, many European countries have started to apply new speed control methods for enhancing effectiveness. P2P speed enforcement measures the average travel speed of each vehicle passing through a section, thereby enabling the drivers to comply with the speed limit along the whole section. Automated tracking of all violations is carried out using such systems in countries where the vehicle owners are directly responsible thereby securing an accurate, cost effective and fair application (Townsend, 2006; Cascetta et al., 2011).
Brown-Esplain, 2005; Gil and Malenstein, 2007; Speed Check Services, 2007b; 2009a; 2009b; Young and Regan, 2007; Cameron, 2008; Koy and Benz, 2009; Simcic, 2009; Soole et al., 2012; 2013a; Montella et al.,
2015; Ilgaz and Saltan, 2017a). Images and violation data (e.g.: time, date, speed, etc.) are transferred to a central processing unit from the local processor via a communication network when the determined vehicle speed is above the legal speed limit for that section. A violation notice is then prepared for the verified violations whereas data for vehicles with no violation are deleted in a certain period of time (Gil and Malenstein, 2007;
Young and Regan, 2007; Soole et al., 2012;
2013a, Ilgaz and Saltan, 2017a). The high ratio of positive impact of the application on a series of speed criteria is put forth by way of studies carried out for evaluating the effects of P2P speed enforcement on vehicle speed. These criteria are: “average speeds, 85 percentile speeds, ratio of speeding vehicles, speed variance (Soole et al., 2012; Ilgaz and Saltan, 2017b).
Significant differences can be observed among driver behaviors when a comparison is made according to spot speed and P2P speed cameras. Each camera type has a different speed perception zone which determines the ‘effect zone’. P2P speed cameras have greater effect on the drivers since they are applied over a much longer section despite the fact that spot speed cameras make up a system that is effective at a certain location with known accident history (Speed Check Services, 2006; 2009a; 2009b; Gil and Malenstein, 2007; Simcic, 2009; Australian Transport Council, 2011; Cameron, et al., 2011; Lynch
et al., 2010; Soole et al., 2012; 2013b; Høye, 2014; Montella et al., 2015; Ilgaz and Saltan, 2017b). It has been put forth by Keenan
(2002) as a comment on the advantages of P2P speed technology that spot speed measurement cameras have effects specific to the field, but that the P2P enforcement application on drivers and their speeds creates an effect on longer distances even though it is visible only at the beginning and end of the section. Keenan (2002) also put forth the following: “majority of the observed drivers were around the spot speed camera zones and changed their behaviors near the cameras, suddenly stepped on the brakes 50 meters before the camera and also suddenly increased their speeds after passing by the camera. The most disquieting issue about this is that the accident statistics at zones of certain spot speed cameras have worsened since the installment of the cameras”. The possibility of surprising the drivers decreases when the policy for setting up the fixed camera zones in an apparent manner and placing advanced camera warning signs are taken into consideration
(Cameron, 2008; Cameron, et al., 2011;
Ilgaz and Saltan, 2017b). Therefore, sudden breaking behavior of drivers is eliminated by ASE when they see the camera and speeding up after they pass the camera thereby eliminating the risks involved (Cameron, et al., 2011; Lynch et al., 2010; Montella et al., 2012; 2015; Soole et al., 2012; 2013b; Ilgaz and Saltan, 2017b).
No data were indicating a positive impact of the application on vehicle speeds and accident rates were observed during a literature survey carried out despite the fact that studies evaluating the efficiency in speed management of an innovative approach such as P2P speed enforcement are insufficient (Simcic, 2009; Speed Check Services, 2009b; Australian Transport Council, 2011; Cascetta et al., 2012; Fleiter et al., 2013;
Saltan, 2017c). It is observed when proofs regarding the fact that other camera based speed applications (e.g. fixed and mobile spot speed cameras) result in field-specific behavior changes limited by their application areas are taken into consideration that more efficient results with regard to section safety may be attained with P2P speed cameras
(Champness et al., 2005; Ilgaz and Saltan,
2017c). These studies provide an indication of the efficiency of P2P speed enforcement. It was put forth by (Soole et al., 2013) that there is a requirement for further studies in this subject for improving the scientific content of evaluations. Currently, there is a limited number of studies examining the effects of P2P speed enforcement on traffic safety that have been published in peer reviewed journals (De Pauw et al., 2014; Ilgaz and Saltan, 2017c). (Soole et al., 2013) have also reported that evaluations should be carried out for determining the sufficiency and efficiency of the use of mobile P2P speed cameras. Since the application sufficiency in sections which induce temporary section
safety anxieties (e.g. roadwork fields with reduced speed limits) will be increased at a lower cost and in a more timely manner by the application of such systems in comparison with permanent systems (Soole
et al., 2013a).
3. Material and Method
3.1. Measurement Area and Sections
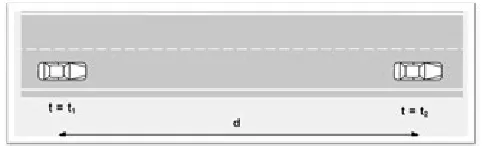
In this study, “average speed” can be defined as follows: “2 license reading cameras placed on two mobile passenger cars on the side of the road with a known distance between them records the time of passage of the vehicles. The “calculated average speed = d/(t2 –t1)” in this time of passage and the
distance of d (can range between 300 m up to dozens of kilometers) is the distance between two fixed license reading camera spots and the average speed is calculated by subtracting the first recorded time of passage (t1) from
the final recorded time of passage (t2) and
dividing it by the distance (d)” (Figure 1).
Fig. 1.
Average Speed Application System in the Study
A university campus was selected as a pilot area for the study. There is a large number of drivers who enter and exit such areas regularly and therefore, average speed measurements can be carried out more than once for the same vehicles. Data continuity is thus ensured in this manner. Traffic flow pre-study for the pilot region was used for
deciding on which sections the system would be used on. The following issues were taken into consideration for deciding on the test sections:
Department, the location and times of the accidents in the campus that occur red due to speed ing were determined, examinations were carried at the site in detail and the sections with a high tendency of speeding in the campus were determined;
b. A pre-study was carried out in order to determine the sections that the vehicles prefer in morning and evening traffic as they enter and exit the pilot region;
c. Intersections were avoided in the application corridor; attention was given in order to ensure that those which could not be avoided were minor intersections with low entry/exit volume.
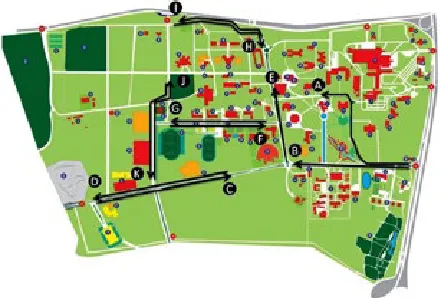
11 different sections (Figure 2) with varying lengths where Mobile P2P speed enforcement was applied and the applied speed limit values 20, 30 and 50 km/h (Table 1).
Fig. 2.
11 Sections from where Data were Acquired Source: (Ilgaz and Saltan, 2017a; 2017b; 2017c)
Table 1
Physical and Geometrical Properties of the Sections from where Data were Acquired
Section Length (m) Speed limit (km/h)
Number of lanes 1st spot 2nd spot
1 Lane width (m) 1st spot 2nd spot
Number of intersections
Number of horizontal
curbs
Number of speed bumps
A 908 30 2 1 3.50 3.50 4 2 3
B 717 30 2 2 3.50 3.50 3 - 3
C 890 50 2 2 3.50 3.50 1 - 1
D 890 50 2 2 3.50 3.50 2 - 1
E 425 30 2 2 3.50 3.50 2 - 2
F 600 20 2 2 3.00 3.00 - -
-G 600 20 2 2 3.00 3.00 - -
-H 615 30 1 2 3.50 3.50 3 2 1
I 594 30 2 1 3.50 3.50 3 2
-J 695 30 2 1 3.50 3.50 2 2
-K 695 30 1 2 3.50 3.50 2 2
3.2. Installed Mobile System
A total of two measurement (passenger) vehicles were used and the required measurement and recording devices were placed on the trunks of these vehicles. Since the height of the camera from the ground does not
hinder the line of sight of the license readings (in order to ensure that the license readings are clear), this installation system was approved. The cameras were hidden in the camera casings for providing safety against various weather conditions or anticipated unauthorized interventions or vandalism (Figure 3).
Fig. 3.
Vehicle Mounted P2P Speed Camera
3.3. Data Acquisition
E-mail system was used twice for delivering the announcements related with the application of the system during the dates of 09.04.2013 - 30.05.2013 to the university personnel and students; a total of 3 banners were placed at campus entrances while leaflets were also handed out to vehicles entering the campus. The spring semester was selected as the study period. Since there were no holidays during these periods, no accidents or road work that took place on the sections and since the weather conditions were fine, the selected dates were considered as the best. License readings and average speed detection was carried out for 5 days per week via cameras during 08:00-18:00 for a total of 2 months after the announcement of the parked system was made. The system
operates by detecting the license plates of the vehicles by way of uninterrupted video flow method and by uploading the photographs and data to the central server.
3.4. Method
4. Results
4.1. Average Speed Findings
The number of vehicles for which average speeds were measured using the mobile
system in 11 different sections within the scope of the study was 21089.
The sections included in the study and the number of vehicles have been presented as below:
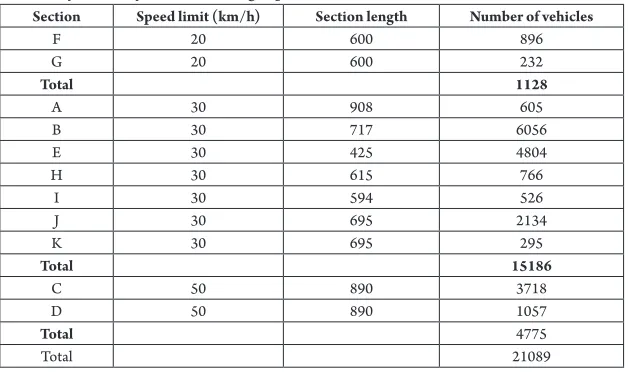
Table 2
Number of Vehicles for which Average Speeds were Detected
Section Speed limit (km/h) Section length Number of vehicles
F 20 600 896
G 20 600 232
Total 1128
A 30 908 605
B 30 717 6056
E 30 425 4804
H 30 615 766
I 30 594 526
J 30 695 2134
K 30 695 295
Total 15186
C 50 890 3718
D 50 890 1057
Total 4775
Total 21089
Measurement data can be seen in Table 3. Because the system is in a university campus, different traffic flow states do not occur. The flow rate changes between 0-10 vehicles per minute per lane whereas vehicle speed varies between 10 ~90 km/h. The average speeds of drivers were in accordance with speed limits in sections A, C and D among sections with different speed limits of 20, 30 and 50 km/h. Speed averages for the F and G sections were those that exceeded the speed limit in the highest ratio. Each section with a speed limit of 30 km/h had a different average speed and it was observed that only the speed average of section A was in accordance with the speed limits. The
Table 3
Speed Data Acquired from Mobile System Measurement
Section Speed limit (km/h) Section length Number of vehicles Vehicle % Average speed(km/h) Standard deviation
F 20 600 896 3.96 45.99 12.34
G 600 232 1.03 4 4.37 10.82
Total 1128 4.99 45.66 12.06
A 30 908 605 2.67 28.51 6.01
B 717 6056 26.76 31.81 7.15
E 425 4804 21.23 31.14 7.76
H 615 766 3.39 36.12 7.59
I 594 526 2.32 41.82 8.11
J 695 2134 9.43 42.32 7.44
K 695 295 1.30 39.81 6.76
Total 15186 67.11 33.66 8.55
C 50 890 3718 16.43 49.44 10.01
D 890 1057 4.67 49.30 9.82
Total 4775 21.10 49.41 9,97
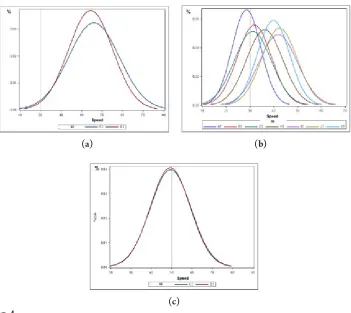
Figure 4 shows the average speed distribution % graphs obtained via Mobile P2P speed cameras. Even though the speed limit application was declared to the drivers beforehand, the vehicles did not comply with the 20 km/h average speed limit in sections F and G (Figure 4). The average speed of majority of drivers in section G (84%) varied between 31-60 km/h, whereas the average speed for 89% of section F ranged between 21-40 km/h. Majority of drivers in sections B and E drove at average speeds varying between 26~40 km/h and those in section H drove at average speeds ranging between 31~40 km/h whereas drivers in section A h drove in compliance with the speed limits with a speed limit of 30 km/h. Sections I, J and K were those where average speed limit was violated. It has been put forth as a result for driver behavior to comply with the 30 km/h speed limit varies from section
(a) (b)
(c) Fig. 4.
Average Speed Distribution %’s for all Sections; (a) Sections F and G; (b) Sections A, B, E, H, I, J, K; (c) Sections C and D
4.2. Average Speed Analysis for all
Violating and Non-Violating Drivers
Table 4 shows the findings with regard to violation states for the measurements announced to the drivers carried out by the mobile system at 11 different sections. Whereas 63.01% of the vehicles in all sections violate the speed limits,
Table 4
Average Speed Findings with Regard to Violation States
Violating Complying
Section Speed limit (km/h) Vehicle % Speed average (km/h)) Vehicle % Speed average (km/h)
F 20 4.11 47.00 0.14 16.63
G 1.07 45.36 0.03 12.71
Total 5.18 0.17
A 30 1.07 33.88 1.80 25.33
B 17.98 36.06 10.74 24.69
E 12.89 36.58 9.89 24.05
H 2.93 38.80 0.70 24.92
I 2.33 43.05 0.16 24.06
J 9.55 43.38 0.57 24.83
K 1.26 41.21 0.14 27.47
Total 48.01 24.01
C 50 7.62 58.13 10.01 42.82
D 2.21 57.83 2.80 42.58
Total 9.83 12.81
Total 63.01 36.99
In the light of the data of Table 4, Independent Samples t test was performed for examining if there are any differences between the average speeds of violating drivers and the drivers who comply with the speed limits announced for the 11 sections. The results have been shown in Table 5. A statistically significant difference
was observed between the averages of the average speeds of drivers who violate and those who comply with the speed limits
in each section in the 2nd Stage upon a
consideration of the p values for the A, B, C, D, E, F, G, H, I, J, K sections since all the determined values are below the 0.05 level of significance.
Table 5
t Tests for Average Speed Measurements with Regard to the States of Violation of Drivers for Each Section
Violation Section Speed limit(km/h) Number of vehicles Average speed(km/h) DeviationStandard t P
Yes A 30 225 33.88 2.94 23.24 <.0001
No 380 25.33 5.03
Yes B 30 3792 36.06 4.20 93.49 <.0001
No 2264 24.69 5.15
Yes C 50 1608 58.13 6.15 70.75 <.0001
No 2110 42.82 6.82
Yes D 50 466 57.83 5.31 39.30 <.0001
No 591 42.58 6.92
Yes E 30 2719 36.58 4.70 92.64 <.0001
No 2085 24.05 4.58
Yes F 20 866 47.00 11.24 14.77 <.0001
No 30 16.63 3.25
Yes G 20 225 45.36 9.38 9.17 <.0001
No 7 12.71 3.45
Yes H 30 618 38.80 5.25 28.91 <.0001
No 148 24.92 5.22
Yes I 30 492 43.05 6.65 16.13 <.0001
No 34 24.06 6.38
Yes J 30 2013 43.38 6.09 32.55 <.0001
No 121 24.83 6.04
Yes K 30 265 41.21 5.52 13.36 <.0001
5. Conclusion
The speed averages of the sections F and G with a speed limit of 20 km/h are those which have exceeded the speed limit in the highest ratio. There are no intersections and speed bumps on these sections due to the fact that these sections have alignment geometric properties and thus there is no speed limitation due to vehicles making a turn or vehicles that enter from the side or due to inspections. Moreover, it is considered that the speed limits in sections F and G are not observed as reasonable by the drivers and that there is a necessity for an optimal speed arrangement. Whereas the speed average of section A with a speed limit of 30 km/h was below the speed limit indicating that speed limits are complied. Speed limit announcements were observed to be more effective in this section in comparison with others. In addition, section A is located very close to the faculty settlement areas and includes pedestrian crossing within the scope of “pedestrian priority road” application. Drivers are considered to drive at average speeds close to the speed limit due to the attributes of this application. Average speed values and speed distributions vary in each section with the same speed limit (30 km/h). It is thought that the speed limit feeling instilled in the drivers by the different physical attributes of these sections is effective.
It was determined as a result of the study that whereas 63.01% of the vehicles in all sections violate the speed limit, 36.99% comply with the speed limit and a statistically significant difference between these two types of drivers. Even though the applied system is announced to the drivers, it was realized that traffic safety is not sufficient in the campus road network. A higher compliance ratio to
the speed limits may be attained by way of a better enforcement sanction. In addition, it is thought that the speed limits in some sections are not considered to be reasonable from the perspectives of drivers and that there is a need for optimal speed limit arrangement. The issue that should be taken into consideration for speed limit arrangement is that the sections are inside a university campus and so the arrangement to be made should not endanger pedestrian safety.
Acknowledgements
T h is work is a pa r t of t he Project 2011010102007 “Application of the Mobile Automatic Plate Recognition System to the Akdeniz University Campus Against High Speed Problem and Evaluation of Effectiveness”, which is financed by the Akdeniz University Scientific Research Projects Management Unit.
References
Acar, N. 2003. The Impact of Excessive Speed on Traffic Accidents, Police Journal of the Era 2(21): 10–11. Available from internet: <http://www.caginpolisi.com.tr/asiri-hizin-trafik-kazalarina-etkisi/>
Akpa, N.E.E.; Booysen, M.J.; Sinclair, M. 2014. The Impact of Average Speed Over Distance (ASOD) Systems on Speeding Patterns Along the R61. In Proceedings of The First International Conference on the Use of Mobile Informations and Communication Technology (ICT) in Africa UMICTA, 78-82.
Bates, L.; Allen, S.; Watson, B. 2016. The influence of the elements of procedural justice and speed camera enforcement on young novice driver self-reported speeding, Accident Analysis & Prevention 92: 34-42. Bolcu, A. 2001. Traffic Safety, Police Journal of the Era
2. Available from internet: <http://www.caginpolisi. com.tr/trafik-guvenligi/>
Cameron, M. 2008. Development of Strategies for Best Practice in Speed Enforcement in Western Australia. Available from internet: < http://www.monash.edu/__ data/assets/pdf_file/0005/216590/muarc277.pdf>. Cameron, M.H.; Diamantopoulou, K.; Clark, B.; Langford, J. 2011. Identifying Traffic Enforcement Practices and Opportunities in Western Australia. Available from internet: <http://c-marc.curtin.edu. au/local/docs/ITEPOWA_March2012.pdf>. Cascetta, E.; Punzo, V.; Bonnel, P. 2012. Impact on vehicle speeds and pollutant emissions of an automated section speed enforcement system on the Naples urban motorway. In Proceedings of the19th ITS World Congress Vienna. 27p.
Cascetta, E.; Punzo, V.; Montanino, M. 2011. Empirical evidence of speed management effects on traffic flow at freeway bottleneck, Annual Meeting of the Transportation Research Board, 83-93.
Champness, P.; Sheehan, M.; Folkman, L.M. 2005. Time and Distance Halo Effects of an Overtly Deployed Mobile Speed Camera. In Proceedings of the Australasian Road Safety Research, Policing and Education Conference, 10 p. De Pauw, E.; Daniels, S.; Brijs, T.; Hermans, E.; Wets, G. 2014. Automated section speed control on motorways: An evaluation of the effect on driving speed, Accident Analysis & Prevention 73: 313–322.
Christensen, P.; Amundsen, A.H. 2005. Speed and Road Accidents: an Evaluation of the Power Model. Nordic Road and Transport Research, 17(1): 9-11.
Fleiter, J.; Lewis, I.; Watson, B. 2013. Promoting a More Positive Traffic Safety Culture in Australia : Lessons Learnt and Future Directions. Journal of the Australasian College of Road Safety 25(1): 27-35.
Fleiter, J.; Lennon, A.; Watson, B. 2010. How Do Other People Influence Your Driving Speed? Exploring the ‘Who’ and the ‘How’ of Social Influences on Speeding from a Qualitative Perspective, Transportation Research Part F: Traffic Psychology and Behaviour 13(1): 49–62. Gil M.J.M.; Malenstein U.P.M.J. 2007. Innovative Technology for Monitoring Traffic, Vehicles and Drivers, Police Enforcement Policy and Programmes on European Roads. 6th Framework Programme, European Commission, Technical Report, 163p.
Goldenbeld, C.; Van Schagen, I. 2005. The effects of speed enforcement with mobile radar on speed and accidents: An evaluation study on rural roads in the Dutch province Friesland, Accident Analysis & Prevention
37(6): 1135-1144.
Høye, A. 2014. Speed cameras, section control, and kangaroo jumps–a meta-analysis, Accident Analysis & Prevention 73: 200–208.
Ilgaz, A.; Saltan, M. 2017a. Situatins Affecting The Effectiveness Of Average Speed Enforcement: A Study On Speed Behavior Of Drivers, SDU International Journal of Technological Sciences 9(2): 23–38.
Ilgaz, A.; Saltan, M. 2017c. An Evaluation of Section Control: Analyses of Speed Behavior of Drivers at a University Campus, International Journal for Traffic and Transport Engineering 7(4): 461-474.
KGM. 2014. Speed on Highways, KGM. Available f r o m i n t e r n e t : < h t t p://w w w. k g m . g o v. t r/ SiteCollectionDocuments/KGMdocuments/Yayinlar/ YayinPdf/karayollarindaHiz.pdf>.
Koy, T.; Benz, S. 2009. Automatic Time-Over-Distance Speed Checks Impacts on Driving Behavior and Traffic Safety. In Proceedings of the 6th ITS World Congress and Exhibition on Intelligent Transport Systems and Services, 7 p.
Lynch, M.; White, M.; Napier, R. 2011. Investigation into the use of Point-to-Point Speed Cameras, NZ Transport Agency Research Report 465, 66p.
Montella, A.; Imbriani, L.L.; Marzano, V.; Mauriello, F. 2014. Effects on speed and safety of point-to-point speed enforcement systems: Evaluation on the urban motorway A56 Tangenziale di Napoli, Accident Analysis & Prevention 75: 164–178.
Montella, A.; Persaud, B.; D’Apuzzo, M.; Imbriani, L.L. 2012. Safety evaluation of an automated section speed enforcement system, Transportation Research Record: Journal of the Transportation Research Board 2281: 16-25. Montella, A.; Punzo, V.; Chiaradonna, S.; Mauriello, F.; Montanino, M. 2015. Point-to-point speed enforcement systems: Speed limits design criteria and analysis of drivers’ compliance, Transportation research part C: emerging technologies 53: 1–18.
Pau, M.; Angius, S. 2001. Do speed bumps really decrease traffic speed? An Italian experience, Accident Analysis & Prevention 33(5): 585–597.
Roads and Traffic Authority. 2000. Speed Problem Definition and Countermeasure Summary. Roads and Traffic Authorityof New South Wales, 44p.
Roberts, C.A.; Brown-Esplain, J. 2005. Technical Evaluation of Photo Speed Enforcement for Freeways. 117 p. Available from internet: <https://apps.azdot. gov/ADOTLibrary/publications/project_reports/ PDF/AZ596.pdf>.
Sahin, Ö. 2004. Applicability of automatic video-radar systems in speed control. PhD Thesis, Fen Bilimleri Enstitüsü, Süleyman Demirel Üniversitesi, Isparta, Turkey, 97p. Simcic, G. 2009. Section Control: Towards a More Efficient and Better Accepted Enforcement of Speed Limits? European Transport Safety Council Publisher (ETSC), 5p. Available from internet: <http://www. roadsafetyobservatory.com/Evidence/Details/10715>. Soole, D.W.; Fleiter, J.; Watson, B. 2012. Point-to-Point Speed Enforcement (No. AP-R415/12). 165p. Available from internet: <https://trid.trb.org/view. aspx?id=1218564>.
Soole, D.W.; Watson, B.C.; Fleiter, J.J. 2013a. Effects of average speed enforcement on speed compliance and crashes: A review of the literature, Accident Analysis & Prevention 54: 46–56.
Soole, DW., Fleiter, Judy J., Watson, Barry C. 2013b. Point-to-Point Speed Enforcement: Recommendations for Better Practice. In Proceedings of theAustralasian Road Safety Research Policing and Education Conference, 11p. Taylor, M.C.; Lynam, D.A.; Baruya, A. 2000. The Effects of Drivers’ Speed on the Frequency of Road Accidents. Crowthorne: Transport Research Laboratory, 50p. Townsend, E.; Achterberg, F. 2006. Enforcement Monitor (No. 6). Brussels, Belgium: ETSC.