A Comparison Of Delivery Formats
To Encourage Student-Centered Learning
In A Power Engineering Technology Course
Mathew J. Turner, Purdue University, USA Rustin D. Webster, Purdue University, USA
ABSTRACT
This paper describes a student-centered approach to a power engineering technology course using the flipped or inverted classroom as well as active learning in the form of group discussions and team problem solving. The study compares student performance and perceptions of a traditional, teaching-centered classroom to two different flipped courses: one using video lectures and one using a media-enhanced electronic textbook. The authors compared courses in the areas of 1) student performance on multiple choice and numerical analysis problems, 2) students’ perceptions of course delivery format and satisfaction with the course and instructor, and 3) technical content coverage. Results show little difference in student achievement between the course formats, strong negative reactions by students to unfamiliar instructional methods, and little difference in content coverage. The authors believe that the outcomes of this study can be attributed to the benefits of small class sizes (n<12), which naturally enable active learning to be utilized without the need for rigid and formal course structure,
Keywords: Active Learning; Flipped Classroom; Problem Solving; Engineering Technology
1. INTRODUCTION
raditionally, a teaching-centered paradigm has framed science, technology, engineering, and math (STEM) education in which instructors who are subject matter experts transfer knowledge to note-taking students via lecture, (i.e., content delivery is the dominant element of instruction). Pratt (1992) refers to this as the “Engineering Conception” in which teachers possess the knowledge that learners need, and teaching is the process of identifying the most efficient means of achieving a set of predetermined content-related goals. Kember and Gow (1994) refer to this paradigm as “Knowledge Transmission” and identify the dominant characteristic as the view that expertise in the discipline is the prime requirement for an academic and the role of a teacher is to impart information as clearly and accurately as possible. This conception is particularly dominant in fields with well-defined content or skills to be taught (Pratt, 1992), and is often characterized by the use of educational media such as overhead transparencies and a focus on “class preparation” of instructional materials (Kember & Gow, 1994).
sections and that students enrolled in classes using traditional lecture are 1.5 times more likely to fail than students enrolled in classes using active learning, with an increased effect for small class sizes. This preponderance of evidence has led Strevler and Menekse (2017) to argue that active learning has been broadly proven effective in STEM disciplines, and it is now important to develop a “more nuanced view of active learning” that enables teachers to better design instruction to match activities to the importance and difficulty of learning outcomes.
The aim of this work is to respond to the call to action by Strevler and Menekse (2017) by addressing what Prince (2004) refers to as the “prevalent tyranny that encourages faculty to push through as much material as possible in a given session” (p. 229) (i.e., the competing interests of content coverage and evidence-based instructional methods). A similar sentiment was made by Cavalli, Neubert, McNally, and Jacklitch-Kuiken (2014) “The most significant obstacle to using these techniques (active learning) is the loss of lecture time resulting in a loss in the amount of material that can be covered in class.” (p. 1). To do so we present a research study of three different course delivery formats in an engineering technology power systems course: a teaching-centered lecture-based format, and two learning-centered formats, both utilizing group discussion and team problem solving: one using the flipped course format (Bishop & Verleger, 2013; Mason, Shuman, & Cook, 2013) and one using a novel electronic textbook augmented with video segments. The goals of this consecutive three-year research study were:
1. Compare the effect of different course paradigms on student achievement via comparison of student performance on multiple assessment types.
2. Assess student perceptions of the different course paradigms via comparison of end-of-semester course evaluations of both the teaching and the course.
3. Compare the content coverage of the three formats.
2. STUDY METHOD
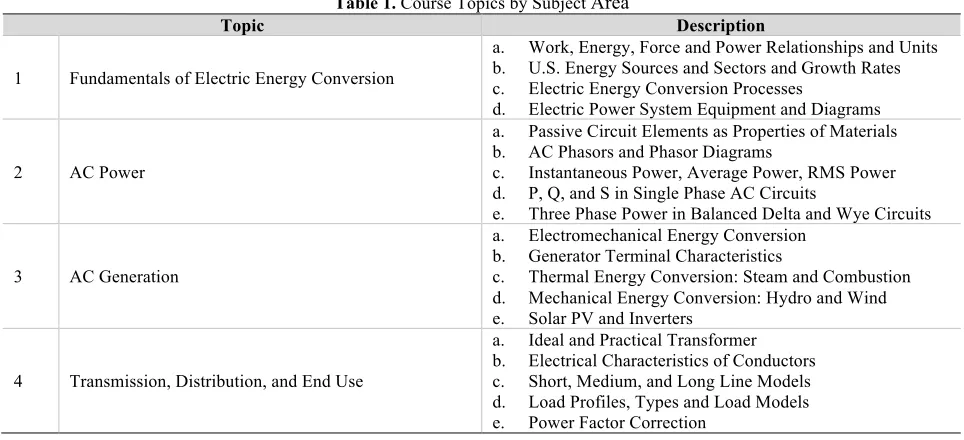
The study was performed on an introductory electric power systems course required of all sophomores in the fourth semester of an Electrical and Computer Engineering Technology (ECET) program. Table 1 summarizes the major instructional objectives of the course.
Table 1. Course Topics by Subject Area
Topic Description
1 Fundamentals of Electric Energy Conversion
a. Work, Energy, Force and Power Relationships and Units b. U.S. Energy Sources and Sectors and Growth Rates c. Electric Energy Conversion Processes
d. Electric Power System Equipment and Diagrams
2 AC Power
a. Passive Circuit Elements as Properties of Materials b. AC Phasors and Phasor Diagrams
c. Instantaneous Power, Average Power, RMS Power d. P, Q, and S in Single Phase AC Circuits
e. Three Phase Power in Balanced Delta and Wye Circuits
3 AC Generation
a. Electromechanical Energy Conversion b. Generator Terminal Characteristics
c. Thermal Energy Conversion: Steam and Combustion d. Mechanical Energy Conversion: Hydro and Wind e. Solar PV and Inverters
4 Transmission, Distribution, and End Use
video component replaced by an electronic textbook augmented with short video segments (media enhanced e-text): Flipped Course Text (FCT). The same instructor delivered all three offerings, covered the same material in the same sequence, and at approximately the same time during the semester. The major assessments in the three courses were also the same: weekly online multiple-choice quizzes, bi-weekly quizzes covering the homework assignments, a cumulative final exam, and laboratory reports. The learning-centered courses utilized an additional assessment method involving group discussions and team-based problem solving.
2.1 Traditional Course
In the TC group, used a format common to many engineering and engineering technology classes: two weekly 50-minutes lectures delivered by the instructor and one 110-minute lab session per week, proctored by the instructor. Lectures consisted of PowerPoint presentations delivered via a tablet computer. The instructor annotated the presentation slides during the lecture as well as used to present and solve textbook style numerical analysis problems. Students were provided redacted copies of the presentations for notes taking, resulting in students copying content as it was presented to them. The instructor would solicit class participation during the lecture, however in an unstructured format and without the students having an opportunity to interact with and synthesize the information in advance.
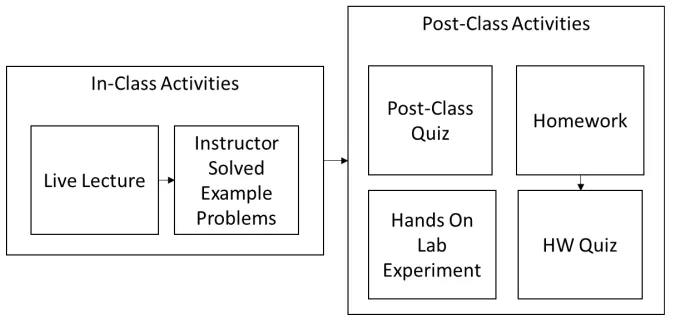
After each lecture, students used an online tool (i.e., BlackBoard) to complete a randomized multiple-choice quiz. An example multiple choice question related to topic 3a is “In a synchronous generator, the angle between the excitation voltage and terminal voltage is called the: A. Phase angle, B. Voltage angle, C. Power angle, or D. Excitation angle.” BlackBoard automatically graded the quizzes, and feedback was instantaneously presented to each student on their performance. Once or twice per topic from Table 1, students completed a homework consisting of numerical analysis-type problems, with complete written solutions available to the students. An example numerical question related to electromechanical energy conversion is “A 3-phase, Y-connected synchronous generator has synchronous reactance of 15Ω per phase, and negligible armature resistance. The generator is rated at 15MVA and 13.8kV. Determine the excitation voltage necessary to deliver rated voltage to a 10MVA, 0.9 pf lagging load.” Student took an in-class homework quiz one week after each homework assignment, using the same question format as the homework. Additionally, several hands-on, hardware based labs were performed during each topic group. Figure 1 summarizes the TC class structure. At the end of the course, students took a cumulative in-class final exam.
2.2 Flipped Course with Video
In the FCV group, the instructor taught the course using a flipped course method where the primary means of disseminating content was video lectures created by the instructor. Before each class, students viewed video playlists consisting of between three and five videos, each lasting 10 to 15 minutes, and based on the same presentations created for the traditional course implementation. Videos used a picture-in-picture format such that both the presentation with annotations and the lecturer were easily view-able. After viewing a video, students used BlackBoard to complete similar multiple-choice quizzes as utilized in the TC format. Additionally, students were provided a list of one to three qualitative discussion questions and one or two numerical analysis problems. An example discussion question related to topic 3a, electromechanical energy conversion, is “Explain how a synchronous generator’s output changes in response to changes in real and reactive power required by an electrical load. What control actions can be taken to maintain steady state terminal conditions in response to changes in P and Q?” The numerical analysis questions utilized were of the same format as those utilized in the TC format. After viewing the videos, students independently formulated answers to the discussion question in preparation for class-time and to outline a solution method for solving the numerical problems.
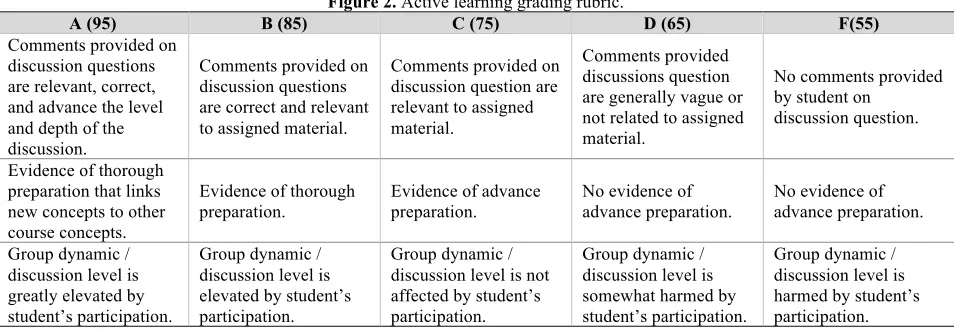
The FCV course met twice weekly for 105-minute hybrid lecture-lab classes. The majority of in-class time used two active learning techniques: group discussions and team problem solving. The instructor moderated group discussions using an open response format to the previously assigned discussion questions. For a given question, students would present their response, with no input from the instructor. Other students would then comment on the accuracy and completeness of the provided answer, with the instructor acting as moderator. Students then worked in teams to solve numerical analysis problems like those presented in the video lectures. During this time, the instructor would observe each team, evaluating their pre-class preparation and providing individualized instruction as necessary. After having a sufficient time to solve the numerical problem, student teams would present their solution. The entire class then analyzed the solution method, with the instructor providing guidance and asking clarifying questions. The instructor graded student’s overall participation in active learning sections using the rubric included in Figure 2. Additionally, students could increase their active learning scores via increased participation in group discussions (i.e., answering more discussion questions or more frequent contribution to numeric solution analysis) . Post-class activities and final exam were the same as in the TC offering, with the exception that the post-class review quiz was replaced with a pre-class quiz. Figure 3 summarizes the FCV class structure.
Figure 2. Active learning grading rubric.
A (95) B (85) C (75) D (65) F(55)
Comments provided on discussion questions are relevant, correct, and advance the level and depth of the discussion.
Comments provided on discussion questions are correct and relevant to assigned material.
Comments provided on discussion question are relevant to assigned material.
Comments provided discussions question are generally vague or not related to assigned material.
No comments provided by student on
discussion question.
Evidence of thorough preparation that links new concepts to other course concepts.
Evidence of thorough preparation.
Evidence of advance preparation.
No evidence of advance preparation.
No evidence of advance preparation.
Group dynamic / discussion level is greatly elevated by student’s participation.
Group dynamic / discussion level is elevated by student’s participation.
Group dynamic / discussion level is not affected by student’s participation.
Group dynamic / discussion level is somewhat harmed by student’s participation.
Figure 3. Flipped course with video lecture format.
2.3 Flipped Course with Media Enhanced E-text
In the FCT group, the instructor taught the course using the flipped course method where the primary means of disseminating course content was a custom developed media enhanced e-text with assigned readings done prior to class time. The instructor augmented the textbook by including hyperlinks to videos of the instructor explaining and solving numerical analysis problems. For this course, the instructor converted the lecture notes from the previous two course offering into a textbook, with worked examples converted into YouTube videos. Otherwise, the course operated as describe in the FCV section. The FCT class structure can therefore be viewed as replacing the “Lecture Video” block in Figure 3 with a “Reading and Viewing” block.
3. EVALUATION
Assessment of the course paradigms was performed by comparing the TC, FCV, and FCT courses using the following metrics: overall course grade, multiple choice quiz grades overall and by topic, numerical analysis problem (homework quizzes and final exam) grades overall and by topic; and departmental issued end of semester course evaluations. For the FCV and FCT courses, the researchers made additional comparisons using an instructor created end of semester survey.
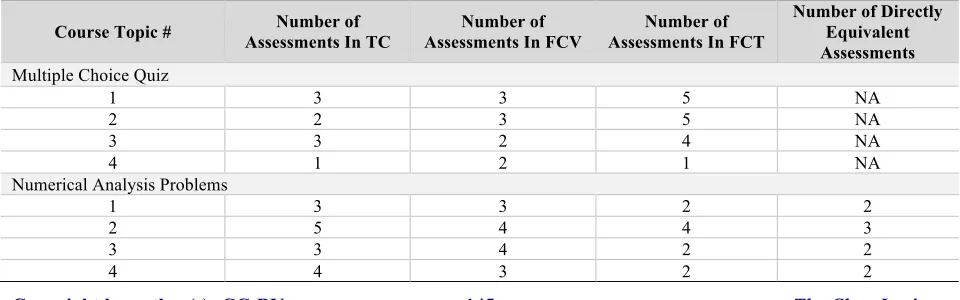
Additionally, the researchers performed an additional review and elimination procedure on the numerical analysis problems in the three offerings. This procedure identified problems that were directly equivalent (i.e., were similar across the three offerings in that they covered the same course topic, utilized a similar format, and were offered at a similar time in the course sequence). Additional analysis was then performed on these directly equivalent questions. Table 2 summarizes the number of assessments retained in each course offering by course topic (referred to Table 1) and assessment type.
Table 2. Quantitative Course Assessments by Course Implementation and Category
Course Topic # Assessments In TC Number of Assessments In FCV Number of Assessments In FCT Number of Number of Directly Equivalent Assessments
Multiple Choice Quiz
1 3 3 5 NA
2 2 3 5 NA
3 3 2 4 NA
4 1 2 1 NA
Numerical Analysis Problems
1 3 3 2 2
2 5 4 4 3
3 3 4 2 2
In all cases, the researchers made comparisons using an independent t-test between the TC course and the flipped courses. Levene’s Test for Equality of Variance was used to determine the homogeneity of the variance between the samples, and a bootstrapping procedure was applied for those samples with F(df1, df2) < 0.05. Additionally, for all
comparisons, the effect size between the manipulation and the assessment was calculated using Cohen’s d.
This study did not compare between student achievement on the active learning tasks in the FCV and FCT. Grading Active Learning via rubric-based assessment is an inherently subjective process. Since the FCV was the instructor’s first utilization of the active learning techniques, consistency in assessment between the two sections could not be verified.
3.1 Group Demographics
Overall, 27 students participate in the research study (N=27). The TC group consisted of 13 students, all male, all between the ages of 18 and 22. 100% of the sample consisted of sophomores (between 30 and 60 credit hours successfully completed). One student was eliminated from the study group due to non-completion of the course (TC n=12). The FCV group consisted of seven students (n=7), with the same demographics as the TC group. The FCT group consisted of eight students (n=8), with the same demographics as the TC group.
3.2 Overall Student Performance
The researchers compared overall student performance in the three course offerings via evaluation of final course grades using two different independent-sample t-tests: one comparing TC and FCV, and one comparing TC and FCT. On average, participants in the FCV format performed worse (M=63.4, SE=5.7) than those in the TC format (M=77.7, SE =3.0). This difference, 14.1%, BCa 95% CI [20.5%, 26.6%] was significant t(17) =1.79, p=0.025, representing a large effect, d=0.88. On average, participants in the FCT format performed worse (M=73.8, SE=4.0) than those in the TC format (M=77.7, SE=3.0). However, this difference, 3.9%, BCa 95% CI [-6.45%, 14.2%] was not significant t(18)=0.788, p =0.441, and the effect size calculated, d=0.38, was small to medium. However, overall grades in the TC course is not directly comparable to those in the FCV and FCT courses do to the impact of the active learning grades.
3.3 Student Performance on Multiple Choice Quizzes
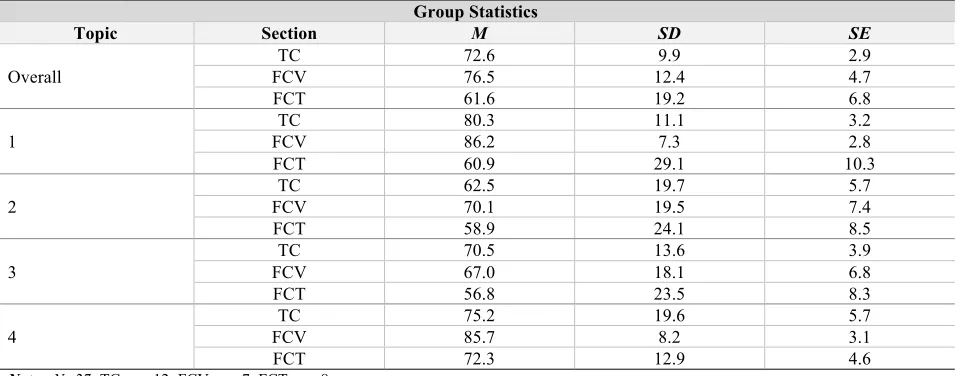
To compare student performance on the multiple choice quizzes, the researchers calculated an average score for each student for all multiple-choice quizzes and by each course topic. Ten independent sample t-tests were then performed: two comparing student averages on all multiple-choice assessments, and eight comparing student averages per course topic. Tables 3, 4, and 5 report these results.
Table 3. Comparison of Descriptive Statistics for Multiple Choice Questions across Course Implementations.
Group Statistics
Topic Section M SD SE
Overall
TC 72.6 9.9 2.9
FCV 76.5 12.4 4.7
FCT 61.6 19.2 6.8
1
TC 80.3 11.1 3.2
FCV 86.2 7.3 2.8
FCT 60.9 29.1 10.3
2
TC 62.5 19.7 5.7
FCV 70.1 19.5 7.4
FCT 58.9 24.1 8.5
3
TC 70.5 13.6 3.9
FCV 67.0 18.1 6.8
FCT 56.8 23.5 8.3
4
TC 75.2 19.6 5.7
FCV 85.7 8.2 3.1
FCT 72.3 12.9 4.6
Notes. N=27; TC, n = 12; FCV, n = 7; FCT, n = 8
Table 4. Comparison of TC and FCV Performance on Multiple Choice Tests, Overall and by Course Topic.
t-test for Equality of Means
Topic Mean Difference (%) BCa 95% CI t(df) Sig (p) Effect Size (d)
Overall -3.9 [-14.8,7.0] t(17)=-0.753 0.462 -0.39
1 -5.9 [-15.9,14.1] t(17)=-1.248 0.229 -0.53
2 -7.6 [-27.3,12.1] t(17)=-0.817 0.425 -0.39
3 3.5 [-11.9,18.9] t(17)=0.477 0.639 0.26
4 -10.5 [-24.1,32.0] t(15.944)=-1.623 0.124 -0.54
Table 5. Comparison of TC and FCT Performance on Multiple Choice Tests, Overall and by Course Topic.
t-test for Equality of Means
Topic Mean Difference (%) BCa 95% CI t(df) Sig (p) Effect Size (d)
Overall 11.0 [-5.6,27.5] t(9.505)=1.489 0.169 1.11
1 19.4 [-5.3,44.0] t(8.385)=1.799 0.108 1.75
2 3.6 [-17.0,24.2] t(18)=0.369 0.716 0.18
3 13.7 [-36.1,31.0] t(18)=1.663 0.114 1.00
4 2.5 [-14.1,19.1] t(18)=0.319 0.753 0.14
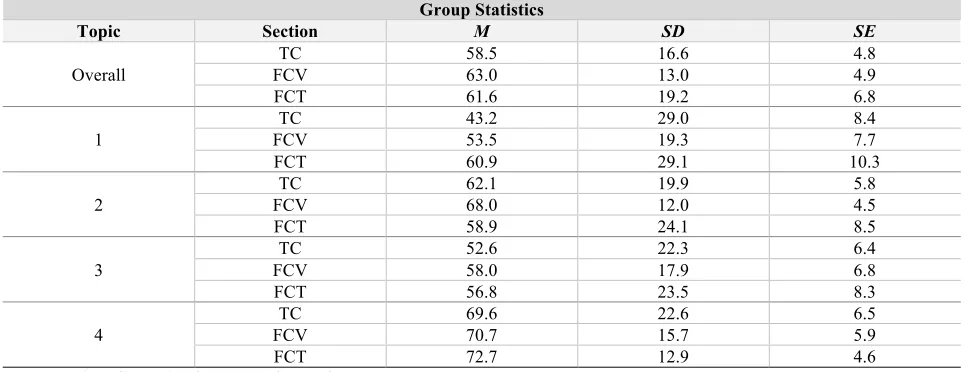
3.4 Student Performance on Numerical Analysis Questions
Table 6. Comparison of Descriptive Statistics for Numerical Analysis Questions across Course Implementations.
Group Statistics
Topic Section M SD SE
Overall
TC 58.5 16.6 4.8
FCV 63.0 13.0 4.9
FCT 61.6 19.2 6.8
1
TC 43.2 29.0 8.4
FCV 53.5 19.3 7.7
FCT 60.9 29.1 10.3
2
TC 62.1 19.9 5.8
FCV 68.0 12.0 4.5
FCT 58.9 24.1 8.5
3
TC 52.6 22.3 6.4
FCV 58.0 17.9 6.8
FCT 56.8 23.5 8.3
4
TC 69.6 22.6 6.5
FCV 70.7 15.7 5.9
FCT 72.7 12.9 4.6
Notes. N=27; TC, n = 12; FCV, n = 7; FCT, n = 8
Table 7. Comparison of TC and FCV Performance on Numerical Analysis Problems, Overall and by Course Topic.
t-test for Equality of Means
Topic Mean Difference (%) BCa 95% CI t(df) Sig (p) Effect Size (d)
Overall -4.5 [-20.0,11.0] t(17)=-0.610 0.550 1.04
1 -10.3 [-36.4,15.8] t(17)=-0.833 0.417 0.36
2 -5.9 [-23.6,11.7] t(17)=-0.712 0.486 0.30
3 -5.4 [-26.4,15.5] t(17)=-0.545 0.593 0.24
4 -1.2 [-21.6,19.3] t(17)=-0.119 0.906 0.05
Table 8. Comparison of TC and FCT Performance on Numerical Analysis Problems, Overall and by Course Topic.
t-test for Equality of Means
Topic Mean Difference (%) BCa 95% CI t(df) Sig (p) Effect Size (d)
Overall -3.1 [-20.1,13.8] t(18)=-3.900 0.701 0.19
1 -17.7 [-45.6,10.1] t(18)=-1.337 0.198 0.61
2 3.2 [-17.6,23.9] t(18)=0.321 0.752 0.16
3 -4.2 [-26.0,17.7] t(18)=-0.402 0.692 0.19
4 -3.1 [-21.3,15.4] t(18)=-0.354 0.727 0.14
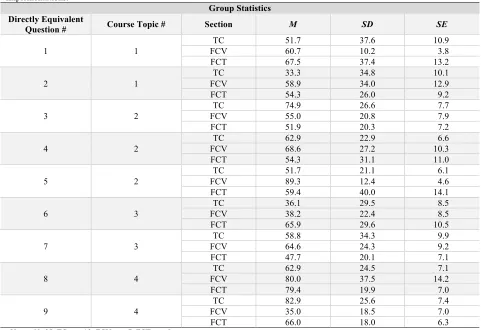
3.5 Student Performance on Directly Equivalent Metrics
Table 9. Comparison of Mean, Standard Deviation, and Standard Error of Directly Equivalent Questions across Course Implementations.
Group Statistics Directly Equivalent
Question # Course Topic # Section M SD SE
1 1
TC 51.7 37.6 10.9
FCV 60.7 10.2 3.8
FCT 67.5 37.4 13.2
2 1
TC 33.3 34.8 10.1
FCV 58.9 34.0 12.9
FCT 54.3 26.0 9.2
3 2
TC 74.9 26.6 7.7
FCV 55.0 20.8 7.9
FCT 51.9 20.3 7.2
4 2
TC 62.9 22.9 6.6
FCV 68.6 27.2 10.3
FCT 54.3 31.1 11.0
5 2
TC 51.7 21.1 6.1
FCV 89.3 12.4 4.6
FCT 59.4 40.0 14.1
6 3
TC 36.1 29.5 8.5
FCV 38.2 22.4 8.5
FCT 65.9 29.6 10.5
7 3
TC 58.8 34.3 9.9
FCV 64.6 24.3 9.2
FCT 47.7 20.1 7.1
8 4
TC 62.9 24.5 7.1
FCV 80.0 37.5 14.2
FCT 79.4 19.9 7.0
9 4
TC 82.9 25.6 7.4
FCV 35.0 18.5 7.0
FCT 66.0 18.0 6.3
Notes. N=27; TC, n = 12; FCV, n = 7; FCT, n = 8
Table 10. Comparison of TC and FCV Performance on Directly Equivalent Questions.
t-test for Equality of Means
Topic Mean Difference (%) BCa 95% CI t(df) Sig (p) Effect Size (d)
1 -9.0 [-33.8, 15.7] t(13.54) = -0.785 0.446 0.24
1 -25.6 [-60.3, 9.1] t(17) = -1.556 0.138 0.74
2 19.9 [-48.7, 44.7] t(17) = 0.407 0.108 0.75
2 -5.6 [-30.2, 19.0] t(17) = 0.791 0.635 0.25
2 -37.6 [-56.2, -19.0] t(17 )= 0.395 0.001 1.78
3 -2.1 [-29.4, 25.2] t(17) = -0.163 0.872 0.07
3 -5.8 [-37.1, 25.5] t(17) = -0.430 0.700 0.17
4 -17.1 [-50.0, 12.8] t(17) = -1.206 0.244 0.70
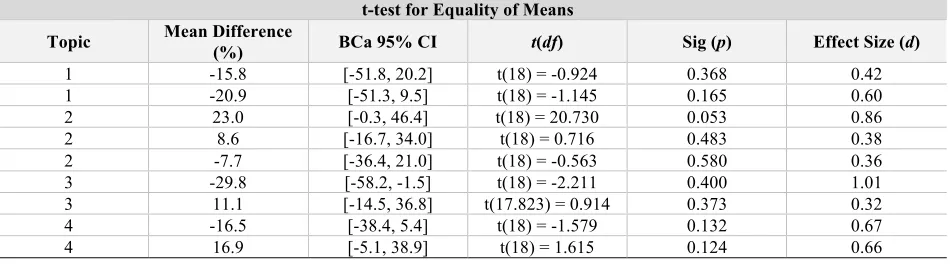
Table 11. Comparison of TC and FCT Performance on Directly Equivalent Questions.
t-test for Equality of Means
Topic Mean Difference (%) BCa 95% CI t(df) Sig (p) Effect Size (d)
1 -15.8 [-51.8, 20.2] t(18) = -0.924 0.368 0.42
1 -20.9 [-51.3, 9.5] t(18) = -1.145 0.165 0.60
2 23.0 [-0.3, 46.4] t(18) = 20.730 0.053 0.86
2 8.6 [-16.7, 34.0] t(18) = 0.716 0.483 0.38
2 -7.7 [-36.4, 21.0] t(18) = -0.563 0.580 0.36
3 -29.8 [-58.2, -1.5] t(18) = -2.211 0.400 1.01
3 11.1 [-14.5, 36.8] t(17.823) = 0.914 0.373 0.32
4 -16.5 [-38.4, 5.4] t(18) = -1.579 0.132 0.67
4 16.9 [-5.1, 38.9] t(18) = 1.615 0.124 0.66
3.6 Student Perceptions of Course and Instructor
Student perceptions of the three course implementations was evaluated using standard, university issued end-of-semester evaluations. Figure 4 presents both the relevant survey items and the student responses for the three course formats. Additionally, the instructor’s average score across all courses is provided for comparative purposes. Answers to questions are on a 5 point Likert-like scale where [E] = Excellent = 5, [G]=Good = 4, [F] = Fair = 3, [P]=Poor = 2, and [VP]= Very Poor = 1, or [SA]= Strongly Agree = 5, [A]= Agree=4, [U]=Undecided = 3, [D]=Disagree = 2, [SD]=Strongly Disagree = 1. The five reviewed questions are:
• Q1: “Overall, I would rate this course as:”
• Q2: “Overall, I would rate this instructor as:”
• Q3: “My instructor displays a clear understanding of course topics:”
• Q4: “My instructor explains difficult material clearly.”
• Q5: “My instructor seems well prepared for class.”
Figure 4. Student responses to end-of-semester course evaluations.
Notes. N=26; TC, n = 12; FCV, n = 6; FCT, n = 8
The departmental survey also collects qualitative open-ended responses from students via comments they would like to make regarding the course. Table 12 organizes relevant students comments related to the strengths and weaknesses of the course implementations. In the TC format, indicated strengths primarily related to instructor preparation and expertise regarding subject matter. Indicated weakness related to the fast rate at which topics were covered, the need for additional practice problems, and the use of a tablet-pc in place of a traditional whiteboard. In the FCV, no students provided comments related to strengths of the course. Indicated weaknesses all related to the flipped style, regarding the use of both the video lectures and discussion questions. In the FCT implementation, indicated strengths related to instructor preparation, expertise in the subject matter, and clarity of explanations. Indicated weaknesses were related to the use of the media enhanced e-text and a single comprehensive final exam.
0.0 0.5 1.0 1.5 2.0 2.5 3.0 3.5 4.0 4.5 5.0
Q1 Q2 Q3 Q4 Q5
Table 12. End-of-Semester Student Evaluation of TC, FVC, and FCT Course and Instructor. TC Strengths
• Well-constructed PowerPoints with helpful figures. • The instructor knows the material very well. • He knows what he's talking about.
TC Weaknesses
• The instructor is very knowledgable about the topics but he doesn't explain them to the class very well. Many times, the instructor skips over key points in the material. This is because he believes we already know most of the material [related to circuit analysis techniques].
• Overall the course felt rushed, like there was too much material compressed into one semester. I think part of the issue was the lengthy review at the beginning of the course, which was redundant with material we were already learning/had learned in another course
• There weren't enough examples of problems that we would see on the tests/quizzes, even though the homeworks were generally long, it would be nice to have some more practice (sometimes looking at the homework solutions makes a single problem obvious, but if there's no other examples, it's harder to think through a different problem).
• It was harder to follow lecture notes on the tablet/projector vs. a whiteboard, the way things are presented is completely different - could be my personal preference.
FCV Strengths • None Give FCV Weakness
• Knowledgeable about the material but I feel that his teaching methods were not the way that I learn.
• Stop using the videos to lecture, while it seemed like a good idea I found it more difficult to learn in this manner. • I did not find video lectures helpful. They were very time consuming and difficult to follow. I would much rather study
a chapter from a book.
• The class atmosphere is not very conducive to learning. I felt discouraged from answering questions for fear of being wrong and getting graded on it. Remove the discussions questions and practice exercises portions of the class and instead explain the concepts for the students in a, in class, lecture format.
• I did not like the whole "flipped learning style." I struggled to learn via the lectures and could not stop the lecture to ask the professor questions.
FCT Strengths
• The instructor understands the material very well and is able to explain it clearly. • The instructor gives us loads of useful information
• The instructor is very knowledgeable of the material and took plenty of time to make sure the class understood the content.
• I appreciate the work the instructor puts into detailing all of the course material. The instructor is always available and willing to provide help.
• [The Instructor] always seems to have time to take/answer questions and spend as much time with students as needed to provide understanding of the topic.
FCT Weaknesses
• The reading packets we have, while very detailed, could be trimmed down more. So much time is spent on the concepts in class that it feels like the math isn't covered nearly as much. We can get a decent understanding of the concepts, but without spending as much time on the math, we can't really do anything.
• I would like to see the course have a test mid way through the semester
• I would also like to be taught in class as opposed to reading packets outside of class.
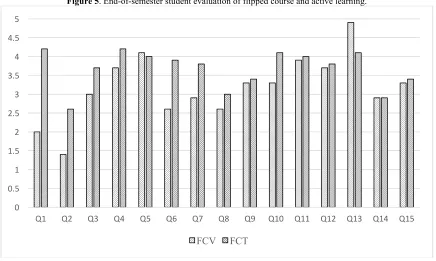
3.7 Student Perceptions of Active Learning Formats
• Q4: “The discussion questions aided my understanding of the course material.”
• Q5: Having the discussion questions available in advance helped me to better utilize the online video lectures [media enhanced e-text]”
• Q6: “Answering the discussion questions when called upon by the instructor helped me to better understand the course material.”
• Q7: “Talking about the discussion questions with other students helped me to better understand the course material.”
• Q8:” I preferred the use of the discussion questions as compared to a traditional lecture.”
• Q9: ” I would recommend that this course continue to use the discussion questions as an instructional tool.”
• Q10: “The practice exercises aided my understanding of the course material.”
• Q11: “Having the practice exercises available in advance of class helped me to better utilize the online video lectures.”
• Q12: Working on the practice exercises in small groups helped me to better understand the course material.”
• Q13: “Having the instructor lead group solving of the practice exercises helped me to better understand the course material.”
• Q14: “I preferred the use of the practice exercises as compared to a traditional lecture.”
• Q15: “I would recommend that this course continue to use the practice exercises as an instructional tool.”
Student in the FCV section indicated an overall dis-satisfaction with the use of pre-recorded videos as a primary means of content delivery, indicating that the videos did not help the understand course materials and strongly indicating a preference for a traditional lecture format. Students in the FCT section indicated mixed experience with the use of the media enhanced e-text as a primary means of content delivery, indicating that although the readings and video helped them understand course material, they still preferred traditional lecture formats.
Survey results indicate that students in both sections were neutral regarding the impact of the multiple choice quizzes on their understanding of course material.
Both section indicated that the use of discussion questions helped them better understand the course material. However, students enrolled in the FCV section mostly disagreed or were undecided on the utility of the group discussions that followed. This is in contrast to the FCT section, which indicated that these activities were helpful. Both groups were approximately neutral regarding the use of the discussion questions as compared to traditional lecture.
Figure 5. End-of-semester student evaluation of flipped course and active learning.
3.8 Content Coverage
The instructor covered the same content in all three iterations of the 15-week format, and no impact of the flipped format was observed on the rate or quantity of content covered for the FCV or FCT implementation. The researcher made this determination by comparing the number and depth of topics included on the final exam in each course.
4. DISCUSSION
The results of this study help to clarify the use of both active learning and flipped course delivery formats in engineering technology programs, particularly those with small student populations, results that are particularly relevant given recent calls for a “more nuanced view of active learning” (Strevler and Menekse, 2017).
Comparison of performance measures used to assess student achievement in the course give mixed results. Overall, students performed better in the TC than in either the FCV or FCT. Although not statistically significant, effect size calculations indicate that the relationship between course grade and format has a strong effect. Regarding multiple choice questions, typically assessing information at the knowledge and comprehension level of Bloom’s Taxonomy (Bloom, Englehart, Furst, Hill, & Krathwohl, 1956), students in the FCV section outperformed TC students overall and in three of four topic areas, with the exception being performance measures related to AC generation. In contrast, students in the TC format outperformed FCV student overall and in all topic areas. For both comparisons, none of the findings were statistically significant, however Cohen’s d for both groups indicate small to large effect sizes. Regarding numerical analysis questions, typically assessing information at the application level of Bloom’s Taxonomy, students in the FCV section outperformed TC students overall and in all topic areas. Similarly, students in the FCT section outperformed their TC counterparts overall, and in three of four topic areas, with the exception being performance measures related to AC power. Again, none of the findings are statistically significant, and the effect sizes are small to medium. When comparing directly equivalent metrics students in the FCV and FCT outperformed students in the TC section in seven and five out of nine performance measures, respectively. Two of
0 0.5 1 1.5 2 2.5 3 3.5 4 4.5 5
Q1 Q2 Q3 Q4 Q5 Q6 Q7 Q8 Q9 Q10 Q11 Q12 Q13 Q14 Q15
engineering topics. These findings, however, are inconsistent with the fact that the FCT and FCV offerings placed more emphasis (i.e., the instructor spent more class time) on numerical calculations than in the TC format, and are in contrast to findings of similar studies (Mason, Shuman & Cook, 2013, Yelamarthi & Drake, 2014). Although untested, the authors postulate that the small class sizes involved in this study negate many of the reported benefits of active and flipped learning as small courses often utilize such techniques naturally (i.e., that active learning strategies incorporate many of the naturally occurring benefits of a small class into a class with a larger student population).
Student perception of the course and of the instructor show that although student evaluation of the TC implementation was generally lower than the instructor’s average score for all courses, the FCV implementation was lower than both. While students indicated similar weaknesses in both implementations related to the amount of course content and expectations of prior knowledge, students overwhelmingly indicated the use of videos as the major weakness of the FCV implementation. In contrast, students in the FCT implementation gave the instructor scores higher than the instructor’s average for all courses, and indicated that the media enhanced e-text was very helpful in understanding the course material. This effect can also be seen in student evaluation of the active learning content, in which FCV students consistently rated the learning activities as less helpful than as rated by FCT students. These findings are especially interesting given the relatively equitable performance in the courses by the two groups. Issues with the FCV course structure were a common theme in student survey-responses, and the course instructor observed that students appeared frustrated with the method throughout the semester. The authors postulate that since many of the students were experiencing the flipped format for the first time, their desire for consistent and familiar instruction styles across courses was in conflict with the instructional method (i.e., that the use of a new instructional style was contrary to what students had come to expect from and where comfortable with in engineering courses). This hypothesis is supported by the higher than averages scores and relative support from students in the FCT section, when the only substantive difference was replacing videos with a text book, a delivery format with which the majority of students are very familiar. However, it should be noted that the FCV section was the instructors second implementation of a flipped/active course, while the FCT was the fifth, giving him significantly more time to refine and be comfortable with the method.
In contrast to other studies (Mason, Shuman & Cook, 2013, Yelamarthi & Drake, 2014), which report being able to cover more course content utilizing a combination of flipped methods and active learning, the instructor in this study covered approximately the same amount of course material in all three course implementations. However, the active learning interventions used in this study were more expansive than those in the cited literature, which primarily focused on group problem solving, whereas this worked, utilized both team problem solving and group discussions. These results however do provide evidence that supports the use of the flipped method as a way to integrate active learning strategies into curriculum without sacrificing content coverage.
Finally, the conversion of the TC course to a flipped format involved a substantial investment of time by the instructor. Overall, the instructor dedicated eight weeks to the creation of the lecture videos, discussion questions, group-problem solving activities, and grading rubrics. Of this, approximately fifty percent of the effort was related to video creation: filming, editing, previewing, and hosting. However, the majority of this time investment resulted in reusable instructional materials, reducing course preparation time in future offerings of the course.
5. CONCLUSION
results may be due to the effect of active-learning techniques formally introducing many of the naturally occurring elements of small class sizes, and due to student-discomfort with unfamiliar teaching methods. Several research questions that were not addressed in this work, but are deserving of further study include: “Does the use of active learning in engineering technology courses impact student’s long-term retention of course content?” and “How does active learning effect student’s qualitative understanding of course concepts, as compared to traditional lecture-based courses?”.
AUTHOR BIOGRAPHIES
Dr. Matthew Turner is an Assistant Professor of Electrical and Computer Engineering Technology at Purdue University, New Albany, where he specializes in the areas of power systems and controls. Prior to joining the faculty at Purdue, Professor Turner worked as a researcher at the Conn Center for Renewable Energy Research in the area of power and energy systems, with a focus on smart grid implementation and computer modeling.
Dr. Rustin Webster is an Assistant Professor at Purdue University. He teaches within the Purdue Polytechnic Institute and the department of engineering technology. He specializes in mechanical engineering and computer graphics technology. Prior to joining Purdue, Dr. Webster worked in the Department of Defense field as an engineer, project manager, and researcher. His specialization was in mechanical design, research and development, and business development.
REFERENCES
Bishop, J. L., & Verleger, M. A. (2013, June). The flipped classroom: A survey of the research. In ASEE National Conference Proceedings, Atlanta, GA.
Bloom, B., Englehart, M., Furst, E., Hill, W., & Krathwohl, D. (1956). Taxonomy of educational objectives. Handbook 1: Cognitive domain. New York, Logmans, Green.
Cavalli, M., Neubert, J., McNally, D., & Jacklitch-Kuiken, D. (2014, June). Comparison of student performance and perceptions across multiple course delivery modes. In Proceedings of the ASEE Annual Conference and Exposition, Indianapolis, IN.
Freeman, S., Eddy, S. L., McDonough, M., Smith, M. K., Okoroafor, N., Jordt, H., & Wenderoth, M. P. (2014). Active learning increases student performance in science, engineering, and mathematics. Proceedings of the National Academy of Sciences, 111(23), 8410-8415.
Kember, D., & Gow, L. (1994). Orientations to teaching and their effect on the quality of student learning. The Journal of Higher Education, 65(1), 58-74.
Mason, G. S., Shuman, T. R., & Cook, K. E. (2013). Comparing the effectiveness of an inverted classroom to a traditional classroom in an upper-division engineering course. IEEE Transactions on Education, 56(4), 430-435.
Pratt, D. D. (1992). Conceptions of teaching. Adult Education Quarterly, 42(4), 203-220.
Prince, M. (2004). Does active learning work? A review of the research. Journal of engineering education, 93(3), 223-231. Streveler, R. A., & Menekse, M. (2017). Taking a closer look at active learning. Journal of Engineering Education, 106(2),
186-190.