Development of the Children With
Disabilities Algorithm
Alyna T. Chien, MD, MSa,b, Karen A. Kuhlthau, PhDb,c, Sara L. Toomey, MD, MPhil, MPH, MSca,b, Jessica A. Quinn, MSa, Amy J. Houtrow, MD, PhD, MPHd,e, Dennis Z. Kuo, MD, MHSf, Megumi J. Okumura, MDg,h, Jeanne M. Van Cleave, MDb,c, Chelsea K. Johnson, BAa, Lindsey L. Mahoney, BSa, Julia Martin, BAa, Mary Beth Landrum, PhDi, Mark A. Schuster, MD, PhDa,b
abstract
BACKGROUND:A major impediment to understanding quality of care for children with disabilities
(CWD) is the lack of a method for identifying this group in claims databases. We developed the CWD algorithm (CWDA), which usesInternational Classification of Diseases, Ninth Revision, Clinical Modification(ICD-9-CM) codes to identify CWD.
METHODS:We conducted a cross-sectional study that (1) ensured each of the 14 567 codes within
the 2012 ICD-9-CM codebook was independently classified by 3 to 9 pediatricians based on the code’s likelihood of indicating CWD and (2) triangulated the resulting CWDA against parent and physician assessment of children’s disability status by using survey and chart abstraction, respectively. Eight fellowship-trained general pediatricians and 42 subspecialists from across the United States participated in the code classification. Parents of 128 children from a large, free-standing children’s hospital participated in the parent survey; charts of 336 children from the same hospital were included in the abstraction study.
RESULTS:CWDA contains 669 ICD-9-CM codes classified as having a $75% likelihood of
indicating CWD. Examples include 318.2 Profound intellectual disabilities and 780.72 Functional quadriplegia. CWDA sensitivity was 0.75 (95% confidence interval 0.63–0.84) compared with parent report and 0.98 (0.95–0.99) compared with physician assessment; its specificity was 0.86 (0.72–0.95) and 0.50 (0.41–0.59), respectively.
CONCLUSIONS:ICD-9-CM codes can be classified by their likelihood of indicating CWD. CWDA triangulates well with parent report and physician assessment of child disability status. CWDA is a new tool that can be used to assess care quality for CWD.
WHAT’S KNOWN ON THIS SUBJECT:There are no validated claims-based algorithms for identifying children with disabilities (CWD) to facilitate larger-scale studies of care quality for CWD.
WHAT THIS STUDY ADDS:This study develops the CWD algorithm, a claims-based algorithm for identifying diagnostic codes with a$75% chance of indicating CWD, and triangulates the algorithm against parent report and physician chart abstraction.
a
Division of General Pediatrics, Department of Medicine, Boston Children’s Hospital, Boston, Massachusetts; bDepartments of Pediatrics, andiHealth Care Policy, Harvard Medical School, Boston, Massachusetts;cCenter for Child and Adolescent Health Research and Policy, Department of General Pediatrics, Massachusetts General Hospital for Children, Boston, Massachusetts;dDivision of Pediatric Rehabilitation Medicine, Children’s Hospital of Pittsburgh, Pittsburgh, Pennsylvania;eDepartment of Physical Medicine and Rehabilitation, University of Pittsburgh School of Medicine, Pittsburgh, Pennsylvania;fDepartment of Pediatrics, University of Arkansas for Medical Sciences College of Medicine, Little Rock, Arkansas; andgDivision of General Pediatrics, Beinoff Children’s Hospital, andhDepartment of Pediatrics, Division of General Pediatrics, School of Medicine, University of California San Francisco, San Francisco, California
Little is known about health care quality that children with disabilities (CWD) receive. Most of what is known comes from pediatric case reports,1,2studies of adults with
disabilities,3,4and descriptions of
severely affected children with special health care needs (CSHCN).5,6
Afirst step toward being able to rigorously assess care quality for CWD is to be able to identify CWD in claims data and to examine care quality for CWD using existing claims-based measures of pediatric care quality (eg, well-visit rates, receipt of recommended screenings). This and the ability to compare care quality for CWD against that for non-CWD would allow physicians, practices, and insurers to better design or target interventions to improve the care of CWD. A claims-based algorithm identifying CWD would allow stakeholders to assess the relative prevalence of CWD across health care systems and to describe the degree to which CWD are reaching the
“equalization of opportunity”goals set forth by the United Nations (UN), which directs nations to address whether“persons with disabilities, particularly infants and children, are provided with the same level of medical care within the same system as other members of society.”25(p12)
Disability concepts and definitions have evolved significantly over the past half century, with disabilities being defined as an interaction between persons and their environments as opposed to an inherent feature of individuals.7,8As
detailed in the 2001 International Classification of Functioning, Disability, and Health (ICF)7and the
2006 UN Convention on the Rights of Persons with Disabilities,8“Persons
with disabilities include those who have long-term physical, mental, intellectual or sensory impairments which in interaction with various barriers may hinder their full and effective participation in society on an equal basis with others.”8(p4)
The prevalence of CWD (0- to 18-year-olds) in the United States has increased from 2% to 8% over the past 50 years.9–11Many ascribe the
rise in CWD prevalence to the rise in mental health–related disabilities and significant functional problems (eg, feeding impairment, learning difficulties) among those surviving with conditions previously considered untreatable (eg, extreme prematurity, congenital heart disease, HIV).9,12–14
Societal costs of CWD appear to be growing: federal spending on children in the Supplemental Security Income program, the main governmental program supporting CWD with low-income backgrounds, has increased by 55% over the past 13 years.15,16
Furthermore, CWD may use health care up to 8 times more frequently than their counterparts without disabilities.17
The 2009 Children’s Health Insurance Program Reauthorization Act has created an unprecedented opportunity to address the long-standing gap in our underlong-standing of care quality for CWD.18The
Children’s Health Insurance Program Reauthorization Act required the Agency for Healthcare Research and Quality and the Centers for Medicare and Medicaid Services to establish the Pediatric Quality Measures Program; the Center of Excellence for Pediatric Quality Measurement at Boston Children’s Hospital was assigned to address care quality for CWD and developed the CWD algorithm (CWDA) so that the proliferating number of available claims-based measures could be applied to the study of care quality for CWD.
CWD are a distinct subset of children7–11with long-term
functional impairments stemming from a wide range of clinical diagnoses (eg, severe burns,
gastrostomy dependence). CWD have specific needs within the health care system, but the quality of the care that is being delivered to this population is poorly understood. Existing algorithms based on
International Classification of Diseases, Ninth Revision, Clinical Modification
(ICD-9-CM) codes have allowed for refined assessment of quality for specific subsets of the pediatric population, but do not specifically identify CWD.19Studies using other
algorithms have provided important insight into aspects of pediatric care quality, such as access to palliative care, so we anticipate that an algorithm aimed at identifying CWD would similarly highlight the particular health care needs of CWD.19–24
Thus, the main objectives of this study were to (1) create CWDA using pediatric disability experts to classify ICD-9-CM codes according to their likelihood of indicating CWD, and (2) triangulate CWDA with the parent perspective of disability and physician assessment of patient charts. The goal of CWDA is to identify a population of children with a high likelihood of having a disability based on their diagnoses found in claims data.
METHODS
Disability Concepts and Definitions
We based all aspects of CWDA development on the disability concepts and definitions detailed by the World Health Organization (WHO) ICF and the UN.7,8We
continually and consistently referenced these concepts and definitions with our code
classification participants and chart abstractors and when selecting existing survey items to assess parents’perspective on their child’s disability status.
Study Design
In thefirst phase of CWDA development, we used consensus methods developed by Glaser26and 4
steps to ensure that each of the 14 567 codes within the 2012 ICD-9-CM codebook was independently
CWD. In the second phase, we triangulated CWDA’s identification of CWD against whether children were considered to have a disability according to (1) parents via a parent survey, and (2) physicians via patient chart abstraction. We included parents because they have intimate knowledge of their child’s functioning in nonclinical settings; we gathered physician assessments because physicians care for children with a wide range of impairments and are able to make comparative
assessments of functional ability. The study was reviewed and approved by the Boston Children’s Hospital Institutional Review Board.
Code Classification
The 4-step code classification process began with all 14 567 codes in the 2012 ICD-9-CM Codebook (Fig 1).
In Step 1 (the Pre-sort), the goal was to reduce the volume of codes for detailed review by removing those that were very unlikely to indicate CWD (nonetheless, these codes were reviewed a second time as described later in this article). We used existing ICD-9-CM algorithms for CSHCN and complex chronic conditions to designate 2738 codes as having a$10% likelihood of indicating CWD.20,21We then used 2
fellowship-trained general pediatricians with
.10 years of clinical experience caring for CSHCN to independently review the remaining codes to determine if they met the$10% threshold. If these 2 reviewers disagreed, then 3 additional general pediatricians (also with advanced training) resolved the disagreement. These reviewers designated an additional 1226 codes as having a$10% likelihood of indicating CWD. During this step, we also excluded codes that were inapplicable to the pediatric population (n= 56; eg, senile dementia) or could not be used for primary diagnoses (n= 1291; ie, E-codes).
In Steps 2 and 4 (the Initial and Final Disability Expert Review,
respectively), 3 pediatric disability experts independently reviewed the 3964 codes identified in Step 1 as having$10% likelihood of indicating CWD and further classified them according to whether the code had a,10%,$10 to,75%, or$75% likelihood of indicating CWD. Pediatric disability experts were also fellowship-trained, had at least 5 years of experience studying or caring for CWD, and had served on CWD-relevant national councils or chapters (eg, the American Academy of Pediatrics Council on Children with Disabilities).
In Step 3 (the Subspecialist Review), we obtained input from relevant pediatric subspecialists (eg, codes related to hearing were reviewed by
a pediatric otolaryngologist
specializing in hearing loss, whereas codes related to intracranial bleeds were reviewed by a pediatric neurosurgeon, neurologist, and rehabilitation physician). The subspecialists reviewed all codes related to theirfield, including those originally classified as,10% in Step 1.
In Step 4 (the Final Disability Expert Review), the 3 pediatric disability experts from Step 2 incorporated the subspecialists’input into theirfinal classification decisions. Ultimately, codes identified as having a$75% likelihood of indicating CWD were included in CWDA. A total of 8 general pediatricians and 42 pediatric
subspecialists participated in the 4-step
FIGURE 1
code classification process. We resolved disagreements through consensus.
We drew pediatric disability experts and specialists from across the United States. We also conducted literature reviews on.500 conditions tofind empirical data to support or clarify classification decisions. We trained all those involved in the code
classification process in the WHO and UN concepts and definitions of disability, to apply age-appropriate expectations with respect to functional ability, to gauge whether the disability would be present for at least 12 months (to meet the“ long-term”requirement within current definitions of disability), and to think at the population level (ie, to estimate how many of 100 children with the diagnosis code of interest they would consider as having a disability. Because functional expectations depend on context, we also established key assumptions that children lived in an environment or setting that was average for the United States in 2012, had families who possessed a typical capacity for seeking and accessing health care, received treatment that was typically available, and experienced a typical clinical course. We trained those involved in the Step 1 pre-sort for at least 1 hour, the pediatric disability experts responsible for Steps 2 and 4 for at least 4 hours, and Step 3 subspecialists for a variable amount of time depending on the amount and complexity of codes being reviewed. All initial trainings were conducted in person, and follow-up discussions were conducted by e-mail, phone, and conference calls.
Reinforcement generally occurred at weekly to biweekly intervals throughout the code classification process. All disagreements were reconciled by discussion or majority vote.
Triangulation
Parent Perspective
We gathered the parent perspective on their child’s disability status via survey. We assembled our parent survey questions from 3 previously
used parent-report instruments that have been used to establish CWD prevalence in previous national surveys: (1) the Washington Group on Disability Statistics’Module on Child Functioning and Disability, (2) the 2011 National Health Interview Survey (NHIS) Questionnaire, and (3) the 1995 NHIS Disability
Supplement.27–29The Washington
Group on Disability Statistics’ questions gather information on the presence and severity of functional impairments in 12 domains (eg, hearing, seeing, walking) and vary by age-appropriate expectations. The survey also asks parents to reflect on functional ability over the previous year and ends with a single item adapted from the NHIS,“Do you consider your child to have a disability?”The parent survey included 34 items in total and was provided in English or Spanish.
We surveyed parents of children actively receiving primary care at a large, free-standing children’s hospital at the beginning of 2014 (February–April). We defined active as having$2 encounters at the clinic in the 2 years before the survey and fielded the survey in the early months of 2014 because the survey questions asked parents to recall their child’s functional ability over the 2013 calendar year. We designated children as CWD if they had$1 CWDA code initially in 2012 (because 2013 information was not available at the time of sampling). We oversampled for parents of CWD versus non-CWD and attempted to survey the parent of every CWD with a clinic appointment at the beginning of 2014. In analyses we updated disability status based on 2013 information. We randomly selected parents of non-CWD for the survey and recruited all parents 1 week before or after their scheduled clinic visit, providing the option to complete the survey by mail, online, over the phone, or in person.
Physician Assessment of Patient Charts
We obtained physician assessment of disability status through chart abstraction. We developed a novel chart abstraction tool explicitly for this purpose. The abstraction tool built on the ICF’s impairment domains and severity coding schemes and required physicians to abstract clinical information pertaining to 13 domains of potential impairments (eg, hearing, seeing, moving), to indicate corresponding age-appropriate assessments of
impairment severity (mild, moderate, severe, complete, unspecified), and to note whether participation restriction appeared to be present in the home or school settings. The tool also instructs the abstractors to provide a clinical summary for the years’ worth of encounters and the item,“Do you consider this child to have at least one disability for the full duration of the target abstraction period?”
Two general pediatricians served as chart abstractors and underwent a day-long, in-person training on disability concepts and the
abstraction tool and then abstracted the charts of 336 patients (268 CWD, 68 non-CWD). During the abstraction process, we blinded abstractors to each patient’s CWDA status. We double-abstracted 10% of charts for quality assurance, calculating both inter- and intrarater reliabilities on a weekly basis. The interrater 2-way
kwas 0.62 (“substantial”30);
intrarater 2-waykwas 0.46 for 1 reviewer and 0.69 for the other (“moderate”and “substantial,” respectively30). All disagreements
were discussed and reconciled between the 2 abstractors.
Physician abstractors assessed the charts of children who had$2 encounters anywhere within a large, free-standing children’s hospital (inpatient, outpatient, primary care, and specialty). Between October and December 2013, physicians
between July 2011 and June 2012 and abstracted all encounters between the index visit and the 12 months following. We oversampled for CWD, designating children as CWD if they had$1 CWDA code in the target abstraction period.
Analysis
For the code classification process, we assessed inter- and multirater reliabilities of the dichotomous classification of codes,,75% or$75% likelihood of indicating CWD, by using 3 methods: (1) percent agreement, (2) Cohen 2-wayk,31and (3) Fleiss
multiraterk,32then proceeded with
consensus discussions.
Because the goal of CWDA is to enable the differentiation of pediatric populations into those with$75% likelihood of indicating CWD and those without, we focused on assessing the sensitivity of CWDA (ie, the likelihood that CWDA would be positive when compared with parent report or physician abstraction). A priori, we expect small amounts of misclassification; however, this level of misclassification would not impede comparative studies of CWD versus non-CWD. For informational purposes, we also include the specificity of CWDA, even though the algorithm is not designed to indicate the absence of disabilities.
RESULTS
Code Classification
The code classification process identified 669 codes with a$75% likelihood of indicating CWD (see Table 1 for examples, and the Supplemental Appendix for the full list of codes). The percent agreement between any 2 code classifiers was 90% to 91%, which falls into the
“nearly always acceptable”range.33
The Cohenkstatistic was 0.60 to 0.68 and the Fleiss multiraterkwas 0.64, both of which fall into the
“substantial”agreement range.30
Triangulation
Parent Perspective
The parent survey response rate was 61% (n= 128). The sensitivity of CWDA when compared with the parent perspective was 0.75 (95% confidence interval [CI] 0.63–0.84) and the specificity was 0.86 (95% CI 0.72–0.95) (Table 2).
Physician Assessment of Patient Charts
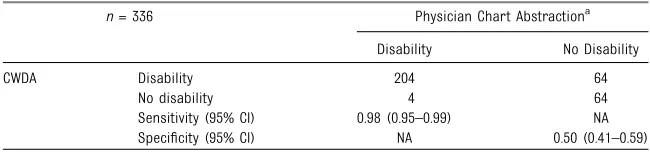
We abstracted 336 patient charts. The sensitivity of CWDA when compared with physicians on chart abstraction was 0.98 (95% CI 0.95–0.99) and the specificity was 0.50 (95% CI
0.41–0.59) (Table 3).
DISCUSSION
CWDA is a new algorithm that enables provider networks, health care delivery systems, health plans, hospitals, and state Medicaid offices to assess the quality of care being delivered to CWD. It also enables stratification of claims-based data by CWD versus non-CWD. CWD are a distinct subset of children7–11with
long-term functional impairments who have specific needs within the health care system and for whom no ICD-9-CM–based algorithm exists. CWDA contains a set of 669 ICD-9-CM
codes with a$75% likelihood of indicating CWD. CWDA is different from other ICD-9-CM–based algorithms designed to identify vulnerable subpopulations of children. CWDA (1) includes diagnoses related to intellectual and emotional conditions with a high likelihood of functional impairment (eg, schizophrenia); (2) excludes chronic conditions with a low likelihood of long-term functional impairment (eg, allergic rhinitis); (3) includes life-threatening conditions with a long-term clinical trajectory (eg, end-stage renal disease) but excludes those with a short-term trajectory (eg, sepsis); and (4) identifies children irrespective of the number of organ systems that might be involved.20–22
Of note, sensitivity of CWDA was 0.75 (95% CI 0.63–0.84) compared with parent report and 0.98 (95% CI 0.95–0.99) compared with physician assessment. We hypothesize that CWDA sensitivity relative to parent report may be lower than that for physician assessment because parents respond according to their own definitions of disability, rather than the WHO/UN concepts and definitions used for CWDA development. Both
TABLE 1 Example ICD-9-CM Codes in CWDA
Non-CWDA,75% Likelihood of Indicating CWD
CWDA$75% Likelihood of Indicating CWD No. of codes (%)a 12551 (95.0) 669 (3.1) Examples of codes 250.0 Diabetes mellitus without
mention of complication
318.2 Profound intellectual disabilities
277.0 Cysticfibrosis 389.11 Sensory hearing loss, bilateral 296.5 Bipolar I disorder 758.0 Down syndrome
314.0 Attention deficit disorder 780.72 Functional quadriplegia 493.2 Chronic obstructive asthma V44.0 Tracheostomy status
Please see the appendix for the full list of CWDA codes. aOf 13 220 applicable codes in the ICD-9-CM Codebook.
TABLE 2 Phase 2 of CWDA Development: Triangulation: CWDA Compared With Parent Survey
n= 114 Parent Surveya
Disability No Disability
CWDA Disability 53 6
No disability 18 37
Sensitivity (95% CI) 0.75 (0.63–0.84) NA Specificity (95% CI) NA 0.86 (0.72–0.95)
code classifiers and chart abstractors were physicians trained on the WHO/ UN definition. Although chart
abstractors were blinded to CWDA status, the common training may have made it much easier for the sensitivity between physician assessment of patient charts and CWDA to be extremely high.
Although CWDA was not designed to identify the absence of disabilities, the specificity of CWDA could be quite high in a population oversampled for CWD. A high specificity would suggest that the absence of a CWDA-qualifying diagnosis might also be aligned with parent report and physician
assessment of the absence of disabilities.
CWDA has some limitations. Like all ICD-9-CM-based algorithms, CWDA is based on diagnostic codes and administrative data, so misclassification (eg, due to miscoding) can occur. Another concern is the upcoming
implementation of theInternational Classification of Diseases, 10th Revision(ICD-10), which has 5 times as many codes as ICD-9-CM. We anticipate the development of numerous ICD-9-CM to ICD-10
“crosswalk”resources, which may extend the applicability of the current version of CWDA.34,35In addition, the
methods that we used to develop CWDA form a solid foundation on which an ICD-10 version could be created.
CWDA benefits from our drawing the pediatric disability experts from
across the United States, training them to apply population logic based on their understanding of diagnosing and coding practices across the country, and using empirical data to support
classification decisions. CWDA also benefits from having been
triangulated against both parent and physician assessments of children, although future validation studies would benefit from samples that may be more representative of the US pediatric population as a whole.
CONCLUSIONS
CWDA is a theoretically grounded method for identifying CWD using ICD-9-CM codes that has been triangulated against parent report and physician chart abstraction. By using CWDA, stakeholders can explore health care quality for CWD, which is likely robust in some respects (eg, whether they receive the recommended number of well-child visits in a year),19yet inadequate in
others (eg, whether their sexual health needs are being addressed).4,36
If CWDA is used to examine whether CWD and non-CWD groups receive or experience differential care quality, noted differences can become the focus of investigations and interventions.
ACKNOWLEDGMENTS
Data collection, analysis, and editing support for this project was provided by David A. Ansel, MD; Hannah D. Barrett, BA; Sarabeth Broder-Fingert,
MD; Maria C. Bryant, BA; Michael J. Furdyna, BA; Jisun Jang, MA; Isabel L. I. Janmey, BS; Ken Norwood, MD; Romi A. Webster, MD, MPH; Sandra A. Williams, SM. All except 2 of these individuals received compensation from grant U18HS020513 from the Agency for Healthcare Research and Quality and the Centers for Medicare and Medicaid Services (PI, Mark A. Schuster, MD, PhD).
We thank the staff of the Center of Excellence for Pediatric Quality Measurement (CEPQM) at Boston Children’s Hospital and Boston Children’s Primary Care at
Longwood. We thank the members of the Boston Children’s Hospital Family Advisory Council,
Massachusetts Child Health Quality Coalition, Academic Pediatric Association’s Complex Care Special Interest Group, and CEPQM’s Scientific Advisory Board and National Stakeholder Panel. We thank the participants in our parent survey and code classification process and all the others who contributed to the development and testing of CWDA.
ABBREVIATIONS
CI: confidence interval CSHCN: children with special
health care needs CWD: children with disabilities CWDA: children with disabilities
algorithm ICD-9-CM:International
Classification of Diseases, Ninth Revision, Clinical Modification
ICD-10:International Classification of Diseases, 10th Revision
ICF: International Classification of Functioning, Disability, and Health
NHIS: National Health Interview Survey
non-CWD: children without disabilities UN: United Nations
WHO: World Health Organization
TABLE 3 Phase 2 of CWDA Development: Triangulation: CWDA Compared With Physician Chart
Abstraction
n= 336 Physician Chart Abstractiona
Disability No Disability
CWDA Disability 204 64
No disability 4 64
Sensitivity (95% CI) 0.98 (0.95–0.99) NA Specificity (95% CI) NA 0.50 (0.41–0.59)
NA, not applicable.
This project was presented at the Massachusetts Child Health Quality Coalition and the Academic Pediatric Academic Society’s Complex Care Special Interest Group.
www.pediatrics.org/cgi/doi/10.1542/peds.2015-0228
DOI:10.1542/peds.2015-0228 Accepted for publication Jul 30, 2015
Address correspondence to Alyna T. Chien, MD, Division of General Pediatrics, Department of Medicine, Boston Children’s Hospital, 300 Longwood Ave, Boston, MA, 02115-5737. E-mail: [email protected]
PEDIATRICS (ISSN Numbers: Print, 0031-4005; Online, 1098-4275). Copyright © 2015 by the American Academy of Pediatrics
FINANCIAL DISCLOSURE:The authors have indicated they have nofinancial relationships relevant to this article to disclose.
FUNDING:Support for this work was provided by the US Department of Health and Human Services Agency for Healthcare Research and Quality and Centers for Medicare and Medicaid Services, Children’s Health Insurance Program Reauthorization Act Pediatric Quality Measures Program Centers of Excellence under grant U18 HS 020513. The content is solely the responsibility of the authors and does not necessarily represent the official views of the Agency for Healthcare Research and Quality.
POTENTIAL CONFLICT OF INTEREST:The authors have indicated they have no potential conflicts of interest to disclose.
REFERENCES
1. Megargel E, Broder-Fingert S. Autism
and hospitals: a difficult match.Acad
Pediatr. 2012;12(6):469–470
2. Liptak GS, Orlando M, Yingling JT, et al. Satisfaction with primary health care received by families of children with
developmental disabilities.J Pediatr
Health Care. 2006;20(4):245–252
3. US Department of Health and Human Services. Healthy People 2020. 2014. Available at: www.healthypeople.gov/ 2020/topicsobjectives2020/overview. aspx?topicid=9#two. Accessed August 14, 2015
4. Iezzoni LI. Eliminating health and health care disparities among the growing population of people with disabilities.
Health Aff (Millwood). 2011;30(10):
1947–1954
5. Houtrow AJ, Okumura MJ, Hilton JF,
Rehm RS. Profiling health and
health-related services for children with special health care needs with and without
disabilities.Acad Pediatr. 2011;11(6):
508–516
6. Nageswaran S, Silver EJ, Stein REK. Association of functional limitation with health care needs and experiences of children with special health care needs.
Pediatrics. 2008;121(5):994–1001
7. World Health Organization.International
Classification of Functioning, Disability and Health: ICF. Geneva, Switzerland: World Health Organization; 2001
8. United Nations.Convention on the Rights
of Persons with Disabilities and Optional
Protocol. 2006. Available at: www.un.org/ disabilities/documents/convention/ convoptprot-e.pdf. Accessed May 23, 2014
9. Houtrow AJ, Larson K, Olson LM, Newacheck PW, Halfon N. Changing trends of childhood disability, 2001-2011.
Pediatrics. 2014;134(3):530–538
10. Newacheck PW, Halfon N, Budetti PP. Prevalence of activity limiting chronic conditions among children based on
household interviews.J Chronic Dis.
1986;39(2):63–71
11. Halfon N, Houtrow A, Larson K, Newacheck PW. The changing landscape
of disability in childhood.Future Child.
2012;22(1):13–42
12. Centers for Disease Control and Prevention (CDC). Healthier mothers and
babies.MMWR Morb Mortal Wkly Rep.
1999;48(38):849–858
13. Chiu PP, Ijsselstijn H. Morbidity and
long-term follow-up in CDH patients.Eur J
Pediatr Surg. 2012;22(5):384–392
14. Wilson-Costello D, Friedman H, Minich N, Fanaroff AA, Hack M. Improved survival rates with increased
neurodevelopmental disability for extremely low birth weight infants in the
1990s.Pediatrics. 2005;115(4):997–1003
15. US Social Security Administration.
Annual Statistical Supplement to the Social Security Bulletin,2013.
Washington, DC; 2013. Available at: www. ssa.gov/policy/docs/statcomps/ supplement/2013/supplement13.pdf. Accessed June 20, 2014
16. US Social Security Administration.
Annual Statistical Supplement to the Social Security Bulletin,2000.
Washington, DC; 2000. Available at: www. ssa.gov/policy/docs/statcomps/ supplement/2000/supp00.pdf. Accessed July 18, 2014
17. Newacheck PW, Inkelas M, Kim SE. Health services use and health care
expenditures for children with
disabilities.Pediatrics. 2004;114(1):79–85
18. Byron SC, Gardner W, Kleinman LC, et al. Developing measures for pediatric quality: methods and experiences of the CHIPRA pediatric quality measures
program grantees.Acad Pediatr. 2014;14
(suppl 5):S27–S32
19. Chien AT, Song Z, Chernew ME, et al. Two-year impact of the alternative quality contract on pediatric health care quality
and spending.Pediatrics. 2014;133(1):
96–104
20. Kuhlthau KA, Beal AC, Ferris TG, Perrin JM. Comparing a diagnosis list with a survey method to identify children with chronic conditions in an urban health
center.Ambul Pediatr. 2002;2(1):58–62
21. Feudtner C, Hays RM, Haynes G, Geyer JR, Neff JM, Koepsell TD. Deaths attributed to pediatric complex chronic conditions: national trends and implications for
supportive care services.Pediatrics.
2001;107(6). Available at: www.pediatrics. org/cgi/content/full/107/6/E99
Needs (COE4CCN) Medical Complexity Working Group. Pediatric medical complexity algorithm: a new method to stratify children by medical complexity.
Pediatrics. 2014;133(6). Available at: www. pediatrics.org/cgi/content/full/133/6/e1647
23. Feudtner C, Silveira MJ, Christakis DA. Where do children with complex chronic conditions die? Patterns in Washington
State, 1980-1998.Pediatrics. 2002;109(4):
656–660
24. Lawson KA, Bloom SR, Sadof M, Stille C, Perrin JM. Care coordination for children with special health care needs:
evaluation of a state experiment.Matern
Child Health J. 2011;15(7):993–1000
25. United Nations General Assembly. Standard Rules on the Equalization of Opportunities for Persons with Disabilities. 1994
26. Glaser E. Using behavioral science
strategies for defining the
state-of-the-art.J Appl Behav Sci. 1980;16:79–92
27. Madans JH, Loeb ME, Altman BM.
Measuring disability and monitoring the
UN Convention on the Rights of Persons with Disabilities: the work of the
Washington Group on Disability
Statistics.BMC Public Health. 2011;11
(suppl 4):S4
28. US Department of Health and Human
Services, Centers for Disease Control and Prevention, National Center for
Health Statistics.2011 National Health
Interview Survey Questionnaire - Family; Hyattsville, MD: National Center for
Health Statistics, Centers for Disease
Control and Prevention; 2011
29. US Department of Health and Human Services, Centers for Disease Control
and Prevention, National Center for
Health Statistics.1994-1995 National
Health Interview Survey Supplemental
Booklet.; Hyattsville, MD: National Center
for Health Statistics, Centers for Disease Control and Prevention; 1994
30. Landis JR, Koch GG. The measurement of observer agreement for categorical
data.Biometrics. 1977;33(1):159–174
31. Cohen J. A coefficient of agreement for
nominal scales.Educ Psychol Meas.
1960;20(1):37–46
32. Fleiss JL. Measuring nominal scale
agreement among many raters.Psychol
Bull. 1971;76(5):378–382
33. Neuendorf KA.The Content Analysis
Guidebook. 1st ed. Thousand Oaks, CA: SAGE Publications, Inc; 2001:145
34. 3M. ICD-10 Translation tools. 2014. Available at: http://solutions.3m.com/wps/ portal/3M/en_US/Health-Information-Systems/HIS/Products-and-Services/ Products-List-A-Z/ICD-10-Translation-Tools/. Accessed August 14, 2015
35. Centers for Medicare and Medicaid Services. Road to 10. Available at: www. roadto10.org/. Accessed August 14, 2015
36. Murphy NA, Elias ER. Sexuality of children and adolescents with developmental
DOI: 10.1542/peds.2015-0228 originally published online September 28, 2015;
2015;136;e871
Pediatrics
Schuster
Johnson, Lindsey L. Mahoney, Julia Martin, Mary Beth Landrum and Mark A.
Houtrow, Dennis Z. Kuo, Megumi J. Okumura, Jeanne M. Van Cleave, Chelsea K.
Alyna T. Chien, Karen A. Kuhlthau, Sara L. Toomey, Jessica A. Quinn, Amy J.
Development of the Children With Disabilities Algorithm
Services
Updated Information &
http://pediatrics.aappublications.org/content/136/4/e871 including high resolution figures, can be found at:
References
http://pediatrics.aappublications.org/content/136/4/e871#BIBL This article cites 25 articles, 10 of which you can access for free at:
Subspecialty Collections
http://www.aappublications.org/cgi/collection/disabilities_sub
Children With Special Health Care Needs following collection(s):
This article, along with others on similar topics, appears in the
Permissions & Licensing
http://www.aappublications.org/site/misc/Permissions.xhtml in its entirety can be found online at:
Information about reproducing this article in parts (figures, tables) or
Reprints
DOI: 10.1542/peds.2015-0228 originally published online September 28, 2015;
2015;136;e871
Pediatrics
Schuster
Johnson, Lindsey L. Mahoney, Julia Martin, Mary Beth Landrum and Mark A.
Houtrow, Dennis Z. Kuo, Megumi J. Okumura, Jeanne M. Van Cleave, Chelsea K.
Alyna T. Chien, Karen A. Kuhlthau, Sara L. Toomey, Jessica A. Quinn, Amy J.
Development of the Children With Disabilities Algorithm
http://pediatrics.aappublications.org/content/136/4/e871
located on the World Wide Web at:
The online version of this article, along with updated information and services, is
http://pediatrics.aappublications.org/content/suppl/2015/09/22/peds.2015-0228.DCSupplemental Data Supplement at:
by the American Academy of Pediatrics. All rights reserved. Print ISSN: 1073-0397.