Nat. Hazards Earth Syst. Sci., 13, 1243–1257, 2013 www.nat-hazards-earth-syst-sci.net/13/1243/2013/ doi:10.5194/nhess-13-1243-2013
© Author(s) 2013. CC Attribution 3.0 License.
EGU Journal Logos (RGB)
Advances in
Geosciences
Open Access
Natural Hazards
and Earth System
Sciences
Open Access
Annales
Geophysicae
Open Access
Nonlinear Processes
in Geophysics
Open Access
Atmospheric
Chemistry
and Physics
Open Access
Atmospheric
Chemistry
and Physics
Open Access
Discussions
Atmospheric
Measurement
Techniques
Open Access
Atmospheric
Measurement
Techniques
Open Access
Discussions
Biogeosciences
Open Access Open Access
Biogeosciences
DiscussionsClimate
of the Past
Open Access Open Access
Climate
of the Past
Discussions
Earth System
Dynamics
Open Access Open Access
Earth System
Dynamics
Discussions
Geoscientific
Instrumentation
Methods and
Data Systems
Open Access
Geoscientific
Instrumentation
Methods and
Data Systems
Open Access
Discussions
Geoscientific
Model Development
Open Access Open Access
Geoscientific
Model Development
Discussions
Hydrology and
Earth System
Sciences
Open Access
Hydrology and
Earth System
Sciences
Open Access
Discussions
Ocean Science
Open Access Open Access
Ocean Science
DiscussionsSolid Earth
Open Access Open Access
Solid Earth
DiscussionsOpen Access Open Access
The Cryosphere
Natural Hazards
and Earth System
Sciences
Open Access
Discussions
Analysis of extreme summers and prior late winter/spring
conditions in central Europe
C. Tr¨ager-Chatterjee1, R. W. M ¨uller1, and J. Bendix2
1Deutscher Wetterdienst, Frankfurter Str. 135, 63067 Offenbach, Germany
2Laboratory for Climatology and Remote Sensing, Faculty of Geography, University of Marburg, Deutschhausstr. 10, 35032 Marburg, Germany
Correspondence to: C. Tr¨ager-Chatterjee (christine.traeger-chatterjee@dwd.de)
Received: 27 February 2012 – Published in Nat. Hazards Earth Syst. Sci. Discuss.: – Revised: 21 December 2012 – Accepted: 11 March 2013 – Published: 16 May 2013
Abstract. Drought and heat waves during summer in mid-latitudes are a serious threat to human health and agricul-ture and have negative impacts on the infrastrucagricul-ture, such as problems in energy supply. The appearance of such extreme events is expected to increase with the progress of global warming. A better understanding of the development of ex-tremely hot and dry summers and the identification of possi-ble precursors could help improve existing seasonal forecasts in this regard, and could possibly lead to the development of early warning methods.
The development of extremely hot and dry summer sea-sons in central Europe is attributed to a combined effect of the dominance of anticyclonic weather regimes and soil moisture–atmosphere interactions. The atmospheric circula-tion largely determines the amount of solar irradiacircula-tion and the amount of precipitation in an area. These two variables are themselves major factors controlling the soil moisture. Thus, solar irradiation and precipitation are used as proxies to analyse extreme sunny and dry late winter/spring and sum-mer seasons for the period 1958–2011 in Germany and adja-cent areas.
For this purpose, solar irradiation data from the European Center for Medium Range Weather Forecast 40-yr and in-terim re-analysis dataset, as well as remote sensing data are used. Precipitation data are taken from the Global Precipita-tion Climatology Project. To analyse the atmospheric circu-lation geopotential data at 850 hPa are also taken from the European Center for Medium Range Weather Forecast 40-yr and interim re-analysis datasets.
For the years in which extreme summers in terms of high solar irradiation and low precipitation are identified,
the previous late winter/spring conditions of solar irradiation and precipitation in Germany and adjacent areas are anal-ysed. Results show that if the El Ni˜no–Southern Oscillation (ENSO) is not very intensely developed, extremely high so-lar irradiation amounts, together with extremely low precipi-tation amounts during late winter/spring, might serve as pre-cursor of extremely sunny and dry summer months to be ex-pected.
1 Introduction
Extremely hot and dry summers in (central) Europe have large negative socio-economic impacts: according to the World Health Organization (WHO) more then 70 000 death in 12 European countries could be attributed to heat stress during the summer of 2003 (World Health Organization (WHO), 2010). The extreme conditions during that summer caused an estimated loss of 1 billion Euros in the crop pro-duction of Germany (Munich Re Group, 2004), and the en-ergy sector had to cope with a lack of cooling water for power plants and an increased demand (F¨orster and Lillies-tam, 2010). It would thus be helpful if such events could be forecast well in advance in order to install precautionary and adaptation measures in due time. Understanding the reasons and/or identifying possible precursors would help to improve the forecast of such events.
However, according to recent publications, e.g. Weisheimer et al. (2011), state of the art climate mod-els have problems simulating summer heat waves associated with droughts. The results of Seneviratne et al. (2006) and
Vautard et al. (2007) for example, lead these authors to the conclusion that current state of the art climate models underestimate the importance of soil moisture–atmosphere feedbacks. Consequently, a lot of work has been done in recent years to better understand the processes that lead to such events (Della-Marta et al., 2007, and references therein). In this context, a lot of attention was attributed to the importance of soil moisture for the development of heat events. Seneviratne et al. (2006) found that the increase in temperature variability in central and eastern Europe, as projected by climate models, cannot exclusively be attributed to changes in the atmospheric circulation alone, but that land–atmosphere coupling needs to be accounted for. Recently Orth and Seneviratne (2012) pointed out the potential importance of soil moisture memory for the predictions of droughts and floods in Europe. Furthermore, Quesada et al. (2012) found that high precipitation amounts during winter and spring “inhibit hot summer days” in southern Europe, whereas summers after dry winter/spring seasons show either a “high or a low frequency of hot days” in this same region.
Quesada et al. (2012) further conclude that the occurrence of specific weather regimes in initially dry cases is impor-tant to the development of strong summer heat events. Other authors identified specific atmospheric circulations regimes over the North Atlantic that are connected to heat events in Europe. For example Cassou et al. (2005) attributed the oc-currence of hot days over France to what they call “blocking” and “atlantic low”. Where “blocking” refers to negative pres-sure anomalies over Greenland and high prespres-sure anomalies over Europe, and “Atlantic low” refers to negative pressure anomalies over the North Atlantic and positive anomalies over continental Europe. Others, for example Beniston and Diaz (2004), found that the large positive atmospheric pres-sure anomalies that lead to extreme summers, as the one in 2003, were associated with a northward shift of the Hadley circulation. Black et al. (2004) point to the northward dis-placement of the Azores high associated with a dominance of anticyclonic weather regimes, which was an important factor for the development of the 2003 European heat summer.
The aforementioned publications focus on specific factors associated with heat waves and droughts: either the synoptic scale meteorology, global circulations or the soil moisture– atmosphere feedbacks. As they all deal with similar extreme phenomena, it is likely that heat waves and droughts in cen-tral Europe are driven and affected by the combination of var-ious meteorological processes on different scales. The cur-rent paper aims to analyse and discuss the effect of the dif-ferent factors leading to heat waves and droughts in an inte-grated manner. The authors think that this approach provides new and additional insights into the development and pre-conditions of summer droughts and heat waves.
Solar irradiation and precipitation are driven by atmo-spheric dynamics: anticyclonic systems lead to high solar irradiation and low precipitation, cyclonic systems to the
opposite. Furthermore, solar irradiation and precipitation are the major drivers of soil moisture (e.g. Orth and Seneviratne 2012), which has been shown by various authors to be an im-portant factor in the development of heat waves (see above). In addition, solar irradiation is closely related to surface tem-perature during summer in central Europe (Makowski et al., 2009). Thus, these two variables are used as proxies to inte-gratively analyse heat and drought events during summer and prior late winter/spring conditions in central Europe.
As a central aspect in this study, the following hypoth-esis is analysed and discussed: late winter/spring months with positive anomalies in the incoming solar irradiation at the surface and negative anomalies in precipitation indicate the occurrence of extremely sunny (and thus hot) and dry subsequent summer season in central Europe. The analy-sis of this hypotheanaly-sis comprises discussion and analyanaly-sis of atmospheric dynamics on different scales as well as soil-moisture–atmosphere feedbacks and includes a literature re-view.
The paper is structured as follows: the data used are de-scribed in Sect. 2. The methods used to analyse the data are described in Sect. 3. The results of the analysis are presented in Sect. 4, whereas Sect. 4.1 deals with the analysis of so-lar irradiation and precipitation anomalies in the study area (47◦N–56◦N, 4◦E–15◦E), and anomalies in the geopoten-tial at 850 hPa over Europe, the Mediterranean, the North Sea, and the Bay of Biscay (35◦N–75◦N, −10◦E–25◦E). Section 4.2 contains the results referring to a possible influ-ence of the El Ni˜no–Southern Oscillation (ENSO) on Euro-pean late winter/spring and summer conditions. In Sect. 5 the major aspects of the analysis results are discussed in the context of previous and recent research. Section 6 provides a final summary of the paper.
2 Data
2.1 The solar irradiation dataset
The 23-yr climate data set of incoming solar irradiation at the surface (further referred to as solar irradiation) is based on the retrieval of cloud information from the METEOSAT Vis-ible and Infrared Imager (MVIRI) on board the METEOSAT first generation satellites. The retrieval is based on the He-liosat method described in detail in Hammer (2001) and Hammer et al. (2003).
Satellite Application Facility on Climate Monitoring (CM SAF) at www.cmsaf.eu and hereinafter referred to as MAG-ICSOL data set. The MAGMAG-ICSOL method, as well as the un-derlying Heliosat method, is well verified by various authors: Beyer et al. (2006), Drews (2007), Drews et al. (2008), Pos-selt et al. (2011), Journ´ee and Bertrand (2010). The accuracy of solar irradiation from MAGICSOL is found to be clearly better than 10 W m−2, and the dataset performs better than other well-known solar irradiation datasets, as for example Global Energy and Water Cycles Experiment (GEWEX) or International Satellite Cloud Climatology Project (ISCCP), (Tr¨ager-Chatterjee et al., 2010).
Since MVIRI data are not available before 1983 and after 2005, the MAGICSOL dataset is elongated using the Euro-pean Center for Medium Range Weather Forecast (ECMWF) 40-yr re-analysis dataset (ERA-40) (Uppala et al., 2005) for the period 1958–1982, ERA-interim for the year 2006, and from 2007 until 2011 the operational product of solar incom-ing radiation at the surface provided by CM SAF (M¨uller et al., 2009) (further referred to as CM SAF SIS) is used. It was shown by Tr¨ager-Chatterjee et al. (2010) that the ERA-40 solar irradiation dataset shows weaknesses in resolving some regional phenomena in the study area. However, since the focus of this study is on the average conditions in three monthly timescales and for the entire study area as a whole, the ERA-40 solar irradiation dataset is the best re-analysis dataset currently available for the study area, the time range in question and the context of this study. Other re-analysis datasets have not been used here for several reasons: the solar irradiation data of the ERA-interim re-analysis have a lower accuracy in the study area than ERA-40 (Tr¨ager-Chatterjee et al., 2010). The solar irradiation data of the re-analysis of the National Center for Environmental Prediction (NCEP)/National Center for Atmospheric Research (NCAR) have only limited accuracy on the regional scale (Babst et al., 2008). Further re-analysis datasets were either not yet avail-able at the time the study started (e.g. NCEP 20th century reanalysis) or the time range covered is not sufficient (e.g. the Modern Era Reanalysis for Research and Applications, MERRA). However, since ERA-40 ends in 2002 and CM SAF SIS data are not available before 2007, for the year 2006 ERA-interim data are used. December 1988 is substi-tuted by ERA-40 since this month is missing in the MAGIC-SOL dataset, because not as many images as required by the algorithm are available to calculate the monthly mean. This lack of images is presumably due to technical issues concern-ing the transition of METEOSAT-2 to METEOSAT-3 (L¨ust 1992; Eoportal.org 2002). Table 1 provides an overview of the composition of the solar irradiation dataset used here.
2.1.1 The precipitation dataset
The Global Precipitation Climatology Center (GPCC) hosted at Deutscher Wetterdienst (DWD) (http://gpcc.dwd.de) pro-vides gridded datasets of land-surface precipitation data with
Table 1. Composition of the solar irradiation dataset used in this
study. See Sect. 2.1 for abbreviations.
Time range Data source
Jan 1958–Dec 1982 ERA-40 Jan 1983–Nov 1988 MAGICSOL
Dec 1988 ERA-40
Jan 1989–Dec 2005 MAGICSOL Jan 2006–Dec 2006 ERA-interim Jan 2007–Dec 2011 CM SAF
global coverage. The datasets are based on in situ gauge measurements. The method of interpolating the gauge mea-surements is described in Rudolf and Schneider (2005). The products provided by GPCC are described in Schneider et al. (2011). The GPCC full data product version 6, available for the period January 1958 until December 2010, is used. The period January 2011 to December 2011 is covered by the monitoring product version 4. The monitoring product is based on station data distributed via the Global Telecommu-nications System (GTS) of the World Meteorological Orga-nization (WMO) and is available two months after the end of an analysis month (Schneider et al., 2011). The full data product is based on a larger number of stations than the mon-itoring product, the input data are quality controlled, and it is irregularly updated (GPCC, 2012).
2.2 The geopotential dataset
The geopotential in 850 hPa height was investigated for the time series 1958–2011 using the monthly mean of daily mean data from ERA-40 (1958–1988) (Uppala et al., 2005) and ERA-interim (1989–2011) (Dee et al., 2011).
2.3 El Ni ˜no–Southern Oscillation Index
since the peak of an ENSO event usually occurs “near the end of the year” (Sarachik and Cane, 2010, p. 9).
2.4 The soil moisture dataset
As supporting information, the ERA-40 (1958–1988) (Uppala et al., 2005) and ERA-interim (1989–2011) (Dee et al., 2011) monthly means of daily means of the parameter volumetric soil water are used. This parameter is available in 4 different layers: 0–0.07 m (level 1), 0.07–0.28 m (level 2), 0.2–0.7 m (level 3), and 0.7–1.9 m (level 4). The strongest variability, especially during the summer months, appears in level 1 and level 2, whereas the curves of these two levels are almost identical. It is therefore reasonable to use level 2 for the further analysis in this study.
However, Betts and Ball (1999) and Hirschi et al. (2006) found that ERA has problems correctly representing the an-nual cycle of soil water. To get a rough estimate on the qual-ity of the ERA soil water data in the study area, the variance coefficient for the late winter/spring mean values (Febru-ary/March/April mean) of the ERA time series (1958–2011) are compared to those of in situ measurements of two sta-tions in Germany: one near Gießen (GI) located at 50.85◦N and 8.69◦E, 172 m a.s.l. (available 1997–2010) and one of the station “Falkenberg” at the Meteorological Observatory Lindenberg (MOL) located at 52.17◦N, 14.12◦E, 73 m a.s.l. (available 2000–2010). The variance of the ERA data and the in situ measurements show large differences. For FMA/JJA the variance of the in situ measurements are about 0.1/0.15 (GI) and 0.13/0.34 (MOL) compared to values for the ERA data of 0.03/0.06 near GI and 0.03/0.07 near MOL. This in-dicates that ERA data might not be well suited for the anal-ysis of inter-seasonal variations. However, it is assumed that the general characteristics of the extreme events discussed here, i.e. the serious droughts during the summer months of the years in question, are reasonably captured.
3 Method
It is hypothesised that the most extreme summer seasons in terms of solar irradiation and drought in the study area comprising Germany and adjacent areas (47◦N–56◦N, 4◦E– 15◦E, see also Figs. 1 and 2) are preconditioned during the preceding late winter/spring months of the respective year. Here, late winter and spring are defined as Febru-ary/March/April (FMA) and FebruFebru-ary/March/April/May (FMAM), respectively.
To get a first impression on the relation of solar irradia-tion and precipitairradia-tion regimes in late winter/spring and the following summer season the lagged auto correlation coef-ficients according Pearson (Wilks, 2006, p. 50ff) are calcu-lated. The hypothesis that signals of approaching and ex-tremely sunny and dry summer seasons in central Europe
are visible in the preceding late winter/spring months is then tested applying the following analysis.
First, to account for the study area as a whole, the sums of the monthly means of solar irradiation and precipita-tion are determined. From these sums the regional means of the study area are calculated for the two late win-ter/spring seasons February/March/April (FMA) and Febru-ary/March/April/May (FMAM) and for the summer season June/July/August (JJA). The result is the seasonal region mean (SRM) defined as
SRM= X
season
(1
n×
n X
i=1
xi) (1)
where SRM is seasonal region mean;
season is the period of successive calender months;
nis the number of pixel/grid boxes within the study area;
iis the counter;
xi is the monthly mean value of parameter; xat pixel/grid boxiof the study area.
Second, to analyse the most extreme sunny and dry sum-mers regarding the characteristics of solar irradiation and precipitation during their preceding late winter/spring sea-son, the upper/lower percentiles of SRMJJA of solar irradia-tion and precipitairradia-tion are identified.
An extremely sunny and dry summer is defined as being among theX-th upper/lower percentile regarding SRMJJAof solar irradiation and precipitation at the same time. For the years with extremely sunny and dry summers, the preceding late winter/spring seasons FMA and FMAM, respectively, are analysed with regard to SRM of solar irradiation and pre-cipitation. The analysis is also performed regarding the sen-sitivity to the selection of theX-th percentile. Therefore two modes of analysis are applied:
– Analysis of highly extreme events: upper/lower 10th percentile of SRM of solar irradiation AND precipita-tion in late winter/spring and summer.
– Analysis of all extreme events: upper/lower 20th per-centile of SRM of solar irradiation AND precipitation in late winter/spring and summer.1
Based on the results of these two modes of analysis, the probability of occurrencepallof an extremely sunny and dry summer season in the entire 54-yr time series is calculated, as well as the probability of occurrencepprecondof such a sum-mer season after extremely sunny and dry late winter/spring seasons:
pall=n/Nall (2)
pprecond=n/Nextreme FMA(M) (3)
1Note that the highly extreme events are part of all extreme
4 6 8 10 12 14 48 50 52 54 56 FMA 1976
longitude, deg E
latitude
, deg N
−60 −40 −20 0 20 40 60 4 6 8 10 12 12 14 14 16
16 16
18
4 6 8 10 12 14
48 50 52 54 56 JJA 1976
longitude, deg E
−60 −40 −20 0 20 40 60 [W *m − 2 ] 0 5 10 5
10 15 15 20 25 30
4 6 8 10 12 14
48 50 52 54 56 FMA 1983
longitude, deg E
latitude
, deg N
−60 −40 −20 0 20 40 60 −18 −16 −16 −14 −14 −12 −12 −12 −10 −10
−10 −10
−8
−8
−6 −4 2 −2
4 6 8 10 12 14
48 50 52 54 56 JJA 1983
longitude, deg E
−60 −40 −20 0 20 40 60 [W *m − 2 ] 5 5 10 15 20 20 20 25 25 25
25
30
35
4 6 8 10 12 14
48 50 52 54 56 FMA 2003
longitude, deg E
latitude
, deg N
−60 −40 −20 0 20 40 60 5 10 10 10 10 15 15 15 15 20 20 25 25 30 35
4 6 8 10 12 14
48 50 52 54 56 JJA 2003
longitude, deg E
−60 −40 −20 0 20 40 60 [W *m − 2 ] 0
0 0 0 10
20
30 40
40
50
50 50
4 6 8 10 12 14
48 50 52 54 56 FMA 2011
longitude, deg E
latitude
, deg N
−60 −40 −20 0 20 40 60 15 15 15 15 20 20 25 25
25 25 25
30
30
4 6 8 10 12 14
48 50 52 54 56 JJA 2011
longitude, deg E
−60 −40 −20 0 20 40 60 [W *m − 2 ]
−20 −15 −10
−5
−5
−5 −5
0
0 5
5
5 5 5 5 10
10
15 15
Fig. 1. Seasonal anomaly of solar irradiation [Wm−2] in 1976, 1983, 2003, and 2011. Left column: FMA
anomaly, right column: JJA anomaly.
Fig. 1. Seasonal anomaly of solar irradiation (W m−2) in 1976, 1983, 2003, and 2011. Left column: FMA anomaly, right column: JJA
6 8 10 12 14
48
50
52
54
FMA 1976
longitude, deg E
latitude
, deg N
−100 −50 0 50 100
−120
−100 −80
−40
−40
−20
6 8 10 12 14
48
50
52
54
JJA 1976
longitude, deg E
−100 −50 0 50 100
[m
m
*m
o
n
th
−
1 ]
−120
−40
−40
−20
6 8 10 12 14
48
50
52
54
FMA 1983
longitude, deg E
latitude
, deg N
−100 −50 0 50 100
−120 −80 0
0 20
20
20
40
6 8 10 12 14
48
50
52
54
JJA 1983
longitude, deg E
−100 −50 0 50 100
[m
m
*m
o
n
th
−
1 ]
−120
−40
−40
−20
−20
0
6 8 10 12 14
48
50
52
54
FMA 2003
longitude, deg E
latitude
, deg N
−100 −50 0 50 100
−120
−20
−20
6 8 10 12 14
48
50
52
54
JJA 2003
longitude, deg E
−100 −50 0 50 100
[m
m
*m
o
n
th
−
1 ]
−120 −80
−40
−20
−20
−20
6 8 10 12 14
48
50
52
54
FMA 2011
longitude, deg E
latitude
, deg N
−100 −50 0 50 100
−120
−40
−40
−40 −20
6 8 10 12 14
48
50
52
54
JJA 2011
longitude, deg E
−100 −50 0 50 100
[m
m
*m
o
n
th
−
1 ]
−120
0 0
20
20 40 60 80
Fig. 2. Seasonal anomaly of precipitation [mm*month−1] in 1976, 1983, 2003, and 2011. Left column: FMA
anomaly, right column: JJA anomaly.
Fig. 2. Seasonal anomaly of precipitation (mm month−1) in 1976, 1983, 2003, and 2011. Left column: FMA anomaly, right column: JJA
1958 1962 1966 1970 1974 1978 1982 1986 1990 1994 1998 2002 2006 2010
Anomaly Solar Irr
adiation [Wm
−
2]
−150
−100
−50
0
50
100
150
Anomaly FMA Anomaly FMAM Anomaly JJA
x x
x x
x
1976 1983
1994
2003
2006
1959
1964 1974 1982
1993
1998
2011
Fig. 3. SRM anomalies of solar irradiation (W m−2) during FMA
(green), FMAM (blue), and JJA (red) in all years of the time series 1958–2011. Years marked with “x” are the 10 % with the highest SRMJJA anomalies in the time series. Years additionally marked with their date are discussed in Sect. 4 and/or Sect. 5.
where
pallis the probability of occurrence of an extremely sunny and dry summer in the entire 54-yr time series;
Nallis the number of all years in the time series;
nis the number of extremely sunny and dry summers;
pprecondis the probability of occurrence of an extremely sunny and dry summer after extremely sunny dry late win-ter/spring season;
Nextreme FMA(M)is the number of years in the time series with extremely sunny and dry summers.
In addition to the two surface parameters, the atmospheric circulation of the extreme years are analysed using the anomalies of geopotential in 850 hPa height of late win-ter/spring and summer. The seasonal anomalies of the geopo-tential are calculated as the deviation of the seasonal mean from the long-term seasonal mean of the 54-yr time range 1958–2011.
The results of the analysis described above are presented in the following section.
4 Results
The probability of occurrence of a hot and dry summer among the highly extreme events and among all extreme events is 0.05 and 0.09, respectively. The lagged autocor-relation coefficients of the SRM values between FMA(M) and the proceeding JJA are 0.21 (0.24) for solar irradiation and 0.1 (0.1) for precipitation regarding the entire time se-ries 1958–2011. However, these values are dominated by the majority of years in which no extremely hot and dry late win-ter/spring and summer seasons, respectively, occurred.
Figures 3 and 4 show the SRM anomalies for solar irra-diation and precipitation, respectively, for late winter/spring (green and blue, respectively) and summer (red). The five years with the largest positive (negative) anomalies in solar irradiation (precipitation) during summer are marked with an “x”. Summer seasons marked in both plots are regarded as (highly) extreme sunny and dry summers, i.e. 1976, 1983, and 2003. Two of these summers, namely 1976 and 2003, have preceding late winter/spring seasons with positive (neg-ative) anomalies in solar irradiation (precipitation), whereas in 1983 the anomalies of solar irradiation and precipitation have opposite signs during late winter/spring compared to the following JJA season. The extreme summers of 1976 and 2003 are discussed in detail in several publications, e.g. Sch¨ar and Jendritzky (2004), Deutscher Wetterdienst (1976), Deutscher Wetterdienst (2003). In contrast, the summer of 1983 is not discussed as much in the literature as the other two extreme events. However, it is mentioned in the analy-sis of European heat waves with respect to the influence of the tropical Atlantic of Cassou et al. (2005) in the context of ENSO influence (discussed later in this paper).
4.1 Regional anomaly analysis
The analysis of extremely sunny and dry summers and their preceding late winter/spring conditions is conducted regarding two definitions of late winter/spring: Febru-ary/March/April (FMA) and FebruFebru-ary/March/April/May (FMAM). The results for the two analysis modes applied are shown in Table 2, which accounts for all extreme events and highly extreme events, respectively, (see Sect. 3). Besides ex-tremely sunny and dry summer seasons with preceding sim-ilarly extremely sunny and dry FMA(M) seasons, the anal-ysis reveals two categories of years in which the FMA(M)– JJA connection, in terms of large solar irradiation excess and precipitation deficit does not exist in either season:
– A. Sunny and dry summers without preceding late win-ter/spring season with positive/negative anomalies in solar irradiation/precipitation.
1958 1961 1964 1967 1970 1973 1976 1979 1982 1985 1988 1991 1994 1997 2000 2003 2006 2009
Anomaly Precipitation [mm*month
−
1]
−150
−100
−50
0
50
100
150
Anomaly FMA Anomaly FMAM Anomaly JJA
x x
x x
x
1964 1973
1976
1983
2003
1959
1974 1982
1993
1994
1998
2011
Fig. 4. SRM anomalies of precipitation (mm month−1( during FMA
(green), FMAM (blue), and JJA (red) in all years of the time series 1958–2011. Years marked with “x” are the 10 % with the lowest SRMJJA anomalies in the time series. Years additionally marked with their date are discussed in Sect. 4 and/or Sect. 5.
events also reveals that (1) the highly extreme sunny and dry summer 1983 is not preceded by a highly extreme sunny and dry late winter/spring season (category A), and (2) the highly extreme late winter/spring season 2011 which is followed by normally sunny and wet summer (category B) (Table 2 and Figs. 3 and 4).
The analysis of all extreme events reveals that two (three) out of six extreme sunny and dry summers have preceding FMA(M) seasons showing similar anomalies in solar irradi-ation and precipitirradi-ation, respectively. Furthermore, the anal-ysis of all extreme events, filters six additional years with decoupled FMA/JJA seasons than the analysis of the highly extreme events: three of category A (1959, 1964, 1994) and three of category B (1974, 1982, 1993). Defining late win-ter/spring as FMAM, four additional years with decoupled late winter/spring seasons than in the analysis of the highly extreme events are found: two of category A (1964, 1994) and two of category B (1982, 1993). Analysing all extreme events, the probability for an extremely sunny and dry sum-mer to occur is 0.34 (0.5) after a similarly extreme FMA(M) season. However, both values are below the probability of oc-currence found in the analysis of the highly extreme events. For all extreme summer seasons, May has a positive effect in pre-conditioning.
Extremes leading to serious droughts and prolonged heat waves in central Europe are characterised by their low fre-quency of occurrence. Hence it should be expected that any pre-conditioning of extreme summers by late winter/spring conditions is more pronounced for the highly extreme events. The results support this assumption. Thus, for the remain-der of this paper we focus on the highly extreme events. As shown above, the inclusion of May does not affect the results.
May is therefore not considered for the late winter/spring conditions further on.
The analysis reveals that the highly extreme sunny and dry summers in the time series, 1976 and 2003, have pre-ceding FMA seasons with already large positive anomalies of solar irradiation and large negative anomalies of precipi-tation. In accordance with that, a clear positive anomaly of the geopotential is visible north of 45◦N and central Eu-rope, respectively, in FMA and JJA of both years, whereas the JJA anomaly is stronger in 1976 than in 2003 (Fig. 5). In FMA 1976 the positive geopotential anomaly reaches from the British Islands over the North Sea and enlarges in lati-tude direction towards Scandinavia and eastern Europe, cov-ering the Benelux and Germany. In the following summer season, the spatial extent of the strongest anomaly is reduced and covers mainly the British Islands, the North Sea, parts of northern France, Benelux, the northern half of Germany and large parts of Scandinavia. The anomaly in eastern Europe is reduced compared to the prior FMA. Also in 2003 the pos-itive geopotential anomaly is larger and more spread out in FMA than in JJA. Compared to 1976 the FMA anomaly of the geopotential is stronger, and the subsequent JJA anomaly is weaker but larger in its spatial extent, covering almost all of the Europe. The dominance of the high-pressure systems in FMA in 1976 and 2003 (Fig. 5) leads to enhanced solar irradiation values at the surface and less precipitation than normal (Figs. 1 and 2). These two factors enhance the evap-otranspiration and hence the drying of the soils. The already dry soils in late winter/spring, combined with the low pre-cipitation amounts throughout FMA and the following sum-mer months, result in extremely low soil moisture conditions (Fig. 6).2Under these conditions convective precipitation is not favoured and the negative precipitation anomaly, and thus also the negative soil moisture anomaly, further increases. Thus, the missing convection leads to an increased positive solar irradiation anomaly due to a lower cloud coverage than usual, which in turn leads to enhanced solar irradiation. The lack of soil moisture, together with the high amount of solar irradiation, most probably leads to a strong increase in sensi-ble heat flux and only a minor increase in latent heat flux, i.e. an increased Bowen ratio (Bowen, 1926), which in turn leads to even dryer soils (Fig. 7). This proposed mechanism is also supported by the findings of other authors: e.g. Zampieri and D’Andrea (2009) (see Sect. 5).
Even for the highly extreme late winter/spring and JJA sea-sons, respectively, two “disconnected” years are discovered: the highly extreme hot and dry summer of 1983 does not have a preceding sunny and dry late winter/spring, but the contrary (category A). In 2011 the FMA/JJA relation likewise behaves
2As stated in Sect. 2, the authors are aware that care must be
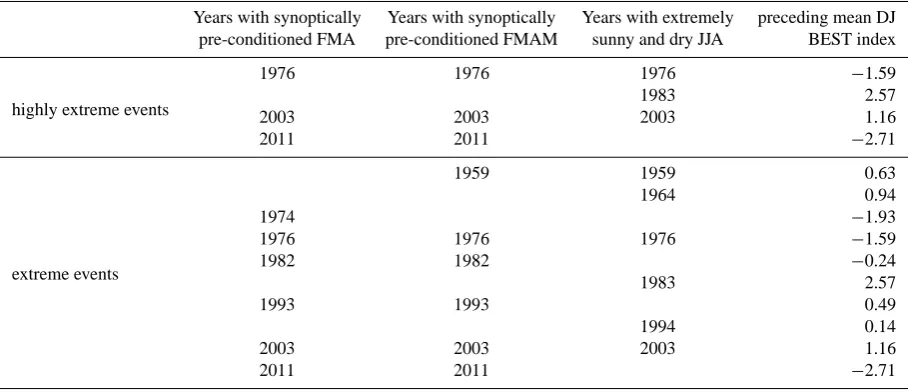
Table 2. Results of the analysis. Highly extreme events: upper/lower 10th percentile of solar irradiation/precipitation in FMA and JJA.
Extreme Events: upper/lower 20th percentile of solar irradiation/precipitation in FMA/FMAM and JJA.
Years with synoptically Years with synoptically Years with extremely preceding mean DJ pre-conditioned FMA pre-conditioned FMAM sunny and dry JJA BEST index
highly extreme events
1976 1976 1976 −1.59
1983 2.57
2003 2003 2003 1.16
2011 2011 −2.71
extreme events
1959 1959 0.63
1964 0.94
1974 −1.93
1976 1976 1976 −1.59
1982 1982 −0.24
1983 2.57
1993 1993 0.49
1994 0.14
2003 2003 2003 1.16
2011 2011 −2.71
the opposite: the highly extreme sunny and dry FMA season was followed by a close to normally sunny and rather rainy summer (category B). Logically also the geopotential anoma-lies in those years look opposite: 1983 is characterized by a negative anomaly in FMA and a clearly positive anomaly centered over the British Islands and the North Seas reaching northern France, Benelux, Germany, Denmark and southern Scandinavia and becoming weaker further east. The contrary is the case in 2011: FMA is characterized by a strong pos-itive geopotential anomaly centered over the northern half of Germany, Denmark and the North Sea and the following JJA is characterized by a negative geopotential anomaly cen-tered over the British Islands and covering most of Europe. The consequences of the geopotential anomalies in FMA and JJA in 1983 (2011) can be seen in Figs. 1 and 2: negative (positive) anomaly in solar irradiation, positive (negative) anomaly in precipitation during FMA and positive (negative) anomaly in solar irradiation, negative (positive) anomaly in precipitation in JJA.
A possible explanation for the “missing” FMA/JJA con-nection in these two years (despite the large anomalies in FMA (2011) and JJA (1983)) might be a “global” extreme climate event, which might lead to extreme seasons with-out synoptic-scale late winter/spring-summer connections of the extremes (as apparent in 1976 and 2003). Hence, the reason for the extremes in 1983 and 2011 might be forced by extremes in global oscillations and not by forces on synoptic scale. For such extremes it cannot be expected that connections/pre-conditions are apparent in the synoptic scale. This might explain the “disconnection” of late win-ter/spring and summer extremes in 1983 and 2011. Such a “global” extreme event could be the El Ni˜no Southern Os-cillation (ENSO). Its effect on extremes is discussed in the following subsection.
4.2 Potential impacts of regional and global circulation
anomalies
A measure for the state of the Southern Oscillation is the BEST index (Smith and Sardeshmukh, 2000) (Sect. 2). The mean BEST index of the December/January (DJ) season 1982/1983 was 2.57 (Table 2) (Sardeshmukh and Smith, 2012), indicating a strong El Ni˜no event prior to the ex-treme summer 1983, which is not pre-conditioned in late winter/spring. Cassou et al. (2005) speculate that the notably anomalous conditions during 1983 might be a consequence of the post-El Ni˜no influences in the western tropical Atlantic and over Africa. Alternatively, these ENSO-related telecon-nections might have affected the conditions during FMA 1983. At that time the geopotential anomaly is (slightly) neg-ative over the study area and adjacent regions, indicating a dominance of cyclonic conditions that result in a negative anomaly in solar irradiation and positive anomaly in precipi-tation (Figs. 1 and 2). A dominance of cyclonic conditions in southern and central Europe connected to El Ni˜no events is described by Fr¨adrich (1994), who found that this connection is strongest in January and February after the peak of the El Ni˜no event. This could explain why the summer of 1983 was extremely hot and dry, whereas the prior FMA season was dominated by cyclonic conditions with low values of solar irradiation and high amounts of precipitation and soil mois-ture.
−10 −5 0 5 10 15 20 25
35
45
55
65
FMA 1976
longitude, deg E
latitude
, deg N
−1000 −500 0 500 1000
−200 400
−10 −5 0 5 10 15 20 25
35
45
55
65
JJA 1976
longitude, deg E
−1000 −500 0 500 1000
[m
2s
−
2] 200
400
−10 −5 0 5 10 15 20 25
35
45
55
65
FMA 1983
longitude, deg E
latitude
, deg N
−1000 −500 0 500 1000
−10 −5 0 5 10 15 20 25
35
45
55
65
JJA 1983
longitude, deg E
−1000 −500 0 500 1000
[m
2s
−
2] −200 0
0
200 400
−10 −5 0 5 10 15 20 25
35
45
55
65
FMA 2003
longitude, deg E
latitude
, deg N
−1000 −500 0 500 1000
400 600
−10 −5 0 5 10 15 20 25
35
45
55
65
JJA 2003
longitude, deg E
−1000 −500 0 500 1000
[m
2s
−
2]
−10 −5 0 5 10 15 20 25
35
45
55
65
FMA 2011
longitude, deg E
latitude
, deg N
−1000 −500 0 500 1000
0 200 400
−10 −5 0 5 10 15 20 25
35
45
55
65
JJA 2011
longitude, deg E
−1000 −500 0 500 1000
[m
2s
−
2]
−200
Fig. 5. Seasonal anomaly of 850 hpa geopotential [m−2s−2] in 1976, 1983, 2003, and 2011. Left column:
FMA anomaly, right column: JJA anomaly.
28
Fig. 5. Seasonal anomaly of 850 hpa geopotential (m−2s−2) in 1976, 1983, 2003, and 2011. Left column: FMA anomaly, right column: JJA
anomaly.
irradiation and precipitation, relative to the mean of the pe-riod 1958–2011, are among the highest and lowest, respec-tively, in the time series. However, other than expected from the FMA conditions, the JJA anomaly in the geopotential over Europe is only slightly positive over parts of Scan-dinavia and close to normal and slightly negative, respec-tively, over most of Europe (Fig. 5). In the study area, the solar irradiation is overall close to normal and the positive precipitation anomaly is among the highest of the time se-ries (Figs. 3 and 4). These observations fit well with the
C. Tr¨ager-Chatterjee et al.: Analysis of extreme summers in central Europe 1253
1958 1961 1964 1967 1970 1973 1976 1979 1982 1985 1988 1991 1994 1997 2000 2003 2006 2009
Anomaly v
olumetr
ic soil w
ater [m
3m
−
3]
−0.10
−0.05
0.00
0.05
0.10
Anomaly FMA Anomaly FMAM Anomaly JJA
1976
1983
2003 2011
Fig. 6. SRM anomalies of volumetric soil water (m3m−3) during
FMA (green), FMAM (blue), and JJA (red) in all years of the time series 1958–2011. Years marked with their date are discussed in Sect. 4 and/or Sect. 5.
however, it is assumed that the cyclonic storm track during the 2010/2011 La Ni˜na event is shifted further north than during other events. The reason might be the strength of this event, reaching a BEST index of−3.02 in February 2011, which is the smallest monthly mean value in the time series since 1871–2011.
Investigating all the FMA and JJA seasons in the time series that have preceding DJ periods with absolute mean BEST indices of larger than 2 reveals one more year with an extreme ENSO event: 1997/1998, with a mean DJ BEST index of +2.23, indicating a strong El Ni˜no event. How-ever, 1998 is a rather inconspicuous year in the context of solar irradiation and precipitation anomalies in late win-ter/spring and summer. The late winwin-ter/spring season in 1998 shows close to neutral anomalies in precipitation (slightly positive SRMFMAanomaly and slightly negative SMRFMAM anomaly) and slightly negative anomalies in solar irradiation. The proceeding summer season (1998) had a clear negative anomaly of solar irradiation (Fig. 3) and a normal SRMJJA value of precipitation (Fig. 4).
4.3 Synthesis of the results
The relative short time frame of the datasets available lim-its the statistical evidence of the results presented. However, this handicap is reduced by an extensive analysis of the ap-parent extremes. The results are therefore not only based on statistics, but support the hypothesis that the following re-lationship exists: extremely sunny and dry summer seasons in central Europe are pre-conditioned/connected with respec-tive extremes in the preceding late winter/spring season on a synoptic scale. The late winter/spring conditions might in-dicate an equilibrium position of the system which persists
1958 1961 1964 1967 1970 1973 1976 1979 1982 1985 1988 1991 1994 1997 2000 2003 2006 2009
Anomaly v
olumetr
ic soil w
ater [m
3m
−
3]
−0.10
−0.05
0.00
0.05
1976
1983
2003 2011
Fig. 6. SRM anomalies of volumetric soil water [m3m−3] during FMA (white), FMAM (grey), and JJA (black)
in all years of the time series 1958-2011. Years marked with their date are discussed in section 4 and / or 5.
Fig. 7. Feedback loop solar irradiation - soil moisture.
29
Fig. 7. Feedback loop of solar irradiation–soil moisture.
into the summer season. The synoptic-scale connection of the late winter/spring and summer extremes might be useful to support the forecast of extreme droughts and prolonged heat waves in central Europe.
However, the analysis of the global system reveals that the synoptic-scale connection might be disturbed by large-scale atmospheric teleconnections with the ENSO circula-tion. If the DJ mean BEST index prior to the summer season is higher than +2, indicating a strong El Ni˜no event, it is not sure whether the upcoming JJA season might be extremely sunny and dry (1983) or not (1998), even if there was no such signal in the prior FMA season. On the other hand, if the DJ mean of the BEST index is below−2, the probability for the following JJA season to be extremely sunny and dry might not be enhanced, even if there is a clear signal for such an event based on the FMA conditions in solar irradiation and precipitation.
Taking the 54-yr time series investigated as the main unit, the probability of occurrence for a highly extreme sunny and dry summer, (see Sect. 3), is 0.05 (3 out of 54). In the case of a preceding highly extreme sunny and dry FMA season, the probability of occurrence of a highly extreme summer is raised by a factor of 13.4 to 0.67 (2 out of 3). Accounting for extreme ENSO conditions, which might disturb the possi-ble FMA/JJA connection, the probability of a highly extreme sunny and dry summer to occur after a highly extreme FMA seasons, given that no extremely strong ENSO conditions oc-curred in the respective winter season, is raised to 1 (2 out of 2).
5 Discussion
The results presented in Sect. 4 reveal that the most ex-treme sunny and dry summer seasons in the time series in-vestigated, 1976 and 2003, had preceding FMA seasons with extreme anomalies of solar irradiation and precipitation of the same sign as the following JJA season. In these two extreme years, the predominance of anticyclonic conditions during FMA, coming along with large anomalies in solar ir-radiation and precipitation, preconditions the subsequent ex-tremely sunny and dry summer seasons (JJA). The high solar irradiation and low precipitation values linked with the pre-conditioning enforce the positive feedback loop described in Sect. 4 and Fig. 7 (high solar irradiation – dry soils – en-hanced sensible heat flux and reduced latent heat flux – less rain/clouds – higher solar irradiation). This theory is well supported by the findings of several authors: Ratcliffe (1978) estimated that during the drought that hit the British Island in summer 1976, only 10 % of the solar energy available in June of that year was transformed into latent heat flux and about 90 % (as opposed to usually 53 %) to sensible heat flux. Koster et al. (2004) separated the impact of soil moisture and other factors influencing precipitation using atmospheric general circulation models. Koster et al. (2004) generated a global map of land–atmosphere coupling strength (their Fig. 1) based on atmospheric general circulation models. Even if central Europe is not a hot spot on this map, Koster et al. (2004) claim that soil moisture can be expected to in-fluence precipitation in regions where evapotranspiration is suitably high, but still sensible to soil moisture. By compar-ing regional climate simulations of a coupled atmosphere– land-surface model scheme to an uncoupled model scheme for selected summer heat waves in Europe, Fischer et al. (2007) estimated that land–atmosphere interactions over dry areas increase the number of heat days by 50–80 %. Wang et al. (2011) supported the findings of Fischer et al. (2007) by analysing observational data of the Mediterranean region. Zampieri and D’Andrea (2009) found that spring droughts in the Mediterranean favor the development of strong heat events in “temperate continental Europe”, and Hirschi et al. (2011) point out the importance of soil-moisture deficit for the development of strong heat waves in southeastern Eu-rope.
Although the land–atmosphere interactions seem to be an important trigger in the development of extremely sunny and dry summers, it is obvious that the occurrence of the predictor variables used here, solar irradiation and precip-itation, are related to specific circulation patterns in the ocean–atmosphere systems not considered in the presented phenomenological-driven model. For example, Cassou et al. (2005) found that two large-scale atmospheric circulation patterns that favour the occurrence of hot days in France: the so called “blocking” and the so called “Atlantic low”. The “blocking” refers to a positive North Atlantic Oscilla-tion (NAO+) pattern, i.e. negative anomaly over Greenland
and high pressure anomaly over Europe. During “blocking” conditions, extra-tropical frontal systems are deflected north-ward and suppress “the local convective instabilities, leading to light winds, dryness, clear skies and warming” (Cassou et al., 2005), whereas during an “Atlantic low”, strong neg-ative pressure anomalies occur over the north Atlantic and “weaker positive anomalies” over continental Europe and “the advection of warm air masses from northern Africa and the Mediterranean basin dominates” (Cassou et al., 2005). Spatio-temporal analyses have shown for instance that the heat wave in summer 2003 was related to large positive anomalies in the monthly 850 hPa pressure field, reaching towards the British Isles and showing a northward shift of the Hadley circulation (e.g. Beniston and Diaz 2004). This is now confirmed by the current study for the highly ex-treme heat waves of the record (Figs. 1, 2 and 5). In this context, Ogi et al. (2003, 2004a) revealed that these pressure anomalies are related to dipole structures in the North At-lantic pressure and sea level pressure fields, which relates to North Atlantic Oscillation (NAO) and the Arctic Oscillation (AO) pattern. By using results of spatial correlation analy-ses, they also stressed that there is a clear relation of winter, spring and summer circulation patterns influencing temper-ature anomalies over Europe and other regions. Ogi et al. (2004b) found that the seasonally varying Northern Annular Mode index (SV NAM index), which reflects AO/NAO con-ditions, in winter is highly correlated with pressure anoma-lies in summer over the British Isles, which are proven in this study to be related to the establishment of extreme sum-mer heat waves. The winter-sumsum-mer relations of atmospheric circulation patterns is hypothesised to be coupled with Arc-tic coast and Eurasia snow cover variability with feedbacks to temperature (Ogi et al., 2004b). Future research might in-vestigate if the inclusion of large-scale circulation mode (as NAM) could improve the prediction quality of heat waves.
Ni˜na can be made: during strong El Ni˜no conditions as ob-served in the winter month 1982/1983 (mean DJ Best index: 2.57) and 1997/1998 (mean DJ BEST 2.23), an extremely sunny and dry summer might occur (1983) or not (1998), al-though there is no signal in the FMA season observed. El Ni˜no-induced disturbances might be the reason for the de-coupling of FMA and JJA conditions in the case of extremely sunny and dry summer seasons. On the other hand, if ex-treme La Ni˜na conditions occur in the preceding DJ period, as in 2010/2011 (mean DJ BEST−2.71), the following sum-mer season might not be extremely sunny and dry (2011), although the FMA conditions show a clear sign for an tremely sunny and dry summer. In these situations the ex-treme FMA conditions might be due to the La Ni˜na induced large-scale disturbances, which might terminate as the ENSO conditions return back to “normal”. Thus the synoptic-scale late winter/spring-summer connection does not occur in post-extreme-La Ni˜na years.
The analysis presented is undertaken for the study area 47◦N–56◦N, 4◦E–15◦E. However, the findings might also be valid for other areas. For example Hirschi et al. (2011) found that drier surface conditions lead to an intensification of hot extremes in southeastern Europe; Barriopedro et al. (2011) came to similar conclusions for the hot summer of 2010 in western Russia, and Wang et al. (2011) found similar relationships in the Mediterranean. A first attempt to check if the results are valid for a larger area is made, by applying the methods described to the region 30◦N–70◦N,−20◦E– 70◦E (not shown). This larger area seems to be too large for an FMA/JJA relation in terms of solar irradiation excess and precipitation deficit. Within this larger area, many different mechanisms apply (different synoptic regimes at a time, dif-ferent regional phenomena), such that positive and negative anomalies of the variables in question equalize. However, as indicated by other authors, the mechanisms found might be valid for other areas within Europe other than the region un-der investigation in this study (Fischer et al. 2007, Wang et al. 2011, Hirschi et al. 2011, Zampieri and D’Andrea 2009, see above).
6 Conclusions and outlook
In this study the conditions of the late winter/spring seasons prior to extremely sunny and dry summers in central Europe are investigated using solar irradiation and precipitation as proxies. These two variables serve as proxies since (1) they are driven by synoptic-scale circulations and (2) they them-selves are important factors determining soil moisture (e.g. Orth and Seneviratne 2012). And both, synoptic-scale circu-lations (e.g. Cassou et al. 2005) as well as internal feedback mechanisms associated with soil moisture, are important in the development of extreme summer heat waves in central Europe (e.g. Seneviratne et al. 2006, Hirschi et al. 2011). The analysis is mainly based on observations of solar irradiation
derived from satellites (MAGICSOL) and re-analysis data (ERA-40/ERA-interim), and on in situ measurements of pre-cipitation (GPCC). A hypothesis is tested which states that summers with extremely high amounts of solar irradiation and large negative anomalies of precipitation in central Eu-rope are indicated by prior late winter/spring seasons that show the same direction of anomalies in these variables.
The results presented support this hypothesis for the highly extreme summer seasons regarding high amounts of solar irradiation and low amounts of precipitation. The predomi-nance of anticyclonic atmospheric circulation regimes seems to be a prerequisite for the development of very extreme sum-mers. However, the hypothesis is refuted in years following extremely strong La Ni˜na and El Ni˜no events. In these years the late winter/spring – summer connection of the dominance of anticyclonic conditions in central Europe seems to be dis-turbed. This fits well with findings published by other authors (Fr¨adrich 1990, Fr¨adrich 1994, Fr¨adrich and M¨uller 1992, and Cassou et al. 2005).
Recent publications of Ogi et al. (2003) and Cassou et al. (2005), describe some large-scale atmospheric circulation characteristics related to extreme summer conditions in Eu-rope. This large-scale atmospheric circulation regimes might induce the development of late winter/spring conditions with extremes in solar irradiation and precipitation, leading to soil moisture deficits and subsequently inducing the positive feedback-loop described in Sect. 4.1. If these conditions main in their basic characteristics throughout summer, or re-appear due to some kind of memory in the large-scale circu-lation, then extreme summers (as the ones in 1976 and 2003) develop. In other words, the soil-atmosphere feedback result-ing from certain large-scale atmospheric patterns might then foster and stabilize the conditions for highly extreme hot and dry summers in (central) Europe (see also Ratcliffe 1978 and Fischer et al. 2007).
However, global circulation anomalies connected to ex-treme ENSO events might disturb this interaction between synoptic-scale circulations and internal feedback mecha-nisms.
Based on the results presented, an early warning method for extreme summers in central Europe could possibly be de-veloped using the following row of decisions: if the ENSO in the winter (DJ) season prior to the summer in question is not in an extreme state (i.e. −2<mean DJ BEST index>+2) and if the SMRFMAvalues of solar irradiation and precipita-tion are within the upper and lower 10th percentile, respec-tively, a highly extreme sunny and dry summer with SRMJJA values of solar irradiation and precipitation exceeding the 90th percentile and undermining the 10th percentile, respec-tively, can be expected.
Acknowledgements. The work presented in this paper has been
partly funded by EUMETSAT in the context of the CM SAF as part of the Satellite Application Facilities Network. In this study, radiation parameters of the ECMWF re-analysis datasets ERA-40 (K˚allberg et al., 2005) and ERA-Interim (Berrisford et al., 2009) were used. They were obtained from the ECMWF MARS archive. The precipitation data used were obtained from the Global Precipitation Climatology Project hosted at Deutscher Wetterdienst in Offenbach, Germany (http://gpcc.dwd.de). The authors thank Ludger Gr¨unhage (University of Gießen) for providing soil moisture data of the Environmental Monitoring and Climate Impact Research Station Linden. Thanks to J¨org Trentmann and Uwe Pfeifroth for their support concerning the usage of the software “R” and fruitful discussions. Thanks to the anonymous reviewers for their constructive criticism and valuable hints to improve the paper.
Edited by: A. Mugnai
Reviewed by: three anonymous referees
References
Babst, F., M¨uller, R., and Hollmann, R.: Verification of NCEP Re-analysis Shortwave Radiation with Mesoscale Remote Sensing Data, Geosci. Remote Sens. Lett., 5, 34–37, 2008.
Barriopedro, D., Fischer, E., Luterbacher, J., Trigo, R., and Garc´ıa-Herrera, R.: The Hot Summer of 2010: Redrawing the Temperature Record Map of Europe, Science, 332, 222–224, doi:10.1126/science.1201224, 2011.
Beniston, M. and Diaz, H.: The 2003 heat wave as an example of summers in a greenhouse climate? Observations and climate model simulations for Basel, Switzerland, Global Planet. Chang., 44, 73–81, doi:10.1016/j.gloplacha.2004.06.006, 2004. Berrisford, P., Dee, D., Fielding, K., Fuentes, M., K˚allberg, P.,
Kobayashi, S., and Uppala, S.: The ERA-Interim Archive, Tech. rep., ERA Report Series No. 1, ECMWF: Reading, UK, available at www.ecmwf.int/publications (last access: 5 December 2012), 2009.
Betts, A. and Ball, J.: Basin scale surface water and energy budgets for the Mississipi from the ECMWF reanalysis, J. Geophys. Res., 104, 19293–19305, 1999.
Beyer, H., Drews, A., and Rindelhardt, U.: Irradiance Maps Applied for the Performance Assessment of PV Systems – A Case study for the German Federal State of Saxony, in: 21 European Photo-voltaic Solar Energy Conference, 4–8 September 2006, Dresden, Germany, 2006.
Black, E., Blackburn, M., Harrison, G., Hoskins, B., and Methven, J.: Factors contributing to the summer 2003 European heatwave, Weather, 59, 217–233, 2004.
Bowen, I.: The ratio of heat losses by conduction and by evaporation from any water sources, Physical Rev., 27, 779–787, 1926. Cassou, C., Terray, L., and Phillips, A.: Tropical Influence on
Euro-pean Heat Waves, J. Climate, 18, 2805–2811, 2005.
Dee, D. P., Uppala, S. M., Simmons, A. J., Berrisford, P., Poli, P., Kobayashi, S., Andrae, U., Balmaseda, M. A., Balsamo, G., Bauer, P., Bechtold, P., Beljaars, A. C. M., van de Berg, L., Bid-lot, J., Bormann, N., Delsol, C., Dragani, R., Fuentes, M., Geer, A. J., Haimberger, L., Healy, S. B., Hersbach, H., Holm, E. V., Isaksen, L., K˚allberg, P., Koehler, M., Matricardi, M., McNally, A. P., Monge-Sanz, B. M., Morcrette, J. J., Park, B. K., Peubey,
C., de Rosnay, P., Tavolato, C., Thepaut, J. N., and Vitart, F.: The ERA-Interim reanalysis: configuration and performance of the data assimilation system, Q. J. R. Meteorol. Soc., 137, 553–597, doi:10.1002/qj.828, 2011.
Della-Marta, P., Luterbacher, J., von Weissenfluh, H., Xoplaki, E., Brunet, M., and Wanner, H.: Summer heat waves over western Europe 1880-2003, their relationship to large-scale forcings and predictability, Clim. Dynam., 29, 251–275, doi:10.1007/s00382-007-0233-1, 2007.
Deutscher Wetterdienst: Monatlicher Witterungsbericht, Amtsblatt des Deutschen Wetterdienstes, Juni 1976; Juli 1976; August 1976, Tech. rep., Deutscher Wetterdienst, 1976.
Deutscher Wetterdienst: Witterungsreport, Juni 2003; Juli 2003; August 2003, Tech. rep., Deutscher Wetterdienst, 2003. Drews, A.: Preparation of a global radiation data set based
on the Heliosat method. Final report on the DWD-contract 30112583/07-HEL, available at: www.cmsaf.eu (last access: 10 December 2012) 2007.
Drews, A., Beyer, H., and Rindelhardt, U.: Quality of performance assessment of PV plants based on irradiance maps, Solar Energy, 82, 1067–5841, 2008.
Eoportal.org: Meteosat First Generation (MFG)s Spacecraft, avail-able at: http://events.eoportal.org/presentations/204/11737.html (last access: 5 October 2011), 2002.
Fischer, E., Seneviratne, S., L¨uthi, D., and Sch¨ar, C.: Con-tribution of land-atmosphere coupling to recent European summer heat waves, Geophys. Res. Lett., 34, L02202, doi:10.1029/2006GL029068, 2007.
F¨orster, H. and Lilliestam, J.: Modeling the thermoelectronic power generation in view of climate change, Regional Environ. Change, 10, 327–338, doi:10.1007/s10113-009-0104-x, 2010.
Fr¨adrich, K.: European Grosswetter during the warm and cold ex-tremes of the El Ni˜no/Southern Oscillation, Int. J. Climatol., 10, 21–31, 1990.
Fr¨adrich, K. and M¨uller, K.: Climate anomalies in Europe associ-ated with ENSO extremes, Int. J. Climatol., 12, 25–31, 1992. Fr¨adrich, K.: An ENSO impact on Europe?, Tellus, 46A, 541–552,
1994.
GPCC: GPCC Monitoring Product (Version 1 and 4), available at: http://gpcc.dwd.de (last access: 16 November 2012) , 2012. Hammer, A.: Anwendungsspezifische
Solarstrahlungsinformatio-nen aus Meteosat-Daten, Ph.D. thesis, Universit¨at Oldenburg, Uhlhornsweg 49–55, 26129 Oldenburg, 2001.
Hammer, A., Heinemann, D., Hoyer, C., Kuhlemann, R., Lorenz, E., M¨uller, R., and Beyer, H.: Solar Energy Assessment Using Remote Sensing Technologies, Remote Sens. Environ., 86, 423– 432, 2003.
Hirschi, M., Seneviratne, S., and Schaer, C.: Seasonal Variations in Terrestrial Water Storage for Major Midlatitude River Basins, J. Hydrometeorol., 7, 39–60, 2006.
Hirschi, M., Seneviratne, S., Alexandrov, V., Bober, F., Boroneant, C., Christensen, O., Formayer, H., Orlowksy, B., and Stepanek, P.: Observational evidence of soil-moisture impact on hot extremes in southeastern Europe, Nat. Geosci., 4, 17–21, doi:10.1038/NGEO1032, 2011.
K˚allberg, P., Simmons, A., Uppala, S., and Fuentes, M.: The ERA-40 Archive, ECMWF 2005, Tech. rep., ERA-ERA-40 Project Report Series No.17, available at http://www.ecmwf.int/publications/ library/do/references/list/192 (last access: 24 September 2012), 2005.
Koster, R., Dirmeyer, P., Zhichang, G., Bonan, G., Chan, E., Cox, P., Gordon, C., Kanae, S., Kowalczyk, E., Lawrence, D., Liu, P., Lu, C., Malyshev, S., McAvaney, B., Mitchell, K., Mocko, D., Oki, T., Oleson, K., Pitman, A., Sud, Y., Taylor, C., Verseghy, D., Vasic, R., Xue, Y., and Yamada, T.: Regions of Strong Coupling between Soil Moisture and Precipitation, Science, 305, 1138– 1140, doi:10.1126/science.1100217, 2004.
L¨ust, R.: Remote sensing from space: the European Space Agency’s achievements and current programmes, Int. J. Remote Sens., 13, 1023–1034, 1992.
Makowski, K., Jaeger, E., Chiacchio, M., and Wild, M.: On the relationship between diurnal temperature range and sur-face solar radiation in Europe, J. Geophys. Res., 114, D00D07, doi:10.1029/2008JD011104, 2009.
M¨uller, R., Matsoukas, C., Gratzki, A., Behr, H., and Hollmann, R.: The CM-SAF operational scheme for the satellite based retrieval of solar surface irradiance – A LUT base eigenvec-tor hybrid approach, Remote Sens. Environ., 113, 1012–1024, doi:10.1016/j.rse.2009.01.012, 2009.
Munich Re Group: Gesch¨aftsbericht der M¨unchener-R¨uck Gruppe 2003, 2004.
NOAA: El-Ni˜no/Southern Oscillation Indicators, available at: http: //www.ncdc.noaa.gov/teleconnections/enso/indicators/ (last ac-cess: 6 September 2011), 2010.
NOAA: El Ni˜no/Southern Oscillation, available at: http://www. noaa.gov/teleconnections/enso/ (last access: 1 November 2012), 2012.
Ogi, M., Tachibana, Y., and Yamazaki, K.: Impact of the win-terteime North Atlantic Oscillation (NAO) on the summer-time atmospheric circulation, Geophys. Res. Lett., 30, 1704, doi:10.1029/2003GL017280, 2003.
Ogi, M., Tachibana, Y., and Yamazaki, K.: The Connectivity of the Winter North Atlantic Oscillation (NAO) and the Sum-mer Okhotsk High, J. Meteorol. Soc. Jpn., 82, 905–913, doi:10.2151/jmsj.2004.905, 2004a.
Ogi, M., Yamazaki, K., and Tachibana, Y.: The summertime annular mode in the Northern Hemisphere and its link-age to the winter mode, J. Geophys. Res., 109, D20114, doi:10.1029/2004JD004514, 2004b.
Orth, R. and Seneviratne, S.: Analysis of soil moisture memory from observations in Europe, J. Geophys. Res., 117, D15115, doi:10.1029/2011JD017366, 2012.
Posselt, R., M¨uller, R., St¨ockli, R., and Trentmann, J.: Spa-tial and Temporal Homogeneity of Solar Surface Irradiance across Satellite Generations, Remote Sens., 3, 1029–1046, doi:10.3390/rs3051029, 2011.
Quesada, B., Vautars, R., Yiou, P., Hirschi, M., and Seneviratne, S.: Asymmetric European summer heat predictability from wet and dry southern winter and springs, Nat. Clima. Change, 2, 736– 741, doi:10.1038/NCLIMATE1536, 2012.
Ratcliffe, R.: Meteorological aspects of the 1975-76 drought, Proc. Roy. Soc. London, Series A, 363, 355–357, 1978.
Rudolf, B. and Schneider, U.: Calculation of gridded precipita-tion data for the global land-surface using in-situ gauge
observa-tions, in: 2nd Workshop of the International Precipitation Work-ing Group, 2005.
Sarachik, E. S. and Cane, M.: The El Ni˜no-Southern Oscillation Phenomenon, Cambridge University Press, 2010.
Sardeshmukh, P. and Smith, C.: Bivariate ENSO Time Series or the “BEST” ENSO Index, available at: http://www.esrl.noaa.gov/ psd/people/cathy.smith/best/#values (last access: August 2012), 2012.
Sch¨ar, C. and Jendritzky, G.: Hot news from summer 2003, Nature, 432, 559–560, 2004.
Schneider, U., Becker, A., Meyer-Christoffer, M., Ziese, A., and Rudolf, B.: Global Precipitation Ananlysis Products of the GPCC., Tech. rep., DWD Internet Publication, 1–13, available at: www.gpcc.dwd.de, 2011.
Seneviratne, S., L¨uthi, D., Litschi, M., and Sch¨ar, C.: Land-atmosphere coupling and climate change in Europe, Nature, 443, 205–209, doi:10.1038/nature05095, 2006.
Smith, C. and Sardeshmukh, P.: The Effect of ENSO on the In-traseasonal Variance of Surface Temperature in Winter, Int. J. Climatol., 20, 1543–1557, 2000.
Tr¨ager-Chatterjee, C., M¨uller, R. W., Trentmann, J., and Bendix, J.: Evaluation of ERA-40 and ERA-interim re-analysis incom-ing surface shortwave radiation datasets with mesoscale re-mote sensing data, Meteorol. Z., 19, 631–640, doi:10.1127/0941-2948/2010/0466, 2010.
Uppala, S., K˚allberg, P., Simmons, A., Andreae, U., Da Costa Bech-told, V., Firino, M., Gibson, J., Haseler, J., Hernandez, A., Kelly, G., Li, X., Onogi, K., Saarinen, S., Sokka, N., Allan, R., Ander-sson, E., Arpe, E., Balmaseda, M., Beljaars, A., Van de Berg, L., Bidlot, J., Bormann, N., Caires, S., Chevallier, F., Dethof, A., Dragosavac, M., Fisher, M., Fuentes, M., Hagemann, S., Holm, E., Hoskins, B., Isaksen, L., Janssen, P., Jenne, R., McNally, A., Mehfouf, J.-F., Morcrette, J.-J., Rayner, N., Saunders, R., Simon, P., Sterl, A., Trenberth, K., Untch, A., Vasiljevic, D., Viterbo, P., and Woollen, J.: The ERA-40 re-analysis, Q. J. R. Meteorol. Soc., 131, 2961–3012, 2005.
Vautard, R., Yiou, P., D’Andrea, F., de Noblet, N., Cassou, C., Polcher, J., Ciais, P., Kageyama, M., and Fan, Y.: Summer-time European heat and drought waves induced by winterSummer-time Mediterranean rainfall deficit, Geophys. Res. Lett., 34, L07711, doi:10.1029/2006GL028001, 2007.
Wang, G., Dolman, A. J., and Alessandri, A.: A summer climate regime over Europe modulated by the North Atlantic Oscilla-tion, Hydrol. Earth Syst. Sci., 15, 57–64, doi:10.5194/hess-15-57-2011, 2011.
Weisheimer, A., Doblas-Reyes, F., Jung, T., and Palmer, N.: On the predictability of the extreme summer 2003 over Europe, Geo-phys. Res. Lett., 38, L05704, doi:10.1029/2010GL046455, 2011. Wilks, D.: Statistical Methods in the Atmospheric Sciences,
Else-vier Academic Press, 2006.
World Health Organization (WHO): The solid facts on climate change an health, available at: http://www.euro.who.int/ data/ assets/pdf file/0010/95815/FS ParmaClosure.pdf (last access: 3 February 2012), 2010.