www.nat-hazards-earth-syst-sci.net/8/789/2008/ © Author(s) 2008. This work is distributed under the Creative Commons Attribution 3.0 License.
and Earth
System Sciences
Near-Real time analysis of seismic data of active volcanoes:
Software implementations of time sequence data analysis
J. Vila1,2, R. Ortiz3, M. T´arraga3, R. Maci`a2,4, A. Garc´ıa3, D. Kumar5, and A. M. Correig1,2
1Departament d’Astronomia i Meteorologia, Facultat de F´ısica, Universitat de Barcelona. Mart´ı Franqu`es, 1,
08028 Barcelona, Spain
2Laboratori d’Estudis Geof´ısics “Eduard Fontser`e“, Institut d’Estudis Catalans, Carme, 47, 08001 Barcelona, Spain 3Museo Nacional de Ciencias Naturales, Consejo Superior de Investigaciones Cient´ıficas, Jos´e Guti´errez Abascal, 2,
28006 Madrid, Spain
4Departament de Matem`atica Aplicada II, Universitat Polit`ecnica de Catalunya, Pla de Palau, 18, 08003 Barcelona, Spain 5Centre for Informatics and Systems, University of Coimbra, Polo II - Pinhal de Marrocos, 3030-290, Coimbra, Portugal
Received: 4 April 2008 – Revised: 30 June 2008 – Accepted: 30 June 2008 – Published: 31 July 2008
Abstract. This paper presents the development and applica-tions of a software-based quality control system that moni-tors volcano activity in near-real time. On the premise that external seismic manifestations provide information directly related to the internal status of a volcano, here we analyzed variations in background seismic noise. By continuous anal-ysis of variations in seismic waveforms, we detected clear indications of changes in the internal status. The applica-tion of this method to data recorded in Villarrica (Chile) and Tungurahua (Ecuador) volcanoes demonstrates that it is suit-able to be used as a forecasting tool. A recent application of this developed software-based quality control to the real-time monitoring of Teide – Pico Viejo volcanic complex (Spain) anticipated external episodes of volcanic activity, thus cor-roborating the advantages and capacity of the methodology when implemented as an automatic real-time procedure.
1 Introduction
One of the main goals of volcanologists is to forecast episodes of major activity. This study addresses the capac-ity of real-time (RT) monitoring of seismic data to provide information on which to base forecasts of volcanic activity.
Nowadays, seismic acquisition systems record data in RT and in continuous mode at high sampling rates, thus pro-viding data instantaneously. High sampling rate measure-ments contain information that can be extracted at a
com-Correspondence to: J. Vila ([email protected])
parable rate to other parameters. Some of the most rele-vant examples of these measurements are the Real-time Seis-mic Amplitude Measurement (RSAM) (Endo and Murray, 1991) and the Real-time Seismic Spectral Amplitude Mea-surement (SSAM) (Rogers and Stephens, 1995). These tech-niques offer the advantage that the time series obtained have lower sampling rates that can be readily compared with non-seismic data, thus simplifying and accelerating interpreta-tion.
RT computation has proved to be an excellent tool to ob-tain data to forecast volcanic activity. In this regard, RSAM techniques are widely used in many volcanoes and have shown excellent performance (Sparks, 2003). At present, seismic data acquisition systems are based mainly on soft-ware programmes for computers and their CPU clock allows time to perform RT analysis and data acquisition simultane-ously.
any implemented state-of-health channels. Here we present a proposal of a preliminary analysis that selects fixed length segments from the already built basic database format, as-signs time on the basis of each segment and applies various data analysis subroutines.
The QC implementation subroutines compute parameters that involve both time and frequency domain values. After the extraction (or collection) of raw data from the pool of continuous data into segments of a fixed length, average am-plitude and average square amam-plitude in the time domain are obtained for each segment. The frequency domain procedure of the analysis uses a Power Spectral Density (PSD) estima-tion of the ground acceleraestima-tion. For each segment, the PSD is estimated using periodogram averaging (Welch, 1967). Only positive frequencies are taken into account (so-called one-sided PSD) to compare the PSD with the USGS’s High Noise Model (NLNM) and Low Noise Model (NLNM) (Peterson, 1993). PSD values are smoothed slightly by taking the aver-age PSD values in a constant relative band width of 1/10 of a decade. The PSD is deconvolved with the instrument re-sponse to convert the PSD from digital counts [counts2/Hz] into ground acceleration units [m2/s4/Hz].
The PSD of each segment is integrated in diverse fre-quency bands to give information on how the energy is dis-tributed in the spectrum and it is stored as function of time. For selected frequencies the PSD is also stored as function of time. Both the selected frequencies and frequency bands can be adapted to the specific requirements of the study. Finally, the bottom envelope of PSD is tracked and updated after the processing of a new segment, thus giving an estimation of all non-transient signals present during the period of opera-tion. This envelope is stored after one full day of operation, shows the lowest noise measured at each frequency and is a reference of the minimum levels of daily activity (Vila et al., 2006; Sleeman and Vila, 2007).
The newly created time series (selected frequencies and PSD integrations as function of time) have a sampling rate es-tablished by the length of the time interval considered as put data. These time series are suitable to be used as new in-put for any supplementary near real-time (NRT) analysis and to be compared with state-of-health, weather/environmental data or data from other surveillance systems, such as defor-mation, temperature and gas emission, for multi-disciplinary analysis. The lower sampling rates of the new time series also allow fast and easier representation, thereby facilitating
3 Application to volcano monitoring
Although volcanology involves many disciplines, the study of seismic activity is still the most used surveillance method-ology. Rock fracturing, magma transfer, bubble interactions, etc., cause seismic signals that can be monitored and ana-lyzed in RT. The classical methods to study seismicity as-sociated with volcanic phenomena address discrete informa-tion (events) and its classificainforma-tion in categories (Minakami, 1974). However, not only the transitory seismic signals pro-vide insights on the internal status of a volcano, but also the continuously generated background noise
Seismic phenomena usually generate signals with well characterized frequencies. The behavior of these frequencies may provide early warning of internal changes, for instance, occurrence and/or shifts of predominant frequencies. Many times signs of activity reported in frequency domain can be inappreciable in a time domain analysis. The most adequate frequency components and frequency bands to be monitored may depend on particular situations that are not evident until the data analysis is in progress.
In the following section we present two “a posteriori” ex-amples (Villarrica, Chile and Tungurahua, Ecuador) in which the potential capacity of QC implementation is shown and its application to Teide – Pico Viejo volcanic complex (Spain) in RT is described.
3.1 Villarrica volcano
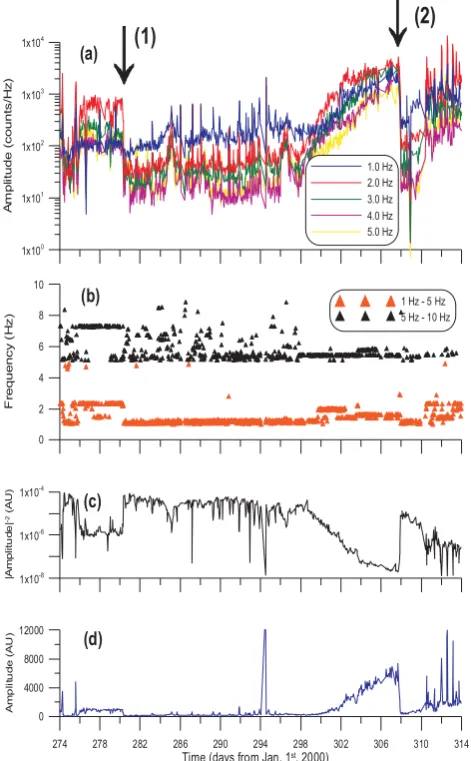
Figure 1 displays the application of a QC method to data recorded in Villarrica volcano (Chile) in 2000. Plot (a) shows the evolution of the amplitudes of several selected frequen-cies, and plot (b) the evolution of the frequencies in which the maximum occurs in bands 1–5 Hz and 5–10 Hz. Plot (c) dis-plays the inverse of the integrated square amplitude in time domain and plot (d) the evolution of the maximum spectral amplitude in the frequency band 1–10 Hz. All graphs display changes in behavior before an explosive episode as a con-sequence of plug removal (arrow 1) and as a culmination of increased internal activity (arrow 2), as reported by Ortiz et al. (2003) and T´arraga et al. (2006a).
Fig. 1. Villarrica volcano: Evolution of several output parameters
provided by the QC system. The two arrows indicate the end of reported eruptive episodes. Time axis is common to all four plots (see text for details).
produce an explosion episode (arrows). As presented in Or-tiz et al. (2003), the eruption was forecasted by means of a material failure forecasting method (FFM) (Voight, 1988; De la Cruz-Reyna and Reyes-D´avila, 2001).
In the case of outputs related to predominant frequencies (Fig. 1b), the analysis also shows that changes are displayed as sudden shifts on the plots. Before the reported eruptive episodes, clear changes are observed. In a RT analysis these changes may be useful to provide a first-order alarm.
Inspection of the behavior of predominant frequencies in diverse frequency bands can determine the frequency range that is most sensitive to variations in volcanic activity in each stage. Once determined, a focused analysis of these sensitive frequencies can be performed.
Fig. 2. Tungurahua volcano: 24-h seismic record of 20 August
2003. Amplitudes in arbitrary units.
Apart from the general trends of precursory activity, Fig. 1b reveals further significant information. Large disper-sions in the frequencies at which the maximum occurs imply low differences between values of amplitude in the selected frequency interval. Low dispersions indicate that an evident source dominates the frequency band, independently of its absolute amplitude. Before the moment in time marked by arrows (1) and (2), Fig. 1b displays incoming new and well defined input signals. This is not only seen in the frequency band 1–5 Hz, but also in the 5–10 Hz band. In the case of the second episode, this new incoming signal appears more than two days before its detection in the 1–5 Hz band.
In Fig. 1b the shift of the predominant frequency between 1.0 Hz and 5.0 Hz (time axis 299.6) coincides with the inflex-ion of the maximum amplitude in the same frequency band, whereas the shift that appears in the 5–10 Hz band coincides with the change in the behavior of Fig. 1c, which is related to the energy released.
3.2 Tungurahua volcano
The 2003 annual report of Tungurahua volcano (IGEPN, 2004) describes that the seismic activity before 20 August 2003 was low and the unrest activity of the volcano was clas-sified as of low energy. Figure 2 shows the seismic record of 20 August 2003, in which a tectonic earthquake (A) of mag-nitude 4.5 located close to the volcanic edifice is registered. Seven hours later (C), an increase in volcanic activity started and it lasted for several days.
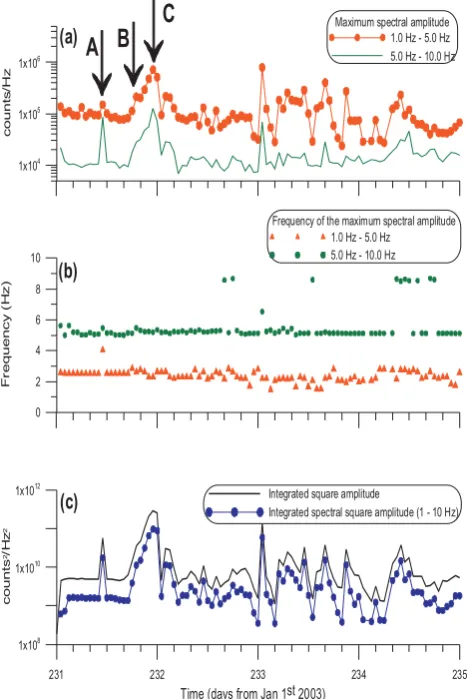
Fig. 3. Tungurahua volcano: Evolution of several output parameters
provided by the QC system. Arrows A, B and C coincide with A, B and C in Fig. 2. Time axis is common to all three plots (see text for details).
1–5 Hz and 5–10 Hz respectively. Figure 3c shows the inte-grated square amplitude and the inteinte-grated spectral square amplitude in the frequency band 1–10 Hz.
The behavior described in Fig. 3 (Tungurahua volcano) differs significantly from that observed for Villarrica vol-cano. In the present case, the perturbation produced by the tectonic earthquake modifies the “stationary” unrest. This is detected mainly in the seismic amplitudes both in time and in frequency domain but the frequency of the maximum peak is not sensitive to the increase in volcanic activity, Fig. 3b. However, Fig. 3a and c indicate a change in behavior, which can not be identified by visual inspection of the daily seismo-gram in time domain presented in Fig. 2. Figure 3 indicates that 5 h after the tectonic earthquake (arrow A), the param-eters related to seismic energy start increasing continuously (arrow B) and the change in the behavior can be appreciated in the seismic record 2 h later (arrow C).
oscillations can be appreciated. These could indicate that the system is returning to levels of internal activity close to those present before 20 August. However, Fig. 3b shows a new predominant frequency around 8.5 Hz clearly visible on 23 August. This frequency persists noticeably while amplitudes appear to return to their initial stage. The presence of new frequencies may indicate that the system is being affected by another phenomenon. According to IGEPN (2004), the biggest explosions of the cycle occurred on 25 August, just after the time interval shown in Fig. 3.
3.3 Teide – Pico Viejo volcanic complex
After more than 30 years of seismic and volcanic quiescence, at the end of 2003 the region around the Canary Islands (Spain) started to show signs of seismic and volcanic activ-ity (Garc´ıa et al., 2006), in particular in the northern part of the island of Tenerife. Moreover, the seismic noise recorded in Tenerife since 2004 contains signals of possible volcanic origin (Carniel et al., 2008a, 2008b; T´arraga et al., 2006b; T´arraga, 2007) and a clear interaction between seismic events and the continuous background noise seismic signals has been reported (T´arraga et al., 2006b). These observations provided the starting point of a project to detect any sign that could provide an indication of an early stage volcanic episode. Given the increase in seismic activity observed in Tenerife, the first part of the study addressed the develop-ment and impledevelop-mentation of a seismic monitoring system.
The experience and promising results obtained from the “a posteriori” test performed in Villarrica and Tungurahua vol-canoes led to the installation of a RT QC system in Teide – Pico Viejo volcanic complex. This system is designed to monitor changes in the behavior of the seismic signals in or-der to determine whether changes in the background noise status reveal variations in local response caused by alter-ations in volcanic activity.
has proven very useful to track changes in the behavior of processes (Garc´ıa et al., 2006).
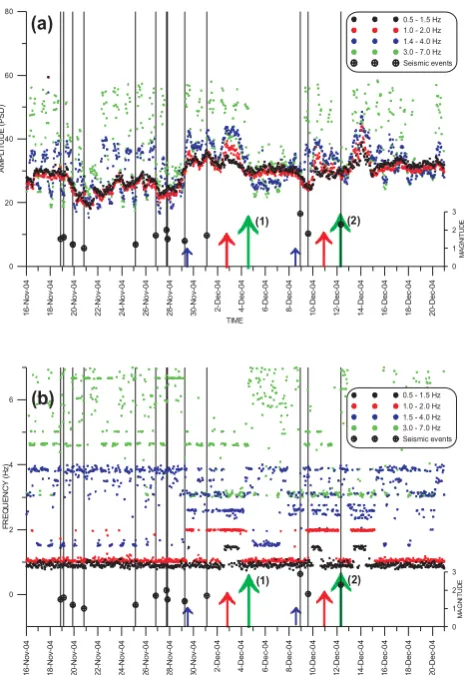
Figure 4a displays the evolution of the integrated PSD am-plitude and Fig. 4b the evolution of the frequency at which the maximum occurs in diverse frequency bands, together with the occurrence of seismic events, as reported by the Spanish National Agency IGN (http://www.geo.ign.es). A relevant example of the utility of RT monitoring can be ap-preciated from the output series of the TISS on 29 November 2004, which shows a systematic increase of energy in every frequency band. On 5 December 2004, a fumarole emission (largest green arrow 1) appeared in La Orotava valley (north-eastern flank of Teide – Pico Viejo volcanic complex) and several local seismic events with magnitudes from 1.4 to 2.0 were registered during the following days. The changes in the internal status of the volcanic system (smaller blue ar-rows) are identified in Fig. 4b. Thanks to the RT monitoring, warnings (red medium size arrows) were issued in advance of the occurrence of the two phenomena.
4 Discussion and conclusions
A volcanic eruption occurs when magma or gas, which have migrated through the lithosphere and the volcanic edifice, are released from the earth’s crust. Before the external surface manifestation, this matter and heat transfer produce physi-cal and chemiphysi-cal phenomena that can be detected by instru-ments. These are precisely the signals that contribute to fore-casting eruptions.
QC procedures to identify changes in seismic behavior of active volcanoes provide an excellent tool to complement other surveillance techniques based on diverse monitoring methodologies. The off-line application of a QC system to data recorded in Villarrica and in Tungurahua volcanoes demonstrated that changes in seismic behavior show good correspondence to eruptive episodes. After the reactivation of Teide - Pico Viejo volcanic complex, a RT monitoring sys-tem was set up with the aim to collect results almost simul-taneously with the data acquisition processes.
Preliminary results of its application in RT demonstrate the usefulness of the QC methodology to provide indications of changes in the internal status of a volcano. It is worth mentioning that the current activity status of Teide – Pico Viejo volcanic complex can not be considered as high as that of Tungurahua or Villarrica. Thus the detection capacity of the QC procedures based on the analysis of background noise at its lowest levels is accentuated.
On the basis of the results obtained in the present study, we propose that frequency be considered one of the most signifi-cant indicators of changes in dynamical systems, as shown in Figs. 1b, 3b and 4b. Analysis of the shifts of predominant fre-quencies provides unambiguous information and may indi-cate the start of internal phenomena, as previously described
Fig. 4. Time evolution of the integrated spectral square amplitude (a) and predominant frequency (b) in several frequency bands, as
provided by the RT QC system specifically developed to monitor the status of Teide – Pico Viejo volcanic complex. Vertical lines indicate the occurrence of seismic events, represented by circled crosses (see text for details).
in seismic quality control systems (Llobet et al., 2003) and also reported in Rogers and Stephens (1995).
Here we have reported a close association between changes in the behavior of the spectral amplitude and vol-canic unrest, see e.g. Figs. 1d, 3a, and 4a. The conjunction of several of the outputs displayed in Figs. 1, 3 and 4, and a selection of the most appropriate channels may result in a considerable improvement in the confidence levels of RT analysis for volcano surveillance purposes.
A beta version of the software package can be provided on request to the corresponding author. We thank Joan Mart´ı for his suggestions during the preparation of the paper. Octavi Fors and Sergi Obon were of great assistance “in situ”. Hugo Moreno (OVDAS-SERNAGEOMIN) and Minard Hall (IGEPN) provided data collection support for the volcanoes in Chile and Ecuador. This research was supported in part by the Spanish Ministry of Ed-ucation and Science via Grants CGL2003-21643-E-TEGETEIDE, CGL-2005-25066-E-METOTEIDE and HG2004-0022, and by the EC via Grants EVG1-2000-0574-MULTIMO and VR1-CT-2001-40021 E-RUPTION. Contribution no.312 of the Departament d’Astronomia i Meteorologia of the Universitat de Barcelona.
Edited by: J. Mart´ı
Reviewed by: R. Carniel and S. De la Cruz-Reyna
References
Carniel, R., T´arraga, M., Barazza, F., Garc´ıa, A., Possible interac-tion between tectonic events and seismic noise at Las Ca˜nadas volcanic caldera, Tenerife, Spain, Bull. Volcanol., Online first, doi:10.1007/s00445-007-0193-7, 2008a.
Carniel, R., T´arraga, M., Jaquet, O., Ortiz, R., Garc´ıa, A.: The seismic noise at Las Ca˜nadas volcanic caldera, Tenerife, Spain: Persistence characterization, and possible relationship with re-gional tectonic events, J. Volcanol. Geotherm. Res., 173, 157– 164, 2008b.
De la Cruz-Reyna, S. and Reyes-D´avila, G. A.: A model to describe precursory material-failure phenomena: applications short-term forecasting at Colima volcano, Mexico, Bull. Volcanol., 63, 297– 308, 2001.
Endo, E. T. and Murray, T.: Real-time Seismic Amplitude Measure-ment (RSAM): A Volcano Monitoring and Prediction tool, Bull. Volcanol., 53, 533–545, 1991.
ESF-EVOP Working Group: Automated Systems for Volcano Monitoring, European Science Foundation, Strasbourg, France, EVOP Monograph 2, 20 pp., 1994.
Garc´ıa, A., Vila, J., Ortiz, R., Macia, R., Sleeman, R., Marrero, J. M., S´anchez, N., T´arraga, M., and Correig, A. M.: Monitoring the Reawakening of Canary Islands’ Teide Volcano, EOS, Trans-action American Geophysical Union, 87(6), 61–65, 2006. Hill, D. P., Pollitz, F. and Newhall, C.: Earthquake-Volcano
Inter-actions, Physics Today, 55(11) 41–47, November 2002.
Minakami, T.: Seismology of volcanoes in Japan, in: Develop-ments in solid earth geophysics, Physical volcanology, edited by: Civetta, L., Gasparini, P., Luongo, G., and Rapolla, A., Elsevier, Amsterdam, 1–27, 1974.
Ortiz, R., Moreno, H., Garc´ıa, A., Fuentealba, G., Astiz, M., Pe˜na, P., S´anchez, N. and T´arraga, M.: Villarrica volcano (Chile): characteristics of the volcanic tremor and forecasting of small explosions by means of a material failure method, J. Volcanol. Geotherm. Res., 128, 247–259, 2003.
Peterson, J.: Observations and Modelling of Seismic Background Noise, US Department of Interior Geological Survey, Albu-querque, New Mexico, USA, Open-File Report 93-322, 95 pp., 1993.
Rogers, J. A. and Stephens, C. D.: SSAM: Real-Time Seismic Spec-tral Amplitude Measurements on a PC and its Application to Vol-cano Monitoring, Bull. Seism. Soc. Am., 852, 632–639, 1995. Sleeman, R. and Vila, J.: Towards an Automated Uniform Quality
Control of the Virtual European Broadband Seismograph Net-work (VEBSN), Orfeus Electronic Newsletter, 7(1), p. 5, 2007. Sparks, R. S. J.: Forecasting Volcanic Eruptions, Earth Planet. Sci.
Lett., 210, 1–15, 2003.
T´arraga, M., Carniel, R., Ortiz, R., Garc´ıa, A., Moreno, H.: A dynamical analysis of the seismic activity of Villarrica volcano (Chile) during September – October 2000, Chaos Solitons and Fractals, Elsevier, 37(5), 1292–1299, 2006a.
T´arraga, M., Carniel, R., Ortiz, R., Marrero, J. M., Garc´ıa, A.: On the predictability of volcano-tectonic events by low frequency seismic noise analysis at Teide-Pico Viejo volcanic complex, Ca-nary Islands, Nat. Hazards Earth Syst. Sci., 6, 365–376, 2006b, http://www.nat-hazards-earth-syst-sci.net/6/365/2006/.
T´arraga M.: An´alisis din´amicos de series sismo-volc´anicas, Estudio de los volcanes Vilarrica, Tungurahua, Stromboli y Teide, Ph.D. Thesis, Universidad Complutense de Madrid, 205 pp., 2007. Vila, J., Maci`a, R., Kumar, D., Ortiz, R., Moreno, H., and Correig,
A. M.: Analysis of the Unrest of Active Volcanoes by means of Variations of the Base Level Noise Seismic Spectrum, J. Vol-canol. Geotherm. Res., 153, 11–20, 2006.
Voight, B.: A method for prediction of volcanic eruptions, Nature, 332, 125–130, 1988.