www.nat-hazards-earth-syst-sci.net/10/1037/2010/ doi:10.5194/nhess-10-1037-2010
© Author(s) 2010. CC Attribution 3.0 License.
and Earth
System Sciences
Characterisation of extreme winter precipitation in Mediterranean
coastal sites and associated anomalous atmospheric circulation
patterns
A. Toreti1,2,3, E. Xoplaki1,4, D. Maraun5, F. G. Kuglitsch1,2, H. Wanner1,2, and J. Luterbacher5 1Institute of Geography, Climatology and Meteorology, University of Bern, Bern, Switzerland 2Oeschger Centre for Climate Change Research (OCCR), University of Bern, Bern, Switzerland 3Istituto Superiore per la Protezione e la Ricerca Ambientale (ISPRA), Rome, Italy
4The Cyprus Institute, EEWRC, Nicosia, Cyprus
5Department of Geography, Climatology, Climate Dynamics and Climate Change, Justus-Liebig University of Giessen, Giessen, Germany
Received: 31 January 2010 – Revised: 17 April 2010 – Accepted: 24 April 2010 – Published: 20 May 2010
Abstract. We present an analysis of daily extreme pre-cipitation events for the extended winter season (October– March) at 20 Mediterranean coastal sites covering the pe-riod 1950–2006. The heavy tailed behaviour of precipita-tion extremes and estimated return levels, including associ-ated uncertainties, are derived applying a procedure based on the Generalized Pareto Distribution, in combination with recently developed methods. Precipitation extremes have an important contribution to make seasonal totals (approx-imately 60% for all series). Three stations (one in the west-ern Mediterranean and the others in the eastwest-ern basin) have a 5-year return level above 100 mm, while the lowest value (estimated for two Italian series) is equal to 58 mm. As for the 50-year return level, an Italian station (Genoa) has the highest value of 264 mm, while the other values range from 82 to 200 mm. Furthermore, six series (from stations lo-cated in France, Italy, Greece, and Cyprus) show a signif-icant negative tendency in the probability of observing an extreme event. The relationship between extreme precipi-tation events and the large scale atmospheric circulation at the upper, mid and low troposphere is investigated by using NCEP/NCAR reanalysis data. A 2-step classification proce-dure identifies three significant anomaly patterns both for the western-central and eastern part of the Mediterranean basin. In the western Mediterranean, the anomalous southwesterly surface to mid-tropospheric flow is connected with enhanced
Correspondence to: A. Toreti
(toreti@giub.unibe.ch)
moisture transport from the Atlantic. During ≥5-year re-turn level events, the subtropical jet stream axis is aligned with the African coastline and interacts with the eddy-driven jet stream. This is connected with enhanced large scale as-cending motions, instability and leads to the development of severe precipitation events. For the eastern Mediterranean extreme precipitation events, the identified anomaly patterns suggest warm air advection connected with anomalous as-cent motions and an increase of the low- to mid-tropospheric moisture. Furthermore, the jet stream position (during ≥5-year return level events) supports the eastern basin being in a divergence area, where ascent motions are favoured. Our results contribute to an improved understanding of daily pre-cipitation extremes in the cold season and associated large scale atmospheric features.
1 Introduction
Between 1950 and October 2009, 395 severe flood and storm events were reported by EM-DAT (2009) for 19 Mediterranean countries. EM-DAT (2009) reports only the most severe events, while the combined criteria for an extreme event are over nine fatalities and 99 affected, dec-laration of the emergency state and a call for international assistance. The estimated cost of damage for these severe events was approximately 64 billion US dollars, together with 9904 fatalities and about 12 million injured, homeless or people that required immediate assistance (EM-DAT, 2009). Monthly, seasonal and annual series of precipitation totals were analysed for Mediterranean countries in several stud-ies (e.g., Brunetti et al., 2006; De Luis et al., 2009; Toreti et al., 2009; T¨urkes et al., 2009; del R´ıo et al., 2010). The behaviour of the Mediterranean winter precipitation during the 20th century does not show a clear spatial pattern (in terms of trend), but differences due to the influence of lo-cal and regional factors as well (e.g., Gonz´alez-Hidalgo et al., 2001; Xoplaki et al., 2004; Foley et al., 2005). The anal-ysis of extreme precipitation events is a complex task and it was often studied by using indices (e.g., Frich et al., 2002; Klein Tank and K¨onnen, 2003; Haylock and Goodess, 2004; Kostopoulou and Jones, 2005; Zhang et al., 2005; Gallego et al., 2006; Moberg et al., 2006; Norrant and Dougu´edroit, 2006; Brunet et al., 2007; Rodrigo and Trigo, 2007; Costa and Soares, 2009; Kioutsioukis et al., 2010; L´opez-Moreno et al., 2010). Alpert et al. (2002) analysed the contribu-tion to the total annual rainfall of six precipitacontribu-tion categories from light (with a daily amount between 0 and 4 mm) to torrential (greater than 128 mm/day) at different stations in the Mediterranean. For the higher categories (heavy to tor-rential), increasing trends were found in Spain and Italy; whereas, for the central categories, highly significant de-creasing trends were detected. No significant changes were identified in Israel and Cyprus. Kostopoulou and Jones (2005) reported positive trends in the number of days with daily precipitation above 10 mm for the series recorded in Italy and significant negative trend in the eastern part of the Mediterranean (mainly in the western part of Greece). In the Middle East, weak non-significant trends in precipitation in-dices and a lack of spatial coherence were found by Zhang et al. (2005). In the western part of the Mediterranean basin, Moberg et al. (2006) showed many non-significant trends for winter series of P rec90p and P rec98p (90th, 98th, per-centile of daily precipitation obtained using all days in a season). Norrant and Dougu´edroit (2006) analysed the be-haviour of monthly and daily precipitation series collected in the Mediterranean area. They found a significant de-crease in the winter (December–February; 1950–2000) num-ber of days with daily precipitation above 10 mm in the Italian and Gulf of Genoa subregions (–3 days/50-year) and in the eastern part of the Mediterranean (–4 days/50-year). Furthermore, they found a significant decrease in the win-ter sum of daily precipitation above 10 mm in the Italian, Greek and eastern Mediterranean subregions (–74.2, –74.2,
and –115.1 mm/50-year, respectively). At the Greek sta-tions, the sum of daily precipitation greater than the 95th per-centile had a positive trend equal to 34.6 mm/50-year (Nor-rant and Dougu´edroit, 2006). As for Greece, Kioutsioukis et al. (2010) showed a decreasing trend in the annual number of days with daily precipitation above 10 mm, but no signifi-cant changes in the annual precipitation fraction due to events above the 95th percentile. Regarding the Iberian Peninsula, non-significant changes in extreme precipitation indices were detected in the majority of the analysed series (Gallego et al., 2006; Brunet et al., 2007; Costa and Soares, 2009). However, L´opez-Moreno et al. (2010) reported a decreasing trend in the annual number of days with daily precipitation above the 90th percentile for 49% of the analysed series in the north-eastern part of the Iberian Peninsula.
Indices, based on percentiles or fixed thresholds (as in the previous cited studies), have been extensively applied. Since they do not provide an exhaustive description of the extreme precipitation behaviour, some studies have applied techniques derived in the context of Extreme Value The-ory (EVT) (e.g., Coles and Pericchi, 2003; Yiou and Nogaj, 2004; Vrac and Naveau, 2007; Yiou et al., 2008; Maraun et al., 2009; Rust et al., 2009). The application of EVT to pre-cipitation data requires careful treatment. EVT analysis can be performed in different ways, for example, by using only annual or monthly maxima (block-maxima approach) or all values above a threshold (peaks over threshold approach). The latter approach, in general, makes more efficient use of the data (e.g., Coles, 2001; IPCC, 2002). Therefore, in this analysis the peaks over threshold approach is followed, im-proving the available procedures (as explained in Sect. 3).
Large scale atmospheric circulation (in association with regional and local factors) is important to determine precip-itation anomalies at different time scales, from sub-daily to seasonal. Studies linked monthly to seasonal station or grid-ded precipitation data with large scale atmospheric circula-tion anomalies or derived circulacircula-tion indices (e.g., Zorita et al., 1992; Corte-Real et al., 1995; T¨urkes, 1998; Quadrelli et al., 2001; Krichak et al., 2002; Xoplaki, 2002; D¨unkeloh and Jacobeit, 2003; Xoplaki et al., 2004; Valero et al., 2004; Ziv et al., 2006). So far, only a few studies investigated large-scale circulation and extreme precipitation events at a daily scale (e.g., Tolika et al., 2007; Yiou et al., 2008; Maraun et al., 2010a,b).
description of the troposphere circulation dynamics, an anal-ysis of atmospheric variables is also performed. Geopo-tential height at 500 hPa and Sea Level Pressure anoma-lies (see next section) are analysed, applying a new 2-step classification procedure (see Sect. 3 for details) that iden-tifies and characterises the optimal number of clusters for a large amount of data. Finally, it is well known that jet streams play an important role in the atmosphere, for exam-ple, they represent a critical parameter for the behaviour of planetary waves (Ruti et al., 2006). The entrance and exit areas of a jet stream contribute to determine the distribu-tion of upper-tropospheric divergence and relative vorticity (Barry and Carleton, 2001); moreover, jet streams are linked to mid-latitude storm tracks and stratosphere-troposphere ex-change (Shapiro, 1980; Keyser and Shapiro, 1986; Eisele et al., 1999; Strong and Davis, 2007). Therefore, a description of the jet stream features during extreme precipitation events is also provided.
In Sect. 2, the available data are described. Section 3 pro-vides an explanation of applied methods and finally, results are shown in Sect. 4; conclusions are provided in the last section.
2 Data
Daily precipitation series (characterised by completeness and temporal continuity) from 20 coastal stations across the Mediterranean are selected among the entire dataset col-lected within the EU-FP6 project CIRCE (Climate Change and Impact Research: the Mediterranean Environment). Fig-ure 1 (and Table 1) shows the location of the stations. The North African coast is not represented in the dataset. The temporal coverage of the selected data is 1950–2006, with six series that end in 2001. The quality of data affects the climate analysis, therefore, all the series are in a first step quality controlled and checked for homogeneity. An ad-vanced correction method, specifically developed for daily precipitation time series, does not exist yet. In our approach, we reject series characterised by more than two break points (i.e., inhomogeneities). The identification of break points is carried out applying a new method developed by Toreti et al. (2010) and the method of Caussinus and Mestre (2004). The former break detection method is based on a Genetic Algorithm and Hidden Markov Models and has good per-formance with multiple break points (for a complete de-scription, the reader is referred to Toreti et al., 2010). The daily series of the station located in Emilia-Romagna (Italy) was also quality controlled (including break-point detection) by Pavan et al. (2008). The extreme characterisation (de-fined in the following section) is done for the extended win-ter season (October–March). For the identification of the atmospheric anomaly patterns associated with the extreme events (see Sect. 3), daily NCEP/NCAR reanalysis of the mid-tropospheric geopotential height at 500 hPa (Z500), Sea
Fig. 1. Geographical position of the 20 stations. Colours are as-sociated with the shape (upper panel) and scale (lower panel) pa-rameters of the GPD estimated for each series. In the shape plot, triangles denote a negative value.
Level Pressure (SLP) and wind intensity of the two com-ponents, u and v, at 250 hPa are used (Kalnay et al., 1996; Kistler et al., 2001). The spatial window covering the area from 25◦N to 65◦N and 35◦W to 52◦E is selected. In or-der to obtain anomalies, the mean seasonal cycle is removed from the atmospheric gridded data (Z500 and SLP; using the period 1950–2006). The mean of each grid point for each day of the year is calculated over the whole period. The obtained seasonal cycles are then smoothed using a penalized spline (e.g., Krivobokova and Kauermann, 2007) and removed from the original data.
3 Methods
3.1 dePOT model
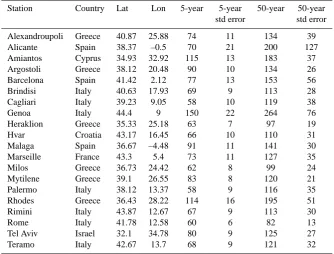
Table 1. Name, country and geographical coordinates (latitude and longitude) of the 20 stations. 5 and 50-year return levels and associated uncertainties, values in mm.
Station Country Lat Lon 5-year 5-year 50-year 50-year std error std error
Alexandroupoli Greece 40.87 25.88 74 11 134 39 Alicante Spain 38.37 –0.5 70 21 200 127 Amiantos Cyprus 34.93 32.92 115 13 183 37 Argostoli Greece 38.12 20.48 90 10 134 26 Barcelona Spain 41.42 2.12 77 13 153 56 Brindisi Italy 40.63 17.93 69 9 113 28 Cagliari Italy 39.23 9.05 58 10 119 38
Genoa Italy 44.4 9 150 22 264 76
Heraklion Greece 35.33 25.18 63 7 97 19 Hvar Croatia 43.17 16.45 66 10 110 31 Malaga Spain 36.67 –4.48 91 11 141 30 Marseille France 43.3 5.4 73 11 127 35 Milos Greece 36.73 24.42 62 8 99 24 Mytilene Greece 39.1 26.55 83 8 120 21 Palermo Italy 38.12 13.37 58 9 116 35 Rhodes Greece 36.43 28.22 114 16 195 51 Rimini Italy 43.87 12.67 67 9 113 30
Rome Italy 41.78 12.58 60 6 82 13
Tel Aviv Israel 32.1 34.78 80 9 125 27 Teramo Italy 42.67 13.7 68 9 121 32
analysis is based on the Extremal Types Theorem ETT (e.g., Leadbetter et al., 1983). Let X1, X2,... be a sequence of independent random variables with a common distributionF
andMn denotes the maximum of (X1,...,Xn). ETT states
that if for some constantsan>0 andbn,P{an(Mn−bn)≤x}
converges to a non-degenerate distributionG, then this dis-tribution is one of the three types characterising the GEV family. In order to use the information from the entire daily series, we implemented a procedure based on the GPD, called declustered Peak Over Threshold (dePOT; Davison and Smith, 1990). GPD arises as an approximation of the X-exceedances (over a defined threshold) distribution, i.e., with the same assumption of the ETT for a large enough threshold
uthe distribution ofX−uconditional onX>ubelongs to the GPD family (Pickands, 1975):
H (y)=1−1+ξy
σ
−1/ξ
, (1)
whereξandσ are the shape and the scale parameter, respec-tively. Theξ parameter identifies the distribution type, i.e., forξ <0 the distribution has an upper bound, ifξ >0 there is not an upper limit and ifξ=0 the distribution is exponential. 3.2 Model inference
There are several available methods for the estimation of the parameters (see for an overview of the early developed meth-ods Castillo and Hadi, 1997), such as: maximum likelihood (e.g., Coles, 2001), probability weighted moments (Hosking
and Wallis, 1987) and medians estimator (Peng and Welsh, 2002). In this context, Ju´arez and Schucany (2004) devel-oped a robust technique called Minimum Density Power Di-vergence Estimator MDPDE (see Appendix A). The MD-PDE is controlled by a constant α (see Appendix A). The estimator is applied to our series withα=0.1, thus, main-taining a good asymptotic efficiency.
The choice of the thresholdu should guarantee the con-vergence and a good number of exceedances for the distri-bution estimation. The most often applied method is the so-called Mean Residual Life Plot (e.g., Coles, 2001), though it has a high degree of subjectivity. We replace the Mean Residual Life Plot approach with a Goodness-of-fit approach (Choulakian and Stephens, 2001). Thus, we test the good-ness of the estimated GPD (Fˆ) as a function ofuusing the Cram´er-von Mises statistic W2 and the Anderson-Darling statisticA2. Let us assume thatx1,...,xnis a sample fromFˆ,
the calculation ofzi= ˆF x(i)
(wherex(1)≤x(2)≤...≤x(n))
lead to:
W2=
n
X
i=1
{zi−(2i−1)/(2n)}2+1/(12n) (2)
A2=−n− (1/n)
n
X 1
(2i−1)log(zi)+log(1−zn+1−i)
!
.(3)
threshold is raised until the p-values, associated with the two statistics, are greater than 0.1. At first, we have sup-posed thatX1,X2,...are independent, however, daily pre-cipitation series do not satisfy this condition. Therefore, the approach described above needs to be modified. First, it is essential to note that ETT is still valid for dependent data replacing the independence condition with the so-called
D(un)condition. In short, a stationary series satisfies the
D(un)condition if two extreme events occurring at timesti
andtj (far enough) are independent (for details see
Lead-better et al., 1983). Then, we introduce the concept of ex-tremal indexθ(Leadbetter et al., 1983): {Xn}n≥1hasθ (in [0,1]) if for eachτ >0 there is a sequence{un}n≥1such that:
n(1−F (un))→τ andP (Mn≤un)→exp(−θ τ ). It means
that (ifθ <1) the exceedances tend to cluster and the clusters may be considered independent. Furthermore,θcan be inter-preted as the reciprocal of the mean cluster size (Leadbetter et al., 1983). The most often used method for cluster iden-tification is runs-declustering (e.g., Coles, 2001). However, Ferro and Segers (2003) developed an objective procedure for that task, so we applied it. They proposed an estima-torθˆ of the extremal index and the following procedure for declustering. Let us assume thatS1< ... < SN are the
ex-ceendance times of our process with interexceedance times
Ti=Si+1−Si,i=1,...,N−1. LetT(C)be the C-th largest
interexceedance time (C= b ˆθ Nc +1),Tijbe the j-th interex-ceedance time greater thanT(C),i0=0 andiC=N. Then the
setTj j=1,...,C, whereTj=
Tij−1+1,...,Tij−1 , is made up of independent intracluster times with an associated set of ex-ceedance timesSj=Sij−1+1,...,Sij .
The application of an extreme model, such as dePOT, gives the possibility of estimating the so-called return levelzR, i.e., the level that is expected to be exceeded on average once ev-ery R-years (Coles, 2001). It is estimated with the following equation (derived from Eq. 1):
zR=u+ ˆσξˆ−1
Rζuθˆ
ξˆ −1
, (4)
where,ζu is the probability of exceeding the threshold (i.e.,
the intensity of the assumed Poisson process describing the occurrence of exceedances; Davison and Smith, 1990). As-suming stationarity, ζu can be replaced by nu/n, i.e., the
number of exceedances divided by the number of observa-tions. The errors associated with the return levels are cal-culated using the estimated variance-covariance matrix (see Appendix A) and applying the delta method (Shao, 2003). 3.3 Atmospheric patterns
Gridded anomalies of Z500 and SLP during extreme days (i.e., days with precipitation above the selected threshold, as explained in the previous subsections), rainy days below the identified threshold (i.e., the threshold of the extreme model) and dry days are extracted. The last two classes are used for the assessment of the significance associated with anomalies
of the first class. The three precipitation classes are sep-arately analysed with the following procedure. The corre-sponding maps are classified using a 2-level clustering algo-rithm (Vesanto and Alhoniemi, 2000). During the first phase the entire set (of cardinalityN) undergoes a procedure for the identification of protoclusters. This step is performed ap-plying the Self-Organizing Map (SOM) method (Kohonen, 2001). SOM can be defined (Kohonen, 2001) as an iter-ative nonlinear projection of a probability density function of a vector in<nonto a 2-dimensional display. SOM com-pares the input vectorx with a set of nodesmi (i=1,...,d)
and the best matching nodemcis determined by minimizing kx−mik. The nodes are updated according to:
mti+1=mti+hci
m−mti, (5)
where t denotes the time iteration step, and hci =
α(t )expn− 2σ2(t )−1k
rc−rik2
o
.αandσare two parame-ters named learning rate and radius factor, respectively; while
rcandri (belonging to<2) are the positions of nodescand
i. The protoclusters undergo a modified k-means clustering procedure (Hartigan and Wong, 1979), in order to overcome the well-known drawbacks of the method linked to the ran-dom initialization of centroids. In fact, following Krishna and Narasimha Murty (1999) a Genetic k-means algorithm (GK) is applied. It is a Genetic Algorithm (Holland, 1992) with a k-means operator for improving the convergence. In brief, denoting the number of protoclusters withnp, it com-pares vectorsv of np-dimension iteratively; components of
v (i.e., elements to be clusterized) take values in{1,...,K} (where K is the final number of clusters), i.e.,vi=j if vi
belongs to thej-th cluster. The Genetic component creates a population (random at the beginning) of vectors and evalu-ates this population by using a fitness function, based on the Total Within Cluster Variation:
TWCV=
K
X
k=1 X
x∈k
kx−ckk, (6)
wherex∈kmeansxbelongs to thek-th cluster. The popula-tion is evaluated applying the so-called tournament selecpopula-tion technique (Blickle and Thiele , 1995); furthermore, mutation and elitism are added (for details, the reader is referred to Whitley, 1994). The number of clusters in the GK algorithm must be chosen a priori; in order to avoid subjective choices, the following method is applied to the protoclusters. A T-mode Principal Component Analysis (PCA; Compagnucci and Richman, 2008) is run on the protoclusters, then a test of dimensionality is performed (Dray, 2008). Let X denote the observation np-matrix, PCA can be achieved with a Singular Value Decomposition of X, i.e., 1/√n
X=UDVt, which is associated with the approximation of X byPm
i=1diuivti=
Pm
i=1Xi. Therefore, as explained by Dray (2008), the test
Table 2. Estimated trend in the seasonal precipitation series. Only the significant (≥90%) values and associated uncertainties are re-ported. The significance is derived with the Mann-Kendall test (Yue et al., 2002).
Station Trend (mm/year) and std err
Alexandroupoli –2.3±1.17 Amiantos –4.8±1.89 Argostoli –8.4±1.97 Cagliari –1.3±0.78 Marseille –2.1±1.1 Mytilene –2.8±1.58 Rhodes –5.8±1.92 Teramo –2.5±0.78
using a similarity measure (RV coefficient; Robert and Es-coufier, 1976) between matrices, in fact, if Xm+1is relevant in terms of the approximation, then it should be close (in terms of similarity) to the residuals Rmof the approximation
done withmmatrices. A complete description can be found in Appendix B. The proposed classification procedure avoids the trap of local solutions that led to the development of al-ternative methods to the classical k-means (e.g., SANDRA; Philipp et al., 2007); in addition, it is able to estimate (in an objective way) the optimal number of clusters.
Finally, the significance of the identified atmospheric anomaly patterns related to extreme daily precipitation is checked by the comparison with patterns during dry days and rainy days below the threshold (i.e., non-extreme wet days). The comparisons are done in the more general con-text of stochastic equality; i.e.,H0:P (X < Y )=P (X > Y ) againstP (X < Y )6=P (X > Y )(e.g., Reiczigel et al., 2005). The nonparametric Brunner-Munzel test is performed for this task (Brunner and Munzel, 2000).
4 Results and discussion
Twelve out of 20 stations do not show a significant (less than 90%) trend in the seasonal total precipitation series. Eight series are affected by an overall significant neg-ative trend (Amiantos, Alexandroupoli, Argostoli, Myti-lene, Rhodes, Marseille, Cagliari, Teramo; see Table 2). The series of Argostoli shows the highest decreasing trend (−8.4±1.97 mm/year), while the weakest significant trend is estimated for the series of Cagliari (–1.3±0.78 mm/year; Ta-ble 2). It is important to outline that the absence of a sig-nificant trend in the seasonal series does not imply a similar behaviour for monthly series. For instance, in Spain, del R´ıo et al. (2010) reported that 61% of the whole territory is af-fected by a decreasing precipitation trend in February. Since the focus of this paper is the characterisation of extreme pre-cipitation in the extended winter season, we do not address this issue.
Fig. 2. Estimated 5-year (upper panel) and 50-year (bottom panel) return levels of each series. Values in mm.
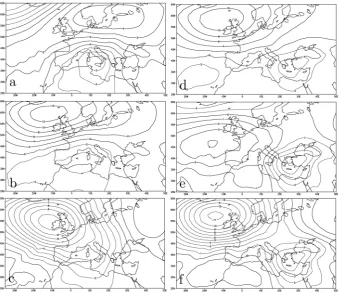
Fig. 3. Identified patterns of Z500 anomalies associated with extreme precipitation. The left panel refers to the western Mediterranean, while the right panel refers to the eastern Mediterranean.
respectively (Fig. 2 and Table 1). In order to investigate pos-sible departures from stationarity of the Poisson component in the dePOT model, the series of exceedances are used to calculate the number of occurrences for each extended win-ter. Then, a Poisson regression (Cameron and Trivedi, 2001) is applied and only for six series (Amiantos, Cyprus; Mar-seille, France; Rhodes and Argostoli, Greece; Genoa and Teramo, Italy) a significant negative tendency is found. This indicates that the probability of observing an event above the threshold (at those six stations) has decreased over the last 57 years. Moreover, the estimated return levels of those se-ries are a function of time and the values shown in Fig. 2 can be considered as mean return levels (since the occurrence rate of threshold exceedances is assumed to be stationary in the dePOT approach). Those tendencies might be related to the decrease of the most intense Mediterranean cyclones (Trigo et al., 2000; Bartholy et al., 2009).
The classification of atmospheric fields (Z500 and SLP) associated with extreme precipitation events (dry days and non-extreme wet days, for testing the significance as ex-plained in the previous section) is performed for each sta-tion. Western and eastern Mediterranean anomaly patterns are derived classifying the station-centroids. For both Z500 and SLP, three clusters are found in the western Mediter-ranean (hereafter WM) and eastern MediterMediter-ranean (EM).
Fig. 4. As Fig. 3 but for SLP.
northeastern Africa (with positive Z500 anomalies over the North Atlantic) characterises the centroid of Fig. 3d. More-over, the SLP (Fig. 4d) mimics a wide Cyprus low located over the eastern Mediterranean. The second pattern (Figs. 3e and 4e) shows a negative anomalous centre located over the Aegean Sea and an anomalous positive area centred over the North Sea, with a strong southward extension towards the WM. Finally, the third centroid (Figs. 3f and 4f for SLP) has two centres of anomalous Z500, over Greece and between the British Isles and Iceland. Moreover, two anomalous pos-itive areas extend from the Atlantic towards Italy and from Eastern Europe towards the Black Sea (Fig. 3f).
In order to validate the identified atmospheric patterns, Z500 and SLP anomalies are also classified with SANDRA (Philipp et al., 2007). The identified SANDRA-patterns (not shown) are similar to those obtained with our procedure. Fi-nally, the significance of Z500/SLP patterns associated with extreme events for each station is tested through a compar-ison with the clusters associated with dry days and non-extreme wet days. Figure 5 shows the significance (grey areas) of western Mediterranean Z500 extreme-day clus-ters compared to dry-day clusclus-ters. In all the three cases, the strongest anomalous areas correspond to the grey ar-eas, i.e., anomalies during extreme precipitation events are significantly different from the clusters of anomalies asso-ciated with dry days. Figure 6 presents the extreme-day centroids tested against the atmospheric anomalous patterns
during non-extreme wet days. Also in this case, anomalies of Z500 associated with extreme daily precipitation are sig-nificant. Most of the regions have significant anomalies in both cases (i.e., extreme days against dry days and extreme days against non-extreme wet days) and the same holds for eastern Mediterranean and SLP patterns.
All the three anomaly Z500 EM-patterns agree with the rainfall mechanisms proposed by Eshel and Farrell (2000) and Ziv et al. (2010). On the right side of an anomalous low centre (in an equivalent barotropic context), southwest-erly winds bring warm air towards the EM, causing vertical motion anomalies. This anomalous ascent affects the lower tropospheric moisture budget and contributes to anomalous rainfall (Eshel and Farrell, 2000). Moreover, non-significant correlation between precipitation and moisture flux diver-gence (Jin and Zangvil, 2009) enhances the important role of vertical moisture fluxes from the warm Mediterranean Sea combined with the moisture transport from the western part of the Basin (e.g., Trigo et al., 2006). The role of the Mediter-ranean Sea is also evident in the Conveyor Belt Model of Ziv et al. (2010) for the Mediterranean cyclones, where the warm belt plays a minor role (as a source of moisture) in contrast to its role in extratropical cyclones.
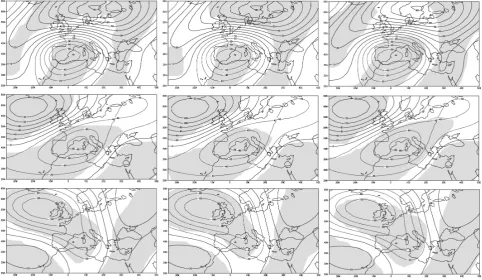
Fig. 5. Results of the Brunner-Munzel test applied to the three western Mediterranean Z500 clusters (one per row) during extreme precipi-tation days against Z500 clusters associated with dry days. Contour lines represent the centroids associated with extreme precipiprecipi-tation. The grey shadow denotes areas with significance≥95%.
Fig. 7. Composite of wind at 250 hPa for the eastern Mediterranean. Values are in m/s.
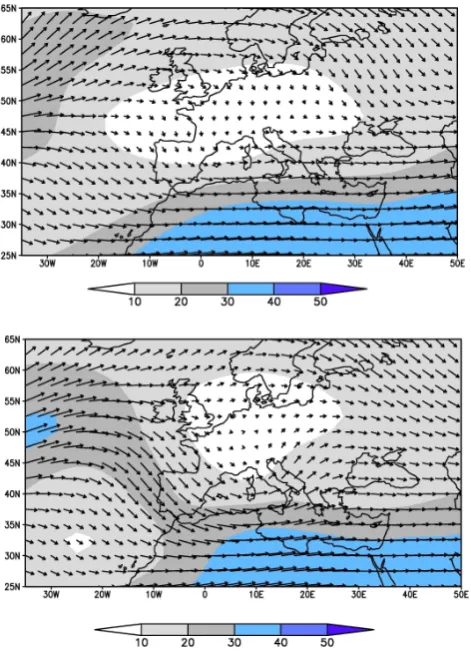
level events. Three common spatial configurations are identi-fied for the whole Mediterranean; two affect the WM and one is related with the EM precipitation events. With regard to the EM, Fig. 7 shows the subtropical jet, with its axis oriented South-West/North-East and a streak located over Egypt. The position of the streak implies that the eastern Basin is on the left side of the exit region, i.e., on the divergence area (that is a key factor of cyclogenesis; Barry and Carleton, 2001). As for the WM, Fig. 8 highlights a first configuration, affecting the southern stations of WM, with the subtropical jet stream characterised by an axis parallel to the African coastline. In the second case, the interaction between the polar jet stream (or eddy driven jet stream) with the subtropical jet is evident and implies that the WM is on a strong divergence region; a similar mechanism was also found in the case of cyclogene-sis over north-western Africa (Prezerakos et al., 2006).
5 Conclusions
An extreme value procedure, based on the Generalized Pareto Distribution and recently developed techniques (on the parameter estimations, the declustering scheme and the selection of the threshold), has been implemented. Then, it has been applied to 20 daily extended winter precipitation se-ries collected from the Mediterranean area and covering the period 1950–2006. In comparison to index based approaches (e.g. number of days with daily precipitation greater than the 90th percentile), our results are more robust and include confidence intervals. Furthermore, our approach provides in-sight into extremal behaviour such as estimates of the shape parameter and high return levels. All of the series, except for Rome and Mytilene, have a heavy tailed behaviour, charac-terised by a positive shape parameter≤0.4. The estimated 5-year return levels are between 58 and 150 mm, with the highest value of the Genoa series. Regarding the 50-year re-turn levels, the values range from 82 mm (Rome) to 264 mm
Fig. 8. Composites of wind at 250 hPa for stations located in the southern part of the western Mediterranean (upper panel) and in other areas of the western basin (lower panel). Intensity of the wind is in m/s.
(Genoa). Moreover, it is interesting to point out the high 50-year return level (200±127 mm) of the Alicante series, caused by the high positive shape parameter. Although the associated uncertainty is quite high, this result highlights the risks linked to extreme daily precipitation events. Most of the series do not show significant changes in the probability of events above threshold (i.e., extreme events), only for six series a decreasing trend has been identified. Finally, it is worth outlining that extreme daily precipitation events in the Mediterranean coastal sites provide a relevant contribution to seasonal totals (approximately 60%).
eastern Mediterranean. The analysis of the jet stream during ≥5-year return level events reveals three configurations; one for the EM and two for the WM. In all cases, the divergence side of the jet stream coincides with the area of interest and supports enhanced ascending motions. In the WM, the in-teraction of the subtropical and polar jet streams strengthens these features.
The proposed combination of an extreme statistical model and a procedure for the identification of atmospheric patterns can also be applied to other regions of the world or to other variables, for example, temperature. Both procedures can also be applied separately for resolving specific issues, for example, classification of atmospheric patterns not related with extremes. Regarding extreme models, some improve-ments can be done for climatic purposes. In fact, depar-tures from stationarity (e.g., in the Poisson process), or co-variate dependence, could be taken into account directly in the model. Consequently, the classical concept of a return level should be revised, because it becomes a function of time (e.g., Luterbacher et al., 2004). However, we believe that this study represents a first step towards a better description of the Mediterranean extremes and the physical mechanisms.
Finally, the proposed approach can also be applied to an ensemble of models with a focus on the Mediterranean basin. The Mediterranean area is considered a “hot-spot” of climate change (Giorgi, 2006) that is expected to suffer more dryness and heavy precipitation events in the future, although the re-sponse of these extremes acts over a long time period com-pared to mean precipitation and temperature (Goubanova and Li, 2007). Therefore, an application of the extreme model can help to reveal and better characterise such features. An analysis of extremes, carried out on observed time series and model output, will provide robust results for deriving poten-tial impacts and the management of climate risks.
Appendix A
Following Ju´arez and Schucany (2004), the MDPDE is based on density power divergence between two densitiesf andg
belonging to an identifiable parametric family:
dα(g,f )=
Z n
f1+α(x)−1+α−1g(x)fα(x)
+ α−1g1+α(x)odx , (A1) whereα is a control parameter. When α is equal to zero MDPDE is equivalent to the maximum likelihood estimator. Considering the GPD family,k0andσ0denote the opposite of the shape parameter (i.e.,k= −ξ) and the scale parameter of the family, respectively. The MDPDE estimationkˆα,σˆα
minimizesdα(g,f (·,k0,σ0)), i.e.
Hα(k,σ )
=σα(1+α−αk) −1
−
1+α−1
n−1
n
X
i=1
σ−α
1−kXiσ−1
k−1−1α
, (A2) whereXi is the sample andn is its length and with some
restrictions on (k,σ ). Moreover, a consistent estimator of the variance-covariance matrix V is given byn−1Jˆ−α1KˆαJˆ−α1,
where Jαand Kαdepend on the information (i) and the score
(S) matrix (obtained using the estimated parameters): Jα=(1+α)
Z
D
SStfα+1dx− Z
D
ifα+1dx
+n−1
n
X
i=1
i−αSSt fα (A3)
Kα=n−1 n
X
i=1
SStf2α−n−2
( n X
i=1 Sfα
) ( n X
i=1 Sfα
)t
. (A4) The integration intervalDis equal to[0,∞)when the shape is greater or equal to zero and it is0,σ k−1when the shape is negative. For further details refer to Ju´arez and Schucany (2004).
Appendix B
The statistic associated with the similarity measure of Xm+1 and Rmis:
RVDIM(m)=RV(Xm+1,Rm)
= t r X
t
m+1RmR
t mXm+1 q
t r Xtm+1Xm+1Xtm+1Xm+1
t r Rt
mRmRtmRm
. (B1)
Following Dray (2008), the testing procedure can be imple-mented in this way:
1. SVD of X.
2. Computation of the RVDIM statistic. 3. Iteration of:
– Randomization of X columns.
– SVD of X.
– Computation of RVDIM.
4. Estimation of the p-values,pm, associated with the
m-component.
Acknowledgements. We acknowledge Sergio F. Ju´arez for his S-plus routine and helpful discussions. We thank Walter Perconti and Guido Fioravanti (ISPRA) for useful discussions on SOM and Valentina Pavan (ARPA-EMR) for providing data from Emilia-Romagna. We thank Nico Hofmann and Martina Hartwig for digitalization of the Teramo station series and Valter Varani for providing the last years of Teramo daily data. We are grateful to G. van der Schrier and partners from the European Climate Assessment and Data set (ECA&D) at the KNMI, the Hellenic National Meteorological Service, O. M. Gokturk and the Turkish State Meteorological Service for providing data. This research was funded by the EU/FP6 integrated project CIRCE (Climate Change and Impact Research: the Mediterranean Environment; http://www.circeproject.eu/; contract number 036961). J¨urg Luterbacher acknowledges support from the EU/FP7 project ACQWA (Assessing Climate Impacts on the Quantity and Quality of Water; http://www.acqwa.ch/; grant 212250) and MedClivar (http://www.medclivar.eu/). We thank two anonymous reviewers for their useful comments. The procedures described in Sect. 2 are fully developed in R (www.r-project.org).
Edited by: R. Garc´ıa-Herrera
Reviewed by: two anonymous referees
References
Alpert, P., Ben-Gai, T., Baharad, A., Benjamini, Y., Yeku-tieli, D., Colacino, M., Diodato, L., Ramis, C., Homar, V., Romero, R., Michaelides, S., and Manes, A.: The paradoxi-cal increase of Mediterranean extreme daily rainfall in spite of decrease in total values, Geophys. Res. Lett., 29, 1536, doi:10.1029/2001GL013554, 2002.
Barry, R. G. and Carleton, A. M.: Synoptic and Dynamic Climato-logy, Routledge, London, 2001.
Bartholy, J., Pongr´acz, R., and Pattanty´us- ´Abrah´am, M.: Analyz-ing the genesis, intensity, and tracks of western Mediterranean cyclones, Theor. Appl. Climatol., 96, 133–144, 2009.
Blickle, T. and Thiele, L.: A mathematical analysis of tournament selection, Proc. of the 6th Intern. Conf. on Genetic Algorithms, Morgan Kaufmann Publishers, San Francisco, 9–16, 1995. Brunet, M., Sigr´o, J., Jones, P. D., Saladi´e, O., Aguilar, E., Moberg,
A., Lister, D., and Walther, A.: Long-term changes in extreme temperatures and precipitation in Spain, Contribution to Science, 3, 331–342, 2007.
Brunetti, M., Maugeri, M., Nanni, T., Auer, I., B¨ohm, R., and Sch¨oner, W.: Precipitation variability and changes in the Greater Alpine region over the 1800–2003 period, J. Geophys. Res., 111, D11107, doi:10.1029/2005JD006674, 2006.
Brunner, E. and Munzel, U.: The nonparametric Behrens-Fisher problem: asymptotic theory and a small sample approximation, Biometrical J., 42, 17–25, 2000.
Cameron, A. C. and Trivedi, P. K.: Essentials of count data regres-sion, in: A companion to theoretical econometrics, edited by: Baltagi, B. H., Blackwell, Oxford, 331–348, 2001.
Castillo, E. and Hadi, A. S.: Fitting the Generalized Pareto Distri-bution, J. Am. Stat. Assoc., 92, 1609–1620, 1997.
Caussinus, H. and Mestre, O.: Detection and correction of artificial shifts in climate series, Appl. Stat.-J. Roy. St. C, 53, 405–425, 2004.
Choulakian, V. and Stephens, M. A.: Goodness-of-fit for the Gen-eralized Pareto Distribution, Technometrics, 43, 478–484, 2001. Coles, S.: An Introduction to Statistical Modeling of Extreme
Val-ues, Springer-Verlag, London, 2001.
Coles, S. and Pericchi, L.: Anticipating catastrophes through ex-treme value modelling, Appl. Stat.-J. Roy. St. C, 52, 405–416, 2003.
Compagnucci, R. H. and Richman, M. B.: Can principal compo-nent analysis provide atmospheric circulation or teleconnection patterns?, Int. J. Climatol., 28, 703–726, 2008.
Corte-Real, J., Zhang, X., and Wang, X.: Large-scale circulation regimes and surface climatic anomalies over the Mediterranean, Int. J. Climatol., 15, 1135–1150, 1995.
Costa, A. C. and Soares, A.: Trends in extreme precipitation indices derived from a daily rainfall database for the South of Portugal, Int. J. Climatol., 29, 1956–1975, 2009.
Davison, A. C. and Smith, R. L.: Models for Exceedances over High Thresholds, J. Roy. Stat. Soc. B Met., 52, 393–442, 1990. De Luis, M., Gonz´alez-Hidalgo, J. C., Longares, L. A., and
Step´anek, P.: Seasonal precipitation trends in the Mediterranean Iberian Peninsula in second half of the 20th century, Int. J. Cli-matol., 29, 1312–1323, 2009.
del R´ıo, S., Herrero, L., Fraile, R., and Penas, A.: Spatial distribu-tion of recent rainfall trends in Spain (1961–2006), Int. J. Clima-tol., doi:10.1002/joc.2111, in press, 2010.
Dray, S.: On the number of principal components: a test of dimen-sionality based on measurements of similarity between matrices, Comput. Stat. Data An., 52, 2228–2237, 2008.
D¨unkeloh, A. and Jacobeit, J.: Circulation dynamics of Mediter-ranean precipitation variability 1948–98, Int. J. Climatol., 23, 1843–1866, 2003.
EEA: Urban sprawl in Europe, EEA report No. 10, 2006.
Eisele, H., Scheel, H. E., Sladkovic, R., and Trickl, T.: High-resolution Lidar measurements of stratosphere-troposphere ex-change, J. Atmos. Sci., 56, 319–330, 1999.
EM-DAT: The OFDA/CRED International Disaster Database, www.emdat.net, Universit´e catholique de Louvain, Brussels, 2009.
Eshel, G. and Farrell, B. F.: Mechanisms of Eastern Mediterranean rainfall variability, J. Climate, 57, 3219–3232, 2000.
ESPON: Territorial trends and policy impacts in the field of EU en-vironmental policy, ESPON 2.4.1, edited by: Klein, J. and Jarva, J., 2006.
ESPON-INTERACT: Environmental hazards and risk management-thematic study of Interreg and Espon activi-ties, 2006.
Ferro, C. A. T. and Segers, J.: Inference for clusters of extreme values, J. Roy. Stat. Soc. B Met., 65, 545–556, 2003.
Foley, J. A., DeFries, R., Asner, G. P., Barford, C., Bonan, G., Car-penter, S. R., Chapin, F. S., Coe, M. T., Daily, G. C., Gibbs, H. K., Helkowski, J. H., Holloway, T., Howard, E. A., Kucharik, C. J., Monfreda, C., Patz, J. A., Prentice, C. I., Ramankutty, N., and Snyder, P. K.: Global consequences of land use, Science, 22, 570–574, 2005.
Gallego, M. C., Garc´ıa, J. A., Vaquero, J. M., and Mateos, V. L.: Changes in frequency and intensity of daily precipitation over the Iberian Peninsula, J. Geophys. Res., 111, D24105, doi:10.1029/2006JD007280, 2006.
Giorgi, F.: Climate change hot-spots, Geophys. Res. Lett., 33, L08707, doi:10.1029/2006GL025734, 2006.
Gonz´alez-Hidalgo, J. C., De Luis, M., Ravent´os, J., and S´anchez, J. R.: Spatial distribution of seasonal rainfall trends in a western Mediterranean area, Int. J. Climatol., 21, 843–860, 2001. Goubanova, K. and Li, L.: Extremes in temperature and
precipi-tation around the Mediterranean basin in an ensemble of future climate scenario simulations, Global Planet. Change, 57, 27–42, 2007.
Hartigan, J. A. and Wong, M. A.: A K-means clustering algorithm, J. Roy. Stat. Soc. C-App., 28, 100–108, 1979.
Haylock, M. R. and Goodess, C. M.: Interannual variability of Eu-ropean extreme winter rainfall and links with mean large-scale circulation, Int. J. Climatol., 24, 759–776, 2004.
Holland, J. H.: Adaptation in natural and artificial systems, MIT Press, Cambridge, 1992.
Hosking, J. R. M. and Wallis, J. R.: Parameter and quantile estima-tion for the Generalized Pareto Distribuestima-tion, Technometrics, 29, 339–349, 1987.
IPCC: Workshop on changes in extreme weather and climate events, Beijing, China, 11–13 June 2002.
Jin, F. and Zangvil, A.: Relationship between moisture budget com-ponents over the eastern Mediterranean, Int. J. Climatol., 30(5), 733–742, 2009.
Ju´arez, S. F. and Schucany, W. R.: Robust and efficient estimation for the Generalized Pareto Distribution, Extremes, 7, 237–251, 2004.
Kalnay, E., Kanamitsu, M., Kistler, R., Collins, W., Deaven, D., Gandin, L., Iredell, M., Saha, S., White, G., Woollen, J., Zhu, Y., Leetmaa, A., Reynolds, R., Chelliah, M., Ebisuzaki, W., Higgins, W., Janowiak, J., Mo, K.C., Ropelewski, C., Wang, J., Jenne, R., and Joseph, D.: The NCEP/NCAR 40-year reanalyis project, B. Am. Meteorol. Soc., 77, 437–470, 1996.
Keyser, D. and Shapiro, M. A.: A review of the structure and dy-namics of upper-level frontal zones, Mon. Weather Rev., 114, 452–499, 1986.
Kioutsioukis, I., Melas, D., and Zerefos, C.: Statistical assessment of changes in climate extremes over Greece (1955–2002), Int. J. Climatol., doi:10.1002/joc.2030, in press, 2010.
Kistler, R., Kalnay, E., Collins, W., Saha, S., White, G., Woollen, J., Chelliah, M., Ebisuzaki, W., Kanamitsu, M., Kousky, V., van den Dool, H., Jenne, R., and Fiorino, M.: The NCEP/NCAR 50-year reanalyis: monthly means cd-rom and documentation, B. Am. Meteorol. Soc., 82, 247–267, 2001.
Klein Tank, A. M. G. and K¨onnen, G. P.: Trends in indices of daily temperature and precipitation extremes in Europe, 1946–99, J. Climate, 16, 3665–3680, 2003.
Kohonen, T.: Self-Organizing Maps, Springer-Verlag, Berlin, 2001. Kostopoulou, E. and Jones, P. D.: Assessment of climate extremes in the Eastern Mediterranean, Meteorol. Atmos. Phys., 89, 69– 85, 2005.
Krichak, S. O., Kishcha, P., and Alpert, P.: Decadal trends of main Eurasian oscillations and the Eastern Mediterranean precipita-tion, Theor. Appl. Climatol., 72, 209–220, 2002.
Krishna, K. and Narasimha Murty, M.: Genetic K-means algorithm, IEEE T. Syst. Man Cy. B, 29, 433–439, 1999.
Krivobokova, T. and Kauermann, G.: A note on Penalized spline smoothing with correlated errors, J. Am. Stat. Assoc., 102, 1328– 1337, 2007.
Leadbetter, M. R., Lindgren, G., and Rootz´en, H.: Extremes and related properties of random sequences and processes, Springer-Verlag, New York, 1983.
L´opez-Moreno, J. I., Vicente-Serrano, S. M., Angulo-Mart´ınex, M., Beguer´ıa, S., and Kenawy, A.: Trends in daily precipitation on the northeastern Iberian Peninsula, 1955–2006, Int. J. Climatol., doi:10.1002/joc.1945, in press, 2010.
Luterbacher, J., Dietrich, D., Xoplaki, E., Grosjean, M., and Wan-ner, H.: European seasonal and annual temperature variability, trends, and extremes since 1500, Science, 303, 1499–1503, 2004. Maraun, D., Rust, H. W., and Osborn, T. J.: The annual cycle of heavy precipitation across the United Kingdom: a model based on extreme value statistics, Int. J. Climatol., 29, 1731–1744, 2009.
Maraun, D., Osborn, T. J., and Rust, H. W.: The influ-ence of synoptic airflow on UK daily precipitation extremes. Part I: observed spatio-temporal relationships, Clim. Dynam., doi:10.1007/s00382-009-0710-9, in press, 2010a.
Maraun, D., Rust, H. W., and Osborn, T. J.: Synoptic airflow and UK daily precipitation extremes. Development and validation of a vector generalised linear model, Extremes, 13, 133–153, 2010b.
Moberg, A., Jones, P. D., Lister, D., Walther, A., Brunet, M., Ja-cobeit, J., Alexander, L. V., Della-Marta, P. M., Luterbacher, J., Yiou, P., Chen, D., Klein Tank, A. M. G., Saladi´e, O., Sigr´o, J., Aguilar, E., Alexandersson, H., Almarza, C., Auer, I., Barriendos, M., Begert, M., Bergstr¨om, H., B¨ohm, R., But-ler, C. J., Caesar, J., Drebs, A., Founda, D., Gestengarbe, F. W., Micela, G., Maugeri, M., ¨Osterle, H., Pandzic, K., Petrakis, M., Srnec, L., Tolasz, R., Tuomenvirta, H., Werner, P. C., Lin-derholm, H., Philipp, A., Wanner, H., and Xoplaki, E.: Indices for daily temperature and precipitation extremes in Europe anal-ysed for the period 1901–2000, J. Geophys. Res., 111, D22106, doi:10.1029/2006JD007103, 2006.
Norrant, C. and Dougu´edroit, A.: Monthly and daily precipitation trends in the Mediterranean (1950–2000), Theor. Appl. Clima-tol., 83, 89–106, 2006.
Pavan, V., Tomozeiu, R., Cacciamani, C., and Di Lorenzo, M.: Daily precipitation observations over Emilia-Romagna: mean values and extremes, Int. J. Climatol., 15, 2065–2079, 2008. Peng, L. and Welsh, A.: Robust estimation of the Generalized
Pareto Distribution, Extremes, 4, 53–65, 2002.
Philipp, A., Della-Marta, P. M., Jacobeit, J., Fereday, D. R., Jones, P. D., Moberg, A., and Wanner, H.: Long-term variability of daily North Atlantic-European pressure patterns since 1850 classified by simulated annealing clustering, J. Climate, 20, 4065–4095, 2007.
Pickands, J.: Statistical inference using extreme order statistics, Ann. Stat., 3, 119–131, 1975.
Quadrelli, R., Pavan, V., and Molteni, F. : Wintertime variability of Mediterranean precipitation and its links with large-scale circu-lation anomalies, Clim. Dynam., 17, 457–466, 2001.
Reiczigel, J., Zakari´as, I., and R´ozsa, L.: A bootstrap test of stochastic equality of two populations, Am. Stat., 59, 1–6, 2005. Robert, P. and Escoufier, Y.: A unifying tool for linear multivariate statistical methods: the RV coefficient, Appl. Statist., 25, 257– 265, 1976.
Rodrigo, F. S. and Trigo, R. M.: Trends in daily rainfall in the Iberian Peninsula from 1951 to 2002, Int. J. Climatol., 27, 513– 529, 2007.
Rust, H. W., Maraun, D., and Osborn, T. J.: Modelling seasonality in extreme precipitation. A UK case study, Eur. Phys. J.-Spec. Top., 174, 99–111, 2009.
Ruti, P. M., Lucarini, V., Dell’Aquila, A., Calmanti, S., and Speranza, A.: Does the subtropical jet catalyze the midlati-tude atmospheric regimes?, Geophys. Res. Lett., 33, L06814, doi:10.1029/2005GL024620, 2006.
Shao, J.: Mathematical Statistics, Springer-Verlag, New York, 2003.
Shapiro, M. A.: Turbulent mixing within tropopause folds as a mechanism for the exchange of chemical constituents between the stratosphere and troposphere, J. Atmos. Sci., 37, 994–1004, 1980.
Strong, C. and Davis, R. E.: Winter jet stream trends over the North-ern Hemisphere, Q. J. Roy. Meteor. Soc., 133, 2109–2115, 2007. Tolika, K., Anagnostopoulou, Chr., Maheras, P., and Kutiel, H.: Extreme precipitation related to circulation types for four case studies over the Eastern Mediterranean, Adv. Geosci., 12, 87– 93, 2007,
http://www.adv-geosci.net/12/87/2007/.
Toreti, A., Fioravanti, G., Perconti, W., and Desiato, F.: Annual and seasonal precipitation over Italy from 1961 to 2006, Int. J. Climatol., 29, 1976–1987, 2009.
Toreti, A., Kuglitsch, F. G., Xoplaki, E., and Luterbacher, J.: Time series segmentation: an approach based on a Genetic Algorithm and Hidden Markov Models, Nonlin. Processes Geophys., in re-view, 2010.
Trenberth, K. E., Jones, P. D., Ambenje, P., Bojariu, R., Easterling, D., Klein Tank, A., Parker, D., Rahimzadeh, F., Renwick, J. A., Rusticucci, M., Soden, B., and Zhai, P.: Observations: Surface and Atmospheric Climate Change, In: Climate Change 2007: The Physical Science Basis. Contribution of WG 1 to the Fourth Assessment Report of IPCC edited by: Solomon, S., Qin, D., Manning, M., Chen, Z., Marquis, M., Averyt, K. B., Tignor, M., and Miller, H. L., Cambridge University Press, UK and USA, 2007.
Trigo, I. F., Davies, T. D., and Bigg, G. R.: Decline in Mediter-ranean rainfall caused by weakening of MediterMediter-ranean cyclones, Geophys. Res. Lett., 27, 2913–2916, 2000.
Trigo, R., Xoplaki, E., Zorita, E., Luterbacher, J., Krichak, S. O., Alpert, P., Jacobeit, J., S´aenz, J., Fern´andez, J., Gonz´alez-Rouco, F., Garcia-Herrera, R., Rodo, X., Brunetti, M., Nanni, T., Maugeri, M., T¨urkes, M., Gimeno, L., Ribera, P., Brunet, M., Trigo, I. F., Crepon, M., and Mariotti, A. : Relations between variability in the Mediterranean region and mid-latitude variabil-ity, in: Mediterranean climate variabilvariabil-ity, edited by: Lionello, P., Rizzoli, P., and Boscolo, R., Elsevier, Amsterdam, 180–226, 2006.
T¨urkes, M.: Influence of geopotential heights, cyclone frequency and southern oscillation on rainfall variations in Turkey, Int. J. Climatol., 18, 649–680, 1998.
T¨urkes, M., Koc, T., and Saris, F.: Spatiotemporal variability of precipitation total series over Turkey, Int. J. Climatol., 29, 1056– 1074, 2009.
Valero, F., Luna, M. Y., Mart´ın, M. L, Morata, A., and Gonz´alez-Rouco, F.: Coupled modes of large-scale climatic variables and regional precipitation in the western Mediterranean in autumn, Clim. Dynam., 22, 307–323, 2004.
Vesanto, J. and Alhoniemi, E.: Clustering of Self-Organizing Map, IEEE T. Neural Networ., 11, 586–600, 2000.
Vrac, M. and Naveau, P.: Stochastic downscaling of precipita-tion: from dry events to heavy rainfalls, Water Resour. Res., 43, W07402, doi:10.1029/2006WR005308, 2007.
Whitle, D.: A Genetic Algorithm Tutorial, Stat. Comput., 4, 65–85, 1994.
Xoplaki, E.: Climate variability over the Mediterranean, Ph.D. the-sis, University of Bern, Bern, available at: http://sinus.unibe.ch/ klimet/docs/phd xoplaki.pdf(last access: 18 May 2010), 2002. Xoplaki, E., Gonz´alez-Rouco, J. F., Luterbacher, J., and Wanner,
H.: Wet season Mediterranean precipitation variability: influence of large-scale dynamics and trends, Clim. Dynam., 23, 63–78, 2004.
Yiou, P. and Nogaj, M.: Extreme climatic events and weather regimes over the North Atlantic: when and where?, Geophys. Res. Lett., 31, L07202, doi:10.1029/2003GL019119, 2004. Yiou, P., Goubanova, K., Li, Z. X., and Nogaj, M.: Weather regime
dependence of extreme value statistics for summer temperature and precipitation, Nonlin. Processes Geophys., 15, 365–378, 2008,
http://www.nonlin-processes-geophys.net/15/365/2008/. Yue, S., Pilon, P., Phinney, B., and Cavadias, G.: The influence
of autocorrelation on the ability to detect trend in hydrological series, Hydrol. Process., 16, 1807–1829, 2002.
Zhang, X., Aguilar, E., Sensoy, S., Melkonyan, H., Tagiyeva, U., Ahmed, N., Kutaladze, N., Rahimzadeh, F., Taghipour, A., Han-tosh, T.H., Alpert, P., Semawi, M., Ali, M. K., Said Al-Shabibi, M. H., Al-Oulan, Z., Zatari, T., Al Dean Khelet, I., Hamoud, S., Sagir, R., Demircan, M., Eken, M., Adiguzel, M., Alexander, L., Peterson, T. C., and Wallis, T.: Trends in Middle East climate ex-treme indices from 1950 to 2003, J. Geophys. Res., 110, D22104, doi:10.1029/2005JD006181, 2005.
Ziv, B., Dayan, U., Kushnir, Y., Roth, C., and Enzel, Y.: Regional and global atmospheric patterns governing rainfall in the south-ern levant, Int. J. Climatol., 26, 55–73, 2006.
Ziv, B., Saaroni, H., Romen, M., Heifetz, E., Harnik, N., and Ba-harad, A.: Analysis of conveyor belts in winter Mediterranean cyclones, Theor. Appl. Climatol., 99, 441–455, 2010.