www.nat-hazards-earth-syst-sci.net/9/1365/2009/ © Author(s) 2009. This work is distributed under the Creative Commons Attribution 3.0 License.
and Earth
System Sciences
Risk-based stabilization planning for soil cut slopes
D. Li1, L. Zhang2, C. Zhou1, and W. Lu1
1State Key Laboratory of Water Resources and Hydropower Engineering Science, Wuhan University, 8 Donghu South Road,
Wuhan 430072, China
2Department of Civil Engineering, Hong Kong University of Science and Technology, Clear Water Bay, Kowloon, Hong Kong
Received: 26 March 2009 – Revised: 20 July 2009 – Accepted: 3 August 2009 – Published: 6 August 2009
Abstract. Risk-based slope stabilization planning integrates the failure probability and the failure consequence system-atically and shows promise for use in the practice. This pa-per attempts to develop a risk-based methodology for sta-bilization planning for deteriorating soil cut slopes. First, a framework of risk-based stabilization planning for slopes is proposed. Then the time-dependent reliability of deteri-orating slopes is analyzed based on observed performance. Thereafter, the slope failure consequence is assessed in terms of expected numbers of fatality. After obtaining the time-dependent risk of slope failure, the time for slope stabiliza-tion is determined according to selected risk criteria. Finally, the effect of slope maintenance on the reliability of slopes is evaluated. Based on the analyses, the annual probability of failure of soil cut slopes would increase exponentially in the early stage of service if no maintenance were implemented. As a slope deteriorates, the risk of slope failure increases with time and may reach an intolerable level at a certain time. The risk of slope failure may also reach an intolerable level due to a change of elements at risk. The derived stabilization time depends on the factors that cause the slopes to deterio-rate, consequence of slope failure, selected risk criteria, and vulnerability of the affected population.
1 Introduction
Soil cut slopes are subject to deterioration and susceptible to failure, particularly during the rainy season or as a con-sequence of seismic events. In the context of the present study, slope deterioration refers to the effect of factors such as lack of maintenance of soil cut slope, blockage and
dam-Correspondence to: D. Li
(dianqing@whu.edu.cn)
age of surface drainage systems, surface or internal erosion, reduction of the shear strength of slope materials, and large changes in pore pressure (Lacerda and Santos, 2000; Che-ung, 2004). Among these, inadequate slope maintenance or stabilization is a key factor (e.g. Lo et al., 1998; Chen and Lee, 2004).
In the literature, Wyllie et al. (1980) studied slope-stabilization planning using a decision-tree analysis. Roberds (1991) developed a methodology involving decision analysis for optimizing rock slope preventive main-tenance programs. Lo et al. (1998) studied the effectiveness of maintenance in improving the slope safety. Shiu and Cheung (2003) assessed the global landslide risk posed by pre-1978 man-made slopes and the risk reduction from 1977 to 2000 achieved by landslip preventive measures in Hong Kong. Cheung (2004), and Cheung and Tang (2005a, b) developed a methodology to systematically evaluate the reliability of deteriorating slopes based on observed performance of soil-cut slopes in Hong Kong. Lee et al. (2006) developed a slope management system to manage the slope maintenance works for mountain highways in Tai-wan. The Australian Geomechanics Society (AGS) (2007a) also promulgated geoguides for slope management and maintenance. However, time-dependent reliability of slopes and the effectiveness of slope maintenance in reducing the rate of deterioration have not been investigated sufficiently. How one can incorporate the time-dependent reliability into stabilization planning for deteriorating slopes and how to determine the time for slope stabilization have not been clearly specified. In addition, the risk posed by a particular slope usually change when the population and economic activities in the affected area expand. The risk level of the slope may therefore reach a limit that imposes slope stabilization actions. The construction of new towns in hilly terrains requires the risks be re-evaluated and the safety levels of these slopes enhanced. However, the change of elements at risk imposing stabilization actions has not been investigated sufficiently.
Risk-based stabilization planning is becoming a topic of great interest in engineering practice and has recently been used for offshore structures (Apeland and Aven, 2000), oil pipelines (Al-Khalil et al., 2005), landslides in Norwegian quick clay (Lacasse, 2004), and industrial sectors (Arun-raj and Maiti, 2007). As risk is defined as the product of probability of slope failure and resulting adverse failure con-sequence; risk-based slope stabilization planning integrates the failure probability and the failure consequence systemat-ically and helps in selecting alternatives to minimize the risk resulting from slope failure.
The objective of this paper is to develop a generic risk-based methodology for stabilization planning of deteriorat-ing soil cut slopes. Several steps are taken towards the objec-tive. Firstly, a framework of risk-based stabilization planning for slopes is proposed. Then the time-dependent reliability of slopes is analyzed based on observed performance of soil cut slopes. Thereafter, the slope failure consequence is assessed in terms of expected number of fatalities. After obtaining the time-dependent risk of slope failure, the time for slope stabilization is determined according to selected risk criteria. Finally, the effect of slope maintenance on the reliability of slopes is evaluated.
2 Framework of risk-based stabilization planning for slopes
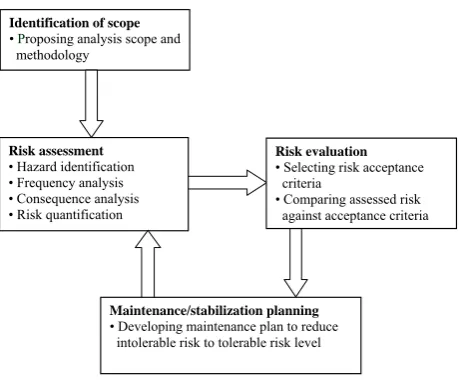
Risk-based methodology provides a tool for slope stabiliza-tion planning and decision-making to reduce the probability of failure of slopes or the consequences of slope failure. The resulting maintenance or slope stabilization program maxi-mizes the stability of the slope and minimaxi-mizes the total main-tenance cost. Risk-based slope stabilization comprises esti-mating the level of risk, deciding whether or not the risk level is acceptable, and implementing appropriate measures to re-duce the risk when the risk level cannot be accepted. Fig-ure 1 shows a flow diagram of the procedFig-ure used to develop this methodology. The procedure includes four components: identification of scope, risk assessment, risk evaluation, and stabilization planning based on risk. These components are described in the following sections.
2.1 Identification of scope
To ensure that the analysis addresses relevant issues and to limit the scope of analysis, it is important to define the fol-lowing items:
1. The site, being the primary area of interest.
2. Will the analysis be limited to addressing property loss only, or will it also include injury to persons and loss of life?
3. The extent and nature of investigations that will be com-pleted.
4. The basis for assessment of acceptable and tolerable risks.
2.2 Risk assessment
and will require the majority of effort. It is, however, a key step in risk analysis. For the purpose of illustration, only the temporal probability of slope failure is considered in this study. The probability of slope failure is typically recom-mended to be expressed as the annual probability of slope failure. Thereafter, a consequence assessment is performed to quantify the impact of the slope failure. The consequences may not be limited to property damage and injury or loss of life. Other consequences such as public outrage, loss of business confidence, and damage to reputation may also be included. Many of these may not be readily quantifiable and will require considerable judgment if they are to be included in the assessment (Australian Geomechanics Society Land-slide Taskforce, 2007b). Finally, the risk of slope failure can be quantified.
2.3 Risk evaluation
Risk acceptance criteria should be determined and used to decide whether the estimated risk of slope failure is accept-able or not. In this step, it is important to distinguish between acceptable risks that society desires to achieve, particularly for new projects, and tolerable risks that the public will live with, even though they would prefer lower risks. Acceptable risks are usually considered to be one order of magnitude lower than the tolerable risks (e.g., AGS, 2000). This applies to both loss of property and loss of life.
2.4 Slope stabilization planning based on risk
Slopes that fail to meet the risk acceptance criteria are in-vestigated to develop a stabilization program to lower the risk within tolerable or acceptable limits. Both the type of stabilization measures and the maintenance time should be determined at this stage. In this study, we only use the deter-mination of maintenance time as an example to illustrate the methodology. Both the probability of slope failure and the risk involved change with the maintenance time. The proba-bility of failure after stabilization is finally calculated and the effect of maintenance on the reliability of slopes is evaluated.
3 Time-dependent reliability of slopes
Hong Kong is situated at the southern part of China. It has a total land area of about 1090 km2and a population of about seven millions. Hong Kong has a tropical and subtropical cli-mate. Thus the terrain is exposed to heavy precipitation par-ticularly during the rainy season between April and Septem-ber. On average, the annual rainfall is more than 2000 mm, with a maximum reaching over 3000 mm. The terrain of Hong Kong is covered by a thick mantle of decomposed rocks or colluvium (e.g. Fyfe et al., 2000). The granite is extensively weathered throughout the territory, with depths of silty, sandy soil of up to 60 m. The volcanic rocks are
Risk assessment
• Hazard identification • Frequency analysis • Consequence analysis • Risk quantification
Risk evaluation
• Selecting risk acceptance criteria
• Comparing assessed risk against acceptance criteria
Maintenance/stabilization planning
• Developing maintenance plan to reduce intolerable risk to tolerable risk level
Identification of scope
• Proposing analysis scope and methodology
Fig. 1. Framework of risk-based stabilization for slopes.
35
Fig. 1. Framework of risk-based stabilization for slopes.
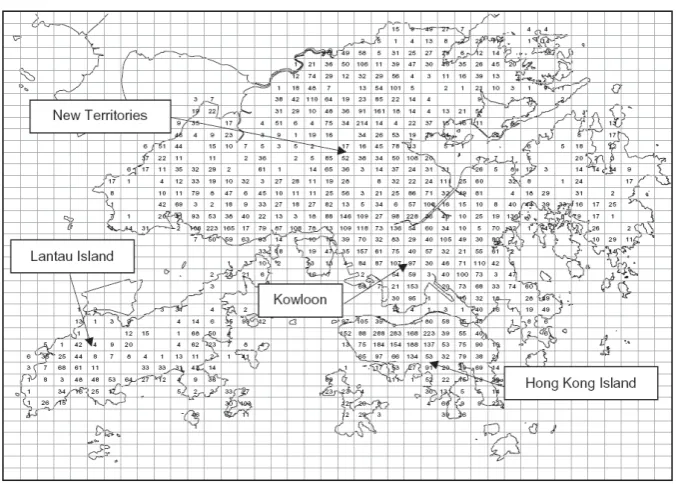
Fig. 2. Locations of pre-1978 registered man-made slopes in the territory of Hong Kong.
36
Fig. 2. Locations of pre-1978 registered man-made slopes in the territory of Hong Kong.
Hundreds of rainfall-induced landslides are reported each year in Hong Kong. Most of the slip surfaces are shallow, and the thickness of scars is usually less than 3 m. If a land-slide occurs, more than 80% of the debris volume is less than 50 m3(Cheung et al., 2001). To reduce the landslide risk to as low a level as is reasonably practicable, a comprehensive slope safety system has been established to manage landslide risk in Hong Kong. As part of the system, a territory-wide automatic rain-gauge network has been established to study the spatial characteristics of rainfall as well as its correla-tion with landslides. Rainfall data are recorded automatically at 5-minute intervals on a 24-h basis. In the context of this paper, a rainstorm is defined as an event in which a rolling 24-h rainfall,i24, exceeds 50 mm. For each rainstorm event,
the maximum rolling 24-h rainfall values were calculated for each raingauge. Studies (Premchitt et al., 1994; Yu, 2004) indicated that the maximum rolling 24-h rainfall,i24 max,
cor-relates reasonably well with the occurrence of landslides and
i24 maxis a good parameter to indicate the likelihood of
land-slides. For instance, Yu (2004) reported a correlation study between rainfall and landslide frequency based on 1622 slope failures occurred in the years 1984 to 2000 and studied influ-ence factors such as slope height and angle. For the popula-tion of soil cut slopes considered, the landslide frequency (in log scale) increases approximately linearly withi24 max
be-tween 50 mm to 350 mm. The correlation coefficient is about 0.9 on average.
In a previous research program by Cheung (2004), Siu and Cheung (2003), Tang and Cheung (2004), and Cheung and Tang (2005b), approximately 16 000 soil cut slopes from a population of 21 000 soil cut slopes with observed perfor-mance records during 208 rainstorms in the period from 1984 to 2002 were selected for study. Most of these slopes were
formed before the implementation of more rigorous geotech-nical control in 1977. Based on the past performance data of soil cut slopes (i.e., time of formation and time of first failure of the pre-1978 soil cut slopes in the period of 1984 to 2002), a statistical reliability analysis has been carried out. The youngest and oldest pre-1978 slopes were 7 and 31 years old respectively in 1984. By the end of 2002, these slopes were 26 and 50 years old, respectively. More than 1100 landslide accidents were reported over the observation period. To study the reliability of slopes under different rain-fall characteristics, the territory of Hong Kong were divided into a grid of 1600 small cells, and 860 cells among them fall on land as shown in Fig. 3. Each cell has a plan area of 1.5 km×1.2 km. Based on the locations of soil cut slopes, the number of slopes in each of the 1600 cells can be deter-mined. The spatial distribution of 16 000 soil cut slopes in the territory of Hong Kong is also shown in Fig. 3, where the numbers represent the numbers of slopes in the subject cells. Whenever a rainstorm occurs, the rainfall data recorded by rain gauges will be used to interpolate the rainfall intensity at each of the 1600 cells (Yu, 2004). For each of the 208 rainstorms, the geographical characteristics of the rainfall are represented by the spatial distribution of the maximum rolling 24-h rainfall among the 1600 cells. Each cell has its owni24 max.
The rainfall intensity, i24 max, was divided into three
categories: 50–200 mm/day, 200–400 mm/day, and
Fig. 3. Spatial distribution of soil cut slopes in the territory of Hong Kong (after Cheung and Tang 2005b).
37
Fig. 3. Spatial distribution of soil cut slopes in the territory of Hong Kong (after Cheung and Tang, 2005b).
relationship between the probability of landslide occurrence and rainfall intensity can be found in the literature, such as Finlay et al. (1997), Au (1998), Yu (2004), and Chen et al. (2005). If the time of occurrence of a landslide is within the start of a rainstorm and further two days after the end of the rainstorm, the landslide would be considered as triggered by this rainstorm. For each of the rainstorms, the soil cut slopes and resulting landslides in response to the three rainfall intensity categories from each of the small cells were also identified and grouped. The number of slopes hit by rainstorms, namely, the number of slopes multiplied by the number of rainstorms, was then grouped according to slope age and rainfall intensity. The grouping of rainstorm hits for the 208 rainstorms under different categories of rainfall intensity and slope ages is shown in Fig. 4. Similar grouping was carried out for slope failures, as shown in Fig. 5, which records the first time that a slope failed. Once a slope has failed, it will be excluded from the sample of slopes in the next rainstorm event. In this paper, these valuable data are used as a basis for analyzing time-dependent reliability of the soil cut slopes. Note that the number of rainstorm hits withi24 max=50–200 mm/day
is 3 057 589 which is the highest among the three rainstorm categories, yet the number of resulting landslides is 333 that is not the largest. In contrast, although the number of rainstorm hits withi24 max>400 mm/day is 16 438 that is the
smallest, these heavy rainstorms induced 147 landslides. In the following analysis, the slope population is assumed to be homogeneous and the temporal and spatial distributions of heavy rainstorms relative to the locations of slopes of
dif-ferent vulnerabilities are not taken into account. Therefore, the resulting time-dependent reliability of slopes is “global” rather than site specific; site-specific study would be required to develop a slope stabilization plan for a particular site or re-gion.
Based on the datasets in Figs. 4 and 5, the conditional an-nual probability of failure as a function of agetcan be esti-mated as (Cheung and Tang, 2005b):
bh(t, i24 max)= (1) Number oft−year−old slopes that failed at a rainstorm of intensityi24 max
Number of rainstorm hits of intensityi24 maxont-year-old slopes
The conditional rate of failure given by Eq. (1) is equiva-lent to the hazard function that is commonly used in relia-bility analysis to denote the instantaneous rate of failure for an operating system. The Weibull distribution is a popular model for describing the relative likelihood of failure for a deteriorating engineering system (Harr, 1997). For example, Cheung and Tang (2005b) applied the Weibull distribution to deteriorating slopes. The hazard functionh(t )for a Weibull-distributed time to failuretis expressed as
h(t )=λγ (λt )γ−1 (2) whereγ=a shape parameter that governs the rate of change of the hazard function; andλ=a scale parameter which dic-tates the spread of the distribution. The cumulative hazard function can be obtained as
H (t )=
Z t 0
5 10 15 20 25 30 35 40 45 50 0
50 100 150 200
Age (years)
i24max=50-200 mm/day 0
4 8 12 16
i
24max=200-400 mm/day
N
u
mb
er o
f rai
n
storm h
its (1
0
3 ) 0.0 0.5 1.0 1.5 2.0
i
24max>400 mm/day
Fig. 4. Number of rainstorm hits on pre-1978 soil cut slopes by age of slope (After Cheung
and Tang 2005b).
38
Fig. 4. Number of rainstorm hits on pre-1978 soil cut slopes by age
of slope (After Cheung and Tang, 2005b).
Based on Eqs. (2) and (3), hazard functions of the slope per-formance data with respect to the three categories of rain-fall intensity can be constructed following methods proposed by Nelson (1972) and Cheung (2004). Figure 6 shows the hazard plot corresponding toi24 max>400 mm/day in log-log
scale. The corresponding correlation coefficient is 0.991, which indicates that the observed time to failure fits a Weibull distribution well. The shape parameter,γ, and the scale pa-rameter,λ, of the Weibull distribution are determined from the gradient and intercept of the regression line, respectively. They are estimated to bebγ=1.94 andbλ=0.012. The
val-ues of parametersγandλfor the hazard function associated with the three categories of rainfall intensity before and af-ter rigorous maintenance are summarized in Table 1. Note that the hazard analysis involves two sources of uncertainty: parameter uncertainty affected by the number of data avail-able and model uncertainty associated with the selected two-parameter Weibull distribution.
Figure 7 shows the three hazard functions on log scale un-der different railfall intensities. Since all γ values shown in Table 1 are greater than unity, all the hazard func-tions increase monotonically with slope ages. In Fig. 7, the performance of the slopes under rainstorm categories
i24 max=50–200 and 200–400 mm/day exhibits
discontinu-ities att=16 years on the curves. One possible reason for this lower rate could be retardation of deterioration. After a reasonably long period of service, for the considered case of 16 years, owners of the slopes might have become aware of the poor conditions of their slopes and carried out mainte-nance works that counterbalanced the effect of deterioration. Indeed, as reported by Cheung and Tang (2005b), a public campaign on slope maintenance was initiated in 1992 to
in-5 10 15 20 25 30 35 40 45 50 0
10 20 30
Age (years)
i24max=50-200 mm/day
0 20 40 60 80
i24max=200-400 mm/day
Nu
mbe
r of
f
a
ilures
0 10 20 30
i24max>400 mm/day
Fig. 5. Number of pre-1978 soil cut slope failures by age of slope (After Cheung and Tang
2005b).
39
Fig. 5. Number of pre-1978 soil cut slope failures by age of slope
(After Cheung and Tang, 2005b).
-1.4 -1.3 -1.2 -1.1 -1.0 -0.9 -0.8 -0.7 -0.6
1.2 1.3 1.4 1.5 1.6
Log (t
ime to f
a
ilure,t
)
Log (cumulative hazard function, H(t)) i
24max>400 mm/day
γ=1/gradient λ=1/log-1(intercept)
Observed data Regression line
Fig. 6. Hazard plotting for time of slope failure using Eq. 2.
Fig. 6. Hazard plotting for time of slope failure using Eq. (2).
Table 1. Weibull distribution parameters in Eq. (2) for deteriorating slopes.
Before maintenance After maintenance
Rainfall intensity, Correlation Correlation
i24 max(mm/day) γ λ coefficient γ λ coefficient
50–200 2.84 0.0056 0.988 1.28 0.0003 0.994
200–400 6.54 0.036 0.989 1.48 0.0048 0.995
>400 1.94 0.012 0.991 1.94 0.012 0.991
0 5 10 15 20 25 30 35 40 45 50 1E-6
1E-5 1E-4 1E-3 0.01 0.1
H
a
z
a
rd fun
c
ti
o
n
Service time (years)
i24max=50-200 mm/day
i24max=200-400 mm/day
i24max>400 mm/day
Fig. 7. Variation of hazard function over time using Eq. 2 under different categories of
rainfall intensity (After Cheung and Tang 2005b).
41
Fig. 7. Variation of hazard function over time using Eq. (2) under
different categories of rainfall intensity (After Cheung and Tang, 2005b).
have different characteristics such as geometrical configura-tions and applied loads. Thus the strength characteristics of the slopes that survived after 16 years may be different from those that have already failed. The weaker slopes may have already failed in the early service period.
In addition to the hazard function, a designer may be inter-ested in knowing the probability of failure over a given future service time. One can integrate the probability density func-tion of the time to failure and obtain the probability of slope failure for a service periodt[0,T] as follows:
Pf(t )=1−exp(−λt )γ (4)
Applying Eq. (4), the cumulative probabilities of slope fail-ure for the three categories of rainfall intensity are obtained and shown in log scale in Fig. 8. The cumulative probability of failure increases as the service time or the rainfall intensity increases. For example, a slope would have aPf of 0.2%
under i24 max=50–200 mm/day for the next 25 years. The
Pf will become 0.5% if the service period increases from
25 years to 50 years. On the other hand, ifi24 maxincreases
to 200–400 mm/day and>400 mm/day, thePf for the next
25 years will increase to 4% and 10%, respectively. Note that the kinks in the probability curves when the service time
0 5 10 15 20 25 30 35 40 45 50 1E-4
1E-3 0.01 0.1 1
Cumulat
ive probabi
lit
y of
f
a
ilur
e
Service time (year)
i
24max=50-200 mm/day
i
24max=200-400 mm/day
i24max>400 mm/day
Fig. 8. Cumulative probability of failure using Eq. 4 under different categories of rainfall
intensity.
42
Fig. 8. Cumulative probability of failure using Eq. (4) under
differ-ent categories of rainfall intensity.
reaches 16 years represent the change in the Weibull distri-bution parameters att=16 years. The rate of increase in the probability of failure beyond 16 years is lower, which will be discussed later.
The probabilities of failure shown in Fig. 8 only represent the contribution of each different category of rainstorm to the conditional probability of failure. If the occurrence probabil-ities of different rainstorm intensprobabil-ities are taken into account, one can determine the probabilities of slope failure for vari-ous service periods by virtue of the total probability theorem (e.g., Ang and Tang, 2007),
Pf t(t )=
3 X
i=1
Pf i(t )Pi(i24 max) (5)
where Pi(i24 max)=occurrence probability of the ith
cate-gory of rainstorm intensity; andPf i(t )=cumulative
i24 max=50–200, 200–400, and>400 mm/day in a given year
are found to be 43, 50, and 7%, respectively. It should be noted that the occurrence probability of rainstorm highly de-pends on the rainfall duration. For example, the occurrence probabilities of the maximum rolling 12-h rainfall categories
i12 max=50–200, 200–400, and>400 mm/day in a given year
are 65, 33, and 2%, respectively. Similarly, the occurrence probabilities of the maximum rolling 6-h rainfall are 82.5, 17, and 0.5%, respectively. Generally, the occurrence probabil-ity of rainstorm category 50–200 mm/day decreases with in-creasing rainfall duration, while the occurrence probabilities of rainstorm categoriesi12 max=200–400 and>400 mm/day
increase with increasing rainfall duration. Again these rain-fall occurrence data are “global estimates” and may not be applicable to a specific site. Based on these data, the cumu-lative probability of slope failure over any given service pe-riod can be determined and are shown in Fig. 9. The cumu-lative probability of failure increases with service time and results independent of the rainfall category. For instance, it increases from 0.03% for a service time of 5 years to 8% for a service time of 50 years. As indicated earlier, the kink ob-served at a service time of 16 years is due to the change in the deterioration rate of slopes because of different levels of maintenance.
The annual probability of failure is of interest to planners in assessing the risk arising from slope failures. Based on Eq. (5), the annual probability of slope failure in yeart can be calculated by
Pf a(t )=Pf t(t )−Pf t(t−1) (6)
=
3 X
i=1
(Pf i(t )−Pf i(t−1))Pi(i24 max)
Figure 10 shows the annual probability of failure in any year
t within the given service period. It is evident that the rate of slope deterioration increases significantly when the ser-vice time is longer than a decade. For example, the annual failure probability increases from 0.01% at a service time of 5 years to 0.4% at a service time of 15 years. This means that the time of slope maintenance should be smaller than a decade in order to alleviate the rate of slope deterioration ef-ficiently. After the majority of maintenance or stabilization works were initiated in the 16th year, the annual probability of failure after t=16 years is reduced substantially and in-creases with time more slowly. The change of failure rate with time can be modelled as a bathtub curve (e.g. Harr, 1997): the deteriorating rate of slopes with proper mainte-nance slows down with time. The surviving slopes after age 16 may have geometrical and strength characteristics differ-ent from those that have already failed. The weaker slopes may have already failed in the early service period.
Maintenance works alone might not be able to bring the annual probability of slope failure back to the original level when the slope was just formed. There are a few reasons for this. First, although all government slopes in Hong Kong
0 5 10 15 20 25 30 35 40 45 50 0.00
0.02 0.04 0.06 0.08 0.10
Cumulat
iv
e
probabilit
y
of
f
a
ilur
e
Service time (year)
Fig. 9. Cumulative probability of slope failure using Eq. 5 for various service periods.
43
Fig. 9. Cumulative probability of slope failure using Eq. (5) for
various service periods.
0 5 10 15 20 25 30 35 40 45 50 0.000
0.001 0.002 0.003 0.004 0.005 0.006
Ann
ual probabilit
y
o
f f
ailure
Service time (years)
Fig. 10. Annual probability of slope failure using Eq. 6 for various service periods.
44
Fig. 10. Annual probability of slope failure using Eq. (6) for various
service periods.
are subject to routine maintenance carried out generally on annual basis since 1992, preventive maintenance measures were not implemented on all the deteriorated slopes. Second, some factors such as reduction of soil shear strength due to weathering of slope forming materials or seasonal variations of pore pressure are irreversible.
Besides predicting the performance of old slopes when they were first constructed, it is desirable that the risk in the remaining life of those slopes that have not failed can be ob-tained. For instance, one would be interested in estimating the reliability of existing slopes of any given age over any given next service period so that planners can schedule the maintenance program for these deteriorating slopes. The fail-ure probability of slopes older thant0for the next periodt1
has been given by Cheung and Tang (2005a),
Equation (7) provides a model for estimating the reliabil-ity of slopes of a given age in future service period. Based on Eq. (7), the annual failure probability of slopes of aget0
in yeart1in the new service period can be determined as
fol-lows:
Pf a(T < t0+t1|T ≥t0)=exp(−λγ((t0+t1−1)γ −t0γ))(8)
−exp(−λγ((t0+t1)γ−t0γ))
The annual probabilities of failure for slopes of various ages are calculated using Eq. (8) and shown in Fig. 11. After serving for many years with normal maintenance, the annual failure probability does not increase with service time sig-nificantly. As expected, the annual failure probabilities for older slopes are higher than those for younger slopes given the same service period. For example, annual probabilities of failure of the 10-, 20- and 30-year old slopes are projected to be 0.16, 0.20 and 0.24% over the next 10-year service. The annual probabilities of failure of slopes of different ages become similar as the service time increases.
Having obtained the annual probability of slope failure, an example is investigated to validate the proposed methodol-ogy. In Hong Kong, there were a total of six rainstorms in 2003 and the spatial distribution of the maximum rolling 24-h intensityi24 maxof each rainstorm among the cells has been
determined. Based on the spatial distribution of the rainfall intensity, one can use Eq. (6) to calculate the annual proba-bility of failure. Then, the number of soil cut slope failures induced by each rainstorm can be predicted. Table 2 com-pares the predicted number with the actual number of soil cut slope failures (Cheung and Tang, 2005b). Fairly good agree-ment between the predicted and the actual number of soil cut slope failures is observed. More data should be collected to predict the number of soil cut slope failures in a more reliable way.
4 Consequence of slope failure
In the previous section, the annual probability of slope failure has been determined based on observed global performance of soil cut slopes in Hong Kong. In order to assess the risk of slope failure, the consequence of slope failure and vulner-ability of elements at risk must also be available. The conse-quences of slope failure include loss of property, loss of life, public outrage, political effects, damage to reputation, and others (AGS, 2000). For illustrative purposes, only the num-ber of deaths by soil cut slope failure considered here. Wong et al. (1997) developed a methodology in which the conse-quence of a given slope failure is expressed in terms of Poten-tial Loss of Life (PLL). Table 3 shows the expected number of fatalities for different facilities directly affected by a ref-erence landslide that is 10 m in width and 50 m3in volume. The expected number of fatalities for facility groups 1 and 2 are in the same order of magnitude, which are one or two
or-0 5 10 15 20 25 30
0.000 0.001 0.002 0.003 0.004 0.005 0.006
Annual pr
obabilit
y
of
f
ailure
wit
hin next
ser
v
ice period
Service time (years)
Age of slope, tp
tp=10 years
tp=20 years
tp=30 years
Fig. 11. Annual probability of failure using Eq. 8 for soil cut slopes with different ages.
45
Fig. 11. Annual probability of failure using Eq. (8) for soil cut
slopes with different ages.
Table 2. Comparison between predicted and actual number of soil
cut slope failures in 2003 in Hong Kong (after Cheung and Tang, 2005b).
Actual number Predicted number of soil cut of soil cut Rainstorm Period slope failures slope failures
1 7–10 April 1 2
2 4–7 May 38 43
3 9–16 June 18 23
4 21–26 August 4 3
5 1–4 September 3 2
6 14–17 September 2 5
ders of magnitude larger than those for facility groups 3, 4, and 5.
Table 3. Expected number of fatalities for affected facilities used in the analysis (After Wong et al., 1997).
Facility Group No.
Facilities Expected No.
of fatalities
1 (a) Heavily used buildings
Residential building, commercial office, store and shop, hotel, factory, school, power station, ambulance depot, market, hospital, polyclinic, clinic, welfare centre
3
(b) Others
Cottage, licensed and squatter area
Bus shelter, railway platform and other sheltered public waiting area Dangerous goods storage site (e.g., petrol stations)
Road with very heavy vehicular or pedestrian traffic density
3
2 (a) Lightly used buildings
Indoor car park, building within barracks, abattoir incinerator, indoor games’ sport hall, sewage treatment plant, refuse transfer station, church, temple, monastery, civic centre, manned sub-station
2
(b) Others
Major infrastructure facility (e.g., railway, tramway, flyover, subway, tunnel portal, service reservoir)
Construction site (if future use not certain)
Road with heavy vehicular or pedestrian traffic density
1
3 Heavily used open space and public waiting area (e.g., heavily used playground, open car park, heavily used sitting out area, horticulture garden)
Road with moderate vehicular or pedestrian traffic density
0.25
4 Lightly used open–air recreation area (e.g., district open space, lightly used playground, ceme-tery, columbarium)
Non-dangerous goods storage site
Road with low vehicular or pedestrian traffic density
0.03
5 Remote area (e.g., country park, undeveloped green belt, abandoned quarry)
Road with very low vehicular or pedestrian traffic density
0.001
Note: (i) The expected number of fatalities refers to the occurrence of a reference landslide, namely, a 10 m-wide failure 50 m3in volume. (ii) To account for the different types of building structures with different detailing of window and other perforations etc, a multiple fatality factor ranging from 1 to 5 is considered appropriate for group No. 1(a) facilities to account for the possibility that some incidents may result in a disproportionately larger number of fatalities than that envisaged. For global QRA, an average value of 3 is taken for the multiple fatality factors.
(iii) For incidents that involve the collapse of a building, it is assumed that the expected number of fatalities is 100.
5 Risk assessment and acceptance criteria of slope failure
Having determined the probability of slope failure, the con-sequence of slope failure, and the vulnerability factor, the risk of slope failure can be obtained. Aiming at assessing the risk of slope failure, the scale of slope failure was as-sumed to be the same as the reference landslide, namely, a slide 10 m in width and 50 m3in volume. It should be noted, however, that if the actual slide size were different from the reference one, then the expected number of fatalities should be scaled proportional to the ratio of the actual size to the reference size. Two types of risk, namely, individual risk and societal risk are considered, which are presented in terms of
consequence associated with slope failure are considered in this study. As a slope deteriorates, the risk increases with time and may reach an unacceptable limit at a certain time. The risk of slope failure may also reach an unacceptable limit due to a change of elements at risk. The time for maintenance can be determined when the risk-time relation is found and appropriate risk acceptance criteria are selected.
As pointed out by Morgenstern (1997), appropriate risk acceptance criteria are crucial to extend the use of landslide risk assessment in practice. Following a review of accept-able risks and psychology of risk perception, Finlay and Fell (1997) studied the landslide risk perception in Australia and Hong Kong. They suggested that the acceptable SR ranges from 10−3 to 10−6 per year. Based on a survey of literature concerning acceptable risk for dams, Fell and Hart-ford (1997) proposed tolerable risk levels for loss of life in relation to slope failures. For existing slopes only including artificial or man-made slopes, the tolerable SRs for loss of life are 10−4per person per annum for the person at greatest
risk and 10−6per exposed person per annum as an average over the population at risk, respectively. For new slopes, the tolerable values are 10−5per year and 10−6per year, respec-tively. The difference in risk criteria for existing and new slopes is attributed to the differences in risk perceptions for existing and new slopes (Finlay and Fell, 1997). Similarly, AGS (2000) suggested tolerable individual risk levels in rela-tion to slope failure. The tolerable SRs for the person most at risk are 10−4per year and 10−5per year for existing and new slopes, respectively. Based on a detailed review of the current international risk acceptance criteria in practice, GEO (1998) recommended an interim risk guideline for natural terrain landslides and boulder fall hazards in Hong Kong. The max-imum tolerable individual risk levels for existing slopes and new slopes are recommended to be 10−4and 10−5per year,
respectively. Leroi et al. (2005) summarized individual risk criteria in use in a number of engineering related disciplines, including landslides. There is a similarity among most of the aforementioned risk acceptance criteria (Fell and Hartford, 1997; AGS, 2000; GEO, 1998): the maximum tolerable in-dividual risk level for existing slopes is 10−4per year. This individual risk level is adopted to develop risk-based stabi-lization planning for deteriorating slopes in this study.
6 Stabilization planning for deteriorating slopes
Risk–based slope maintenance/stabilization planning can be developed based on the results described in the previous sec-tions. The individual risk and societal risk of slope failures are expressed in terms of SR and TR, respectively. For illus-trative purposes, the average vulnerability factor is obtained by dividing the number of fatalities by the number of slope failures. The number of soil cut slope failures and the total number of fatality between 1984 and 2002 in Hong Kong are 1123 and 18, respectively (Shiu and Cheung, 2003). The
av-erage vulnerability factor in the same period is about 0.016. This approach would grossly underestimate the actual vul-nerability factor because the vast majority of the slope fail-ures contained in the dataset have a low temporal probability of presence of population at risk. In practice, vulnerability factors commonly adopted in landslide quantitative risk as-sessment tend to be much higher than 0.01. Therefore, in order to account for the effect of uncertainties in these vul-nerability factors on the risk of slope failure, three values of vulnerability factor, 0. 01, 0.1, and 1.0 are adopted in the subsequent analyses. As discussed earlier, SR values larger than 10−4per year will be intolerable. Thus, if the SR for a slope failure is larger than 10−4per year, stabilization actions should be taken. Since the societal risk acceptance criteria in terms of TR for slope failure have not been reported in the lit-erature, for the purpose of this analysis, the maximum tolera-ble TR for slope failure is taken to be 10−3fatalities per year.
If the TR for a slope failure is larger than 10−3fatalities per
year, stabilization actions should also be activated. It should be noted that the maximum tolerable TR of 10−3per year is adopted herein only for illustrative purpose. Strictly speak-ing, the maximum tolerable TR should account for the size of the considered zone. Taking the Hong Kong practices as an example, the existing landslide societal risk criteria based on F-N curve only apply to a consultation zone of 500 m slope boundary length.
As shown in Table 3, the expected number of fatalities for facility groups 1 to 5 are 3, 1–2, 0.25, 0.03, and 0.001, re-spectively for slides 10 m in width and 50 m3in volume in-dividually. Therefore the societal risk of slope failure for a specified facility group directly affected by slope failure is a specific value. As mentioned earlier, if the actual slide size is different from the reference one assumed in the present study, then the expected number of fatalities should be scaled pro-portional to the ratio of the actual size to the reference size. Shiu and Cheung (2003) presented examples of calculated expected number of fatalities.
0 2 4 6 8 10 12 14 16 1E-8
1E-7 1E-6 1E-5 1E-4 1E-3 0.01 0.1
Service time (years)
S
pecif
ic risk
Vulnerability factor,V=0.01 Vulnerability factor,V=0.1 Vulnerability factor,V=1
Maximum tolerable specific risk
Tolerable specific risk level
Fig. 12. Specific risk of soil cut slope failure by service time of slope.
46
Fig. 12. Specific risk of soil cut slope failure by service time of
slope.
respectively. This depends on the fact that the time for slope stabilization is very sensitive to risk criteria.
For societal risks of slope failure, based on the data in Fig. 10 and Table 3, Fig. 13 shows the variation of TR within the first 16 years with the service time for the vulnerability factor of 0.01. It can be seen from Fig. 13 that the risk of slope failure increases with the elements at risk. Let us take the slope at a service time of 15 years as an example. The TRs of slope failure for facility groups 1 to 5 directly af-fected by the reference slope range from 1.05×10⁻⁴, (3.51– 7.01)×10−5 to 3.51×10⁻⁸ fatalities per year, respectively. The TR of slope failures may reach an intolerable level due to a change of elements at risk.
7 Effect of maintenance/stabilization on reliability of slopes
As indicated in Fig. 7, after a maintenance/stabilization plan has been implemented at a service time of 16 years, the Weibull parameters shown in Eq. (2) are not the same as those before 16 years. Based on Fig. 7 and Eq. (5), the proba-bilities of slope failure with and without maintenance or sta-bilization actions can be compared. Figure 14 presents the SRs on log scale against the extended service time after 16 years. Clearly, after the maintenance plan has been imple-mented, the deteriorating rate is well controlled and the SR only increases slightly with the service time. For example, when the service time increases from 17 to 50 years, the SR of slope failure for a global average vulnerability factor of 0.01 only increases from 1.42×10⁻⁵per year to 2.34×10⁻⁵
per year. The corresponding SR values already lie within the tolerable individual risk level. In addition, the SR values for vulnerability factors of 0.1 and 1 are always above the threshold.
0 2 4 6 8 10 12 14 16
1E-10 1E-9 1E-8 1E-7 1E-6 1E-5 1E-4 1E-3 0.01 0.1 1
T
o
tal risk (number of
expect
ed fat
a
lities)
Service time (years) Vulnerability factor, V=0.01
Facility group 1 Facility group 2(a) Facility group 2(b) Facility group 3 Facility group 4 Facility group 5
Tolerable total risk
Fig. 13. Total risk of a reference landslide by service time of soil cut slope.
47
Fig. 13. Total risk of a reference landslide by service time of soil
cut slope.
20 25 30 35 40 45 50
1E-6 1E-5 1E-4 1E-3 0.01 0.1
Service time (years)
S
p
ec
if
ic
r
isk
Vulnerability factor,V=0.01 Vulnerability factor,V=0.1 Vulnerability factor,V=1
Maximum tolerable specific risk
Tolerable specific risk level
Fig. 14. Specific risk of soil cut slope failure after stabilization by service time of slope.
48
Fig. 14. Specific risk of soil cut slope failure after stabilization by
service time of slope.
Figure 15 compares the SRs for 10-, 20- and 30-year old slopes within the next 30-year service period. As expected, the SRs for older slopes are higher than those for younger slopes given the same service period. For example, the 10-, 20- and 30-year old cut slopes will have SRs of 1.56×10⁻⁵, 1.99×10⁻⁵and 2.36×10⁻⁵ per year over the next 10-year service, respectively. In addition, the SRs for slopes of dif-ferent ages become closer as the service time increases.
To further compare the effect of maintenance over time, Fig. 16 compares the probabilities of failure within the next service period for the slopes with and without maintenance for different rainfall intensity categories. The effect of main-tenance on the probability of failure is most significant un-der the rainstorm category ofi24 max=200–400 mm/day. Note
0 5 10 15 20 25 30 0.00000
0.00001 0.00002 0.00003 0.00004 0.00005 0.00006
Vulnerability factor, V=0.01
Age of slope, tp
tp=10 years
tp=20 years
tp=30 years
S
pecific risk
Service time (year)
Fig. 15. Comparison between specific risks for soil cut slopes with different ages.
49
Fig. 15. Comparison between specific risks for soil cut slopes with
different ages.
of 30 years, the probability of failure decreases substantially from 80% without maintenance or stabilization actions to 5.5% with proper maintenance. When considering the cate-gory of the rainfall intensity larger than 400 mm/day, a slope may fail in a single rainstorm event due to extreme water infiltration, rising ground water table, and surface or internal erosion; therefore, routine maintenance alone is not sufficient to guarantee the slope safety. Based on the results shown in Fig. 16, the effect of maintenance also depends on the rainfall intensity.
The probability of failure shown in Fig. 16 only repre-sents the contribution of different categories of rainstorm to the conditional probability of failure. Similarly, apply-ing Eq. (5), the cumulative probabilities of failure of slopes with and without maintenance/stabilization actions can be compared as shown in Fig. 17, by considering the different types of rainstorms. After a maintenance/stabilization plan has been implemented, the probability of failure decreases substantially. Generally, the reduction in the probability of failure increases with the service time. At a service time of 30 years, the cumulative probability of failure decreases from 41% (without slope maintenance/stabilization actions) to 4% (with proper slope maintenance/stabilization actions). This indicates the importance of a well-planned maintenance pro-gram.
8 Conclusions
This paper has proposed a methodology for risk-based maintenance/stabilization planning for deteriorating soil cut slopes, which may be used to improve the existing mainte-nance policies. The average time-dependent reliability for soil cut slopes can be effectively analyzed using the proposed methodology. The annual probability of failure of soil cut slopes would increase exponentially in the early stage of
ser-0 5 10 15 20 25 30
0.000 0.002 0.004 0.006 0.008
i24max=50-200 mm/day Without maintenance With maintenance
Cu
m
u
la
ti
ve
p
rob
ab
ilit
y
o
f
fa
ilu
re
Service time (year)
0 5 10 15 20 25 30
0.0 0.2 0.4 0.6 0.8 1.0
i24max=200-400 mm/day Without maintenance With maintenance
Fig. 16. Comparison between cumulative probabilities of failure of slopes using Eq. 4 with
and without stabilization considering different categories of rainfall intensity.
50
Fig. 16. Comparison between cumulative probabilities of failure
of slopes using Eq. (4) with and without stabilization considering different categories of rainfall intensity.
0 5 10 15 20 25 30
0.0 0.1 0.2 0.3 0.4 0.5
Time of maintenance, t
m=16 years
Cum
u
lat
ive probabilit
y of
f
a
ilure
Service time (year) Without maintenance
With maintenance
Fig. 17. Comparison between cumulative probabilities of failure for slopes using Eq. 5 with
and without proper stabilization.
Fig. 17. Comparison between cumulative probabilities of failure for
slopes using Eq. (5) with and without proper stabilization.
Given selected risk criteria, the stabilization time depends on the rate of slope deterioration, the vulnerability of the af-fected population, and the consequence of slope failure. Sta-bilization works should be implemented to effectively con-trol the rate of slope deterioration.
In the proposed methodology, the slope population is as-sumed to be homogeneous. Thus, the calculated reliability of soil cut slopes in this study only represents the average per-formance of slopes of similar characteristics. It may have lit-tle or even no meaning for individual slopes. Consequently, the calculated reliability and risk are global rather than site specific. However, the time-dependent reliability of a spe-cific slope can be evaluated by using the average reliability of slopes as prior information in a Bayesian framework. The temporal and spatial distributions of heavy rainstorms rela-tive to the locations of slopes of different vulnerabilities are not taken into account in this study. This is indeed an im-portant area for further research. The scale of failures and the mobility of landslide debris are not considered. How-ever, the proposed methodology can also be extended to ac-count for the effect of the scale of failure and mobility of landslide debris. Only the maintenance time is illustrated, which affects the probability of slope failure directly, but af-fects the consequences of slope failure indirectly. However, the proposed methodology can be extended so that the conse-quences are addressed directly. This can be done by studying slope stabilization strategies that will be best applied to re-duce the consequences. In addition, only the loss of life is considered in this paper. If the consequence of the landslide is only economical, then the presented methodology could be used for risk optimization in a cost-benefit analysis. The pro-posed method should also be extended to account for other consequences such as loss of property and socio-economic impacts.
Acknowledgements. This work is supported by National Nat-ural Science Funds for Distinguished Young Scholars (Project No. 50725931), National Natural Science Foundation of China (Project No. 50839004), Program for New Century Excellent Talents in University, Ministry of Education of China (Project No. NCET-08-0415), and the Research Grants Council of the Hong Kong SAR (Project No. N HKUST611/03).
Edited by: P. Reichenbach
Reviewed by: G. G. R. Iovine and another anonymous referee
References
Au, S. W. C.: Rain-induced slope instability in Hong Kong, Eng. Geol., 51(2), 1–36, 2001.
Australian Geomechanics Society: Landslide risk management concepts and guidelines, Australian Geomech, 35(1), 49–92, 2000.
Australian Geomechanics Society Landslide Taskforce: The tralian geoguides for slope management and maintenance, Aus-tralian Geomech, 42(1), 159–182, 2007a.
Australian Geomechanics Society Landslide Taskforce: Practice note guidelines for landslide risk management, Australian Ge-omech, 42(1), 63–114, 2007b.
Al-Khalil, M. Assaf, S., and Al–Anazi, F.: Risk–based maintenance planning of cross–country pipelines, J. Perform Constr. Facil., 19(2), 124–131, 2005.
Ang, A. H. S. and Tang, W. H.: Probability concepts in engineering: emphasis on applications to civil and environmental engineering, 2nd edition, John Wiley and Sons, New York, 2007.
Apeland, S. and Aven, T.: Risk based maintenance optimization: Foundational issues, Reliab. Eng. Syst. Safe, 67(3), 285–292, 2000.
Arunraj, N. S. and Maiti, J.: Risk-based maintenance-techniques and applications, J. Hazard. Mater., 142(3), 653–661, 2007. Brand, E. W.: Predicting the performance of residual soil slopes.
Proceedings of the 11th International Conference on Soil Me-chanics and Foundation Engineering, San Francisco, Vol. 5, 2541–2578, 1985.
Chen, C. Y. Chen, T. C. Yu, F. C., and Lin, S. C.: Analysis of time-varying rainfall infiltration induced landslide, Environ. Geol., 48(4–5), 466–479, 2005.
Chen, H. and Lee, C. F.: Geohazards of slope mass movement and its prevention in Hong Kong, Eng. Geol., 76(1–2), 3–25, 2004. Cheung, R. W. M.: Methodology for updating cut slope
reliabil-ity based on observed performance, PhD Thesis, the Hong Kong University of Science and Technology, Hong Kong, 2004. Cheung, R. W. M., Shiu, Y. K., and Pang, P. L. R.: Assessment of
global landslide risk posed by man-made slopes in Hong Kong, Proceedings of the International Conference on Landslides-Causes, Impacts and Countermeasures, Davos, Switzerland, 497–505, 2001.
Cheung, R. W. M. and Tang, W. H.: Reliability of deteriorating slopes, J. Geotech. Geoenviron., 131(5), 589–597, 2005a. Cheung, R. W. M. and Tang, W. H.: Realistic assessment of slope
reliability for effective landslide hazard management, Geotech-nique, 55(1), 85–94, 2005b.
Fell, R.: Landslide risk assessment and acceptable risk, Can. Geotech. J., 31(2), 261–272, 1994.
Fell, R. and Hartford, D.: Landslide risk management, In: Cruden DM, Fell R (eds) Landslide risk assessment, A.A. Balkema, Rot-terdam, 51–109, 1997.
Finlay, P. J. and Fell, R.: Landslides: risk perception and accep-tance, Can. Geotech. J., 34(2), 169–188, 1997.
Finlay, P. J., Fell, R., and Maguire, P. K.: The relationship be-tween the probability of landslide occurrence and rainfall, Can. Geotech. J., 34(6), 811–824, 1997.
Finlay, P. J., Mostyn, G. R., and Fell, R.: Landslides: prediction of travel distance and guidelines for vulnerability of persons, in: Proceedings of the 8th Australia New Zealand Conference on Geomechanics, edited by: Vitharana, N. and Colman, R., 105– 113, 1999.
Fyfe, J. A., Shaw, R., Campbell, S. D. G., et al.: The quaternary geology of Hong Kong, Hong Kong: Geotechnical Engineering Office (GEO), 2000.
GEO.: Landslides and boulder falls from natural terrain: interim risk guidelines, GEO Report No. 75, Geotechnical Engineering Office (GEO), Hong Kong, 1998.
Glade, T.: Vulnerability assessment in landslide risk analysis, Die Erde, 134(2), 121–138, 2003.
Harr, M. E.: Reliability-based design in civil engineering, Dover Publications, Inc., Mineola, New York, 1997.
Lacasse, S.: Risk assessment for geotechnical solutions offshore, 23rd Int. Conf. on offshore mechanics and arctic engineering, ASME [CD ROM], 2004.
Lacerda, W. A. and Santos Jr., O. F.: Water table fluctuation – A cause of slide initiation in residual and colluvial soils in tropical regions, in: 8th Int. Symposium on landslides, edited by: Brom-head, E., Dixon, N., and Ibsen, M.-L., Thomas Telford, London, 877–880, 2000.
Lam, C. C. and Leung, Y. K.: Extreme rainfall statistics and design rainstorm profiles at selected locations in Hong Kong, Technical Note No. 86, Royal Observatory, Hong Kong, 1994.
Lee, W. F., Liao, H. J., Chen, R. H., Wei, C. Y., and Huang, Y. M.: The development and application of the slope management system, in: Geotechnical engineering in the information technol-ogy age, edited by: DeGroot, D. J., DeJong, J. T., Frost, D., and Baise, L. G., ASCE [CD ROM], 2006.
Leroi, E., Bonnard, C., Fell. R., and McInnes, R.: Risk assess-ment and manageassess-ment, in: Landslide risk manageassess-ment, edited by: Hungr, O., Fell, R., Couture, R., and Eberhardt, E., Taylor and Francis, London, 159–198, 2005.
Lo, D. O. K., Ho, K. K. S., and Wong, H. N.: Effectiveness of slope maintenance in reducing the likelihood of landslide, in: Proceed-ings of the Annual Seminar on slope engineering in Hong Kong, edited by: Li, K. S., Kay, J. N., Ho, K. K. S., A.A. Balkema, Rotterdam, 251–258, 1998.
Morgenstern, N. R.: Toward landslide risk assessment in practice, in: Landslide risk assessment, edited by: Cruden, D. M. and Fell, R., A.A. Balkema, Rotterdam, 15–23, 1997.
Muir, I., Ho, K. K. S., Sun, H. W., Hui, T. H. H., and Koo, Y. C.: Quantitative risk assessment as applied to natural terrain landslide hazard management in a mid-levels catchment, Hong Kong, in: Int. Conf. on geohazards-technical, economical and social risk evaluation, edited by: Nadim, F., Pottler, R., Einstein, H., Klapperich, H., and Kramer, S., Lillehammer, Norway [CD ROM], 2006.
Nelson, W.: Theory and applications of hazard plotting for censored failure data, Technometrics, 14(4), 945–966, 1972.
Premchitt, J.: Salient aspects of landslides in Hong Kong, in: 9th Asian Regional Conf. on soil mechanics and foundation engi-neering, Bangkok, Thailand, 497–502, 1991.
Premchitt, J., Brand, E. W., and Chen, P. Y. M.: Rain-induced land-slides in Hong Kong, 1972–1992, Journal of the Hong Kong In-stitution of Engineers, 43–51, 1994.
Roberds, W. J.: Methodology for optimizing rock slope preventa-tive maintenance programs, in: Proceedings of the Geotechnical Engineering Congress, ASCE, edited by: McLean, F. G., Camp-bell, D. A., and Harris, D. W., Reston, Va., 634–645, 1991. Shiu, Y. K. and Cheung, R. W. M.: Case study on assessment of
global landslide risk in Hong Kong, 9th Int. Conf. on applica-tions of statistics and probability in civil engineering, Millpress, Rotterdam, 1393–1400, 2003.
Tang, W. H. and Cheung, R. W. M.: Performance-based modelling of slope reliability, in: 3rd Asian-Pacific Symposium on struc-tural reliability and its applications, edited by: Cho, H. N., Yun, C. B., and Kim, S. H., 65–79, 2004.
Van Westen, C. J., Van Asch, T. W. J., and Soeters, R.: Landslide hazard and risk zonationwhy is it still so difficult?, Bull. Eng. Geol. Environ., 65(2), 167–184, 2006.
Varnes, D. J.: Landslide hazard zonation: a review of principles and practice, in: IAEG Monograph, Paris: UNESCO Press, 1984. Wong, H. N. and Ho, K. K. S.: Systematic investigation of
land-slides caused by a serve rainstorm in Hong Kong, HKIE Trans-actions, 3(3), 17–27, 1997.
Wong, H. N., Ho, K. K. S., and Chan, Y. C.: Assessment of con-sequence of landslides, in: Landslide risk assessment, edited by: Cruden, D. M. and Fell, R., A.A. Balkema, Rotterdam, 111–149, 1997.
Wyllie, D. C., McCammon, N. R., and Brumund, W.: Planning slope stabilization programs by using decision analysis, Transp. Res. Record, 749, 34–39, 1980.