203
Friendly User Interface Design For Architects In
An Energy Simulation Tool
Iman Paryudi, Stefan Fenz
Abstract: An energy simulation tool is a tool to predict the energy consumption of a building. Today there are many energy simulation tools in the market. However, architects find that the existing energy simulation tools do not meet their needs. One thing that does not meet their need is the user interface. In relation to that, we carried out a user interface survey to know which user interface is preferred by architects. We found that architects prefer visual user interface (user interface that uses image) than textual user interface (user interface that merely uses text). In inputting value, they prefer to input it using drag-and-drop style rather than typing using keyboard. We also find that architects do not like to input too many values in the user interface.
Index Terms: Energy Efficient Building, Energy Simulation Tool, Human Computer Interaction, User Interface Design.
————————————————————
1
INTRODUCTION
An energy simulation tool is a tool to predict the energy consumption of a building that is used to maintain constant temperature of around 20oC. Today, there are many energy simulation tools in the market, either free or commercial. However, several studies show that architects find the current tools are inadequate, user hostile and incomplete [1]. From the perspective of many architects, most energy simulation tools are judged as too complex and cumbersome [2]. This is confirmed by findings that most existing energy simulation tools are not compatible with architects‘ working methods and needs [3]. Mahdavi [4] states that one of the most frequently mentioned shortcomings of existing tools is excessive data input requirement since this will be a problem in the early stages of design. In this stage, fairly detailed input information may not be available [5]. The statement above is supported by Lam, Wong, Henry [6] where their survey result shows that 69% of the respondents felt that the main limitation of the surveyed tools is the very extensive data input required. This can impose a very serious problem especially during the initial design stage where design information is very limited. Another shortcoming of the traditional simulation tools is problems of communication. This is in the form of non-intuitive and cumbersome user interface [4]. The user interface should be designed such that it is familiar, cognitive and compliments the concepts and processes of architectural design and energy modelling [7]. Morbitzer, Strachan, Webster, and Spires [8] agree that user interface at the early stage of the design, where rapid feedback is required, should be simple. In order to know which kind of user interface that is preferred by Architects, we have carried out a survey to answer this question. This paper will be presented as follows: we describe the principles of user interface design in Section 2. Proposed user interface is presented in Section 3, detail of the survey in Section 4. Sections 5 and 6 present survey result and discussion respectively. Section 7 will conclude the paper.
2 PRINCIPLES OF USER INTERFACE DESIGN
Human-Computer Interaction (HCI) is a discipline concerned with the design, evaluation and implementation of interactive computing systems for human use and with the study of major phenomena surrounding them [9]. The original technical focus of HCI is on the concept of usability. This concept was originally articulated naively in the slogan "easy to learn, easy to use‖. Usability is a quality attribute that assesses how easy user interfaces are to use. The word ‗usability‘ also refers to
204
According to the principle of direct manipulation, an object on the screen remains visible while a user performs physical actions on the object. When the user performs operations on the object, the impact of those operations on the object is immediately visible. An example for this is that a user can move a file by dragging an icon that represents it from one location to another [17]. Besides for aesthetic reason, user interface utilizes colour to increase productivity [13]. However, we must avoid over-using colour that becomes distracting [22] since it will degrade performance [13]. In using colour, we must follow the contrast rule: use dark text on light backgrounds and light text on dark backgrounds [23].
3
PROPOSED USER INTERFACE
This section will describe user interfaces that we have used in the survey. There are three user interfaces: user interface 1, user interface 2, and user interface 3.
3.1 User Interface 1
User interface 1 is depicted in Figure 1. The interface use light background colour and black big letters so the users can read them very clearly. To input a value in this interface, the users must type the value using keyboard. There are only two windows in this user interface: Enclosure and Aperture. This user interface is proposed because currently there are still many energy simulation tools using this kind of user interface.
Fig. 1. User interface 1.
3.2 User Interface 2
User interface 2 has different look from user interface 1 (Figure 2). The user interface 2 shows a box containing four values on the left and an image of a house on the right acting as a container. To the right of the box is a Building Properties box. To input data in this user interface, users must drag and drop a value from the four provided values into the container. Since this application is about a building, this metaphor informs the users where they must drop the value. Instead of using multiple windows, user interface 2 uses tabbed menu. Each menu represents each parameter. In this way, the users can move to other menus but still in the same window. The data inputted by the users are shown on Building Properties box. Hence users can see all the data they have inputted. This is a kind of direct manipulation where users can see all the process and the value in one window. This user interface is proposed since it is different from the common user interfaces used in the existing energy simulation tools.
Fig. 2. User interface 2.
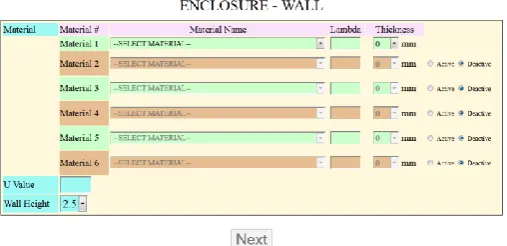
3.3 User interface 3
User interface 3 has similar look as user interface 1 (Figure 3). The difference is that the users input value by selecting a value from a drop down list. The other difference is that, in here users must select material in each layer and input the layer‘s thickness to get the value instead of just filling the u-value. This user interface has also more windows than user interface 1. It has four windows: Wall, Roof, Floor, and Aperture. This user interface is proposed because we want to know whether Architects really like more complex user interface which asking them to fill more data.
Figure 3. User interface 3.
3.4 Design considerations
205
read from the screen [27]. Zuffi, Brambilla, Beretta, Scala [28] state that a condition for achieving visual comfort is the readability of textual information. Readability is the property that allows reading easily sentences from the stimulus material, irrespectively of their meaning. Efficient readability requires good legibility of the displayed text, where legibility refers to the visual properties of a character or a symbol determining the ease with which it can be recognized. In order to increase the readability, user interfaces 1 and 3 also some part of user interface 2 use big font. The usage of big font will assure the text legibility hence readability. Vallerio, Zhong, and Jha [29] state that readability also depends on the colour scheme, contrast ratio and luminance. Human vision has different sensitivities to different colours. User interface with better colour schemes and contrast ratios are easier to read. On the other hand, Vee, Ling, Yee, Zainon [30] state that ―inappropriate usage of colours will distract users‘ attentions and cause an eyesore. Bright colours such as apple green colour, yellow colour and red colour should be avoided using too much in designing user interface. It is due to human pupil contracts while looking at those bright colours. The pupil contraction may cause muscular tiredness. Hence, soft or soothing colours are the best choices. One thing to be taken note is that mixture of light and bright colours has to be getting rid of. This mixture of colours will only increase the tiredness of the muscle because the pupil will dilate and contract continuously, where pupil dilate when looking at the soft colours but contract when looking at the bright colours. On the other hand, certain colours such as green and red colour should be avoided to be included under the same screen as there are users who suffer from colour blind. Theory of "blue peripheral vision" was introduced by cognitive science researchers as blue colour is said to be a good colour to grab humans' attention in the periphery‖. In designing the user interfaces, we use only soft colours. We do not use any bright colours in our design hence there are no mixture of bright and soft colours. This avoids eye muscle tiredness due to dilation and contraction of pupil when users look at a mixture of bright and soft colours. And in order to increase readability, we apply the contrast rule where we use black text on light background. Jansen [13] defines visual acuity as the ability of the eye to resolve detail. Regarding visual acuity, he explains that the retina of eye can only focus on about on a very small portion of a computer screen at any one time. This is because, at a distance greater than 2.5 degrees from the point of fixation, visual acuity decreases by half. Therefore, a circle of radius 2.5 degrees around the point of fixation is what the user can see clearly. In the GUI world, this is called the Rule of 1.7. Further, Jansen explains that at a normal viewing distance of 19 inches, 5 degrees translates into about 1.7 inches. Assuming a standard screen format, 1.7 inches is an area about 14 characters wide and about 7 lines high. This is the amount of information that a user can take in at any one time, and it limits the effective size of icons, menus, dialogs boxes, etc. If the user must constantly move his eyes across the screen to clearly focus, the GUI design is causing a lot of unnecessary and tiring eye movement. Applying the rule of 1.7, we limit the width and height of our user interface design. The consequence of this is that we will have more than one page. As in user interfaces 1 and 3, we have 2 and 4 pages respectively. The use of multiple short pages rather than one long page is also preferred by users since they do not like to scroll down [31]. The cognitive speed of the users can be
measured from the Hick Law. The Hick Law states that the reaction time, RT, required to make a decision based on N distinct and equally possible choices is given by the following equation: RT = a + b . log2N; where a and b are constants. The insight from this law is that to accelerate the human cognitive process, a GUI should present as few choices as possible [29]. Based on this law, user interface 2 only provides 4 choices so that the users can make a quick a decision on which value to be selected. The third process, motor speed, is based on Fitts‘ Law. The basic idea in Fitts‘ Law is that any time a person uses a mouse to move the mouse pointer, certain characteristics of objects on the screen make them easy or hard to click on. The farther the person has to move the mouse to get to an object, the more effort it will take to get to. The smaller the object is, the harder it will be to click on. It means that the easiest objects to locate and target are the ones closest to the mouse's current position and that have large target spaces [32]. Fitts‘ Law postulates that the time to select a control is a function of the distance moved and the size of the control. The average time (MT) to move a pointing device at a distance (d) to a target of size (s) is: MT = k' + c' log2(d/s) ; where k' and c' are constants. From this formula, we should reduce the distance travelled and make the size of things reasonable to increase speed [33]. Based on Fitts‘ Law, in order to reduce moving time, all three user interfaces we created use big button. The dropping area of the house image in user interface 2 is also made big enough and close enough to the values so that the users can drag and drop the value selected faster and easier. In user interface 2, we use tabbed navigation. This is because tabbed navigation has a number of advantages over buttons or text links. The most important is the subtle psychological effect it has. Tabs evoke using a notebook or binder. Each tab denotes a new section or topic. Tabs make people subconsciously think of physically moving to a new section of a site or application [14]. Vallerio, Zhong, and Jha [29] reported that the participants in their experiments greatly benefited from using the index tabs.
4 SURVEY
This section will describe the survey carried out to find the user interface preferred by Architects.
4.1 Participants
There are 15 respondents participating in the survey. They are all students of Department of Architecture, Faculty of Engineering, Pancasila University, Indonesia. They all have never used energy simulation tool.
4.2 Experimental Procedure
Participants are asked to try the three user interfaces. They can play with the application as long as they want. Afterwards, they have to answer questions on a questionnaire.
4.3 Questions
The questionnaire consists of closed and open questions. They choose one of four alternative answers to answer closed questions. In the open questions, they must write down his opinion.
5
RESULTS
206
26.7% chose user interface 1 and the rest chose user interface 3. The users choose user interface 1 because it is easy to use and it provides explanation in the form of tooltip. The users find that user interface 2 is communicative because using picture and architects are accustomed with picture. It is also easy to use and easy to understand by novice. The tabbed menu enables users to view only in one window. Meanwhile the users like user interface 3 because it has a list of materials from where users can select and the u-value is automatically calculated. When the participants are asked about their impressions on tabbed menu, 80% of them said that it is easy to use and the rest say difficult. And about icon of a house, 86.7% of them say that it helps them in using the application and 13.3% say no effect. And regarding the use of tooltip, all participants agree that the tooltip is useful.
6
DISCUSSION
In daily life, architects work with drawings. Therefore they like to work with images. That is why when choosing user interface, they like a user interface which uses images. They do not like a textual user interface. This may be the reason why most respondents choose user interface 2 as their favourite. Based on the statement above, user interface 3 may be the respondents‘ favourite if the list of material is presented in the form of list of images instead of list of texts. In here, the users can drag and drop the pictures in the list as in user interface 2. However, architects do not really understand technical detail like construction materials. Therefore, one of the respondents suggests a user interface without inputting materials. Another reason for the popularity of user interface 2 is the use of, although not exactly, principle of direct manipulation. In here, after the users input a value by dragging and dropping into the container, they can see the values they inputted in the same window. By having this, they can check whether the value they inputted is correct or not. The principle of direct manipulation is supported by the use of tabbed navigation since the users do not need to move to different window to fill all parameters. This allows users to make fewer errors and complete tasks in less time, because they can see the results of an action before completing the action, thus evaluating the output and compensating for mistakes [34]. The advantages of direct manipulation interfaces include their intuitiveness, simplicity, and flexibility. Novice users find this type of interface easier to learn than an equivalent command-based or menu-based interface [35]. Although different from existing user interface, user interface 2 is still easy to use. This is because the use of metaphor in the form of icon of a house and the use of tooltip. The metaphor tells the users that the icon is a container where they must drop the value they select. This is supported by the use of tooltip. When the mouse hover on top of the value, a tooltip of ―Drag me‖ will appear. And when the mouse hover on top of the house icon, a tooltip of ―Drop it here‖ will appear. By using those combination, there will be no confusion and frustation among the users on how to use the user interface 2. This is because one of the cause of users‘ frustation is when a system does not provide sufficient information to enable the users to know what to do [36]. There was one respondent suggested that the drag-and-drop interaction style in user interface 2 was replaced by double-click interaction style. The reason was double-click was easier than drag-and-drop. This suggestion was similar to survey result of Inkpen [37]. After carrying out a survey on comparison between drag-and-drop
and point-and-click mouse interaction styles for children, he found that the results were similar to previous results reported for adults: the point-and-click interaction style was faster; fewer errors were committed using it; and it was preferred over the drag-and-drop interaction style. Within the context of the puzzle-solving game, the children solved significantly fewer puzzles, and they were less motivated using the version that utilized a drag-and-drop interaction style as compared to the version that utilized a point-and-click interaction style.
7
CONCLUSION
The survey found that architects prefer visual user interface (user interface that uses image) than textual user interface (user interface that merely uses text). In inputting value, they prefer to input it using drag-and-drop style rather than typing using keyboard. However drag-and-drop style may be replaced by point-and-click style since previous survey found that point-and-click style works better than drag-and-drop style. We also found that architects do not like to input too many values in the user interface.
ACKNOWLEDGEMENT
Iman Paryudi would like to thank the Directorate General of Higher Education, Ministry of Education and Culture, Republic of Indonesia for the scholarship awarded to him.
REFERENCES
[1] S. Attia, ―State of the Art of Existing Early Design Simulation Tools for Net Zero Energy Buildings: A Comparison of Ten Tools,‖ http://www-climat.arch.ucl.ac.be/s_attia/attia_nzeb_tools_repor t.pdf.2011
[2] T. Hong, J. Zhang, and Y. Jiang, ―IISABRE: An Integrated Building Simulation Environment Building & Environment,‖ Building and Environment, Vol. 32 No. 3, pp. 219-224, 1997.
[3] S. Attia, L. Beltrán, A. De Herdea, J. Hensen, ―Architect Friendly: A Comparison of Ten Different Building Performance Simulation Tools,‖ Proc. Eleventh International IBPSA Conference, pp. 204 – 2011, 2009.
[4] A. Mahdavi, ―Computational decision a support and the building delivery process: necessary dialogue,‖
Automation in Construction, Vol. 7, pp. 205 – 211, 1998.
[5] A. Mahdavi. V. Hartkopf, V. Loftness, K. P. Lam, ―Simulation-based Performance Evaluation as a Design Decision Support Strategy: Experiences with the Intelligent Workspace,‖ Building Simulation, Australia, pp. 185 – 191, 1993.
[6] K. P. Lam, N. H. Wong, F. A. Henry, ―Study of the Use of Performance-based Simulations Tools for Building Design and Evaluation in Singapore,‖
Proc. Sixth International IBPSA Conference, 1999.
207
Diagnostics School of Architecture, Carnegie Melon University, 2004.
[8] C. Morbitzer, P. Strachan, J. Webster, B. Spires, D. Cafferty, ‖Integration of Building Simulation into the Design Process of an Architecture Practice,‖ Proc.
Seventh International IBPSA Conference, pp. 697 - 704, 2001.
[9] Hewet, Baecker, Card, Carey, Gasen, Mantei, Perlman, Strong, and Verplank, ―Chapter 2: Human-Computer Interaction,‖
http://old.sigchi.org/cdg/cdg2.html.2009.
[10] D. Sharma, ―Toward a new foundation Of Human-computer interaction,‖ Proc. 3rd International Conference on Electronics Computer Technology (ICECT), Kanyakamuri, pp. 395 – 397, 2011.
[11] D. Stone, C. Jarret, M. Woodrooffe, S. Minocha,
User Interface Design and Evaluation. First Edition, Morgan Kaufman, pp. 1 – 24, 2005.
[12] S. Martin, ―Effective Visual Communication for Graphical User Interface,‖
http://web.cs.wpi.edu/~matt/courses/cs563/talks/sm artin/int_design.html.
[13] B. J. Jansen, ―The Graphical User Interface: An Introduction‖. SIGCHI Bulletin, Vol. 30 No. 2, pp. 22 – 26, 1998.
[14] Webdesigner Depot, ―How to Design a Great User Interface,‖
http://www.webdesignerdepot.com/2010/10/how-to-design-a-great-user-interface/.2010.
[15] Design for Users, ―Tips for a User Friendly Interface,‖ http://www.design-for- users.com/website-design/tips-for-a-user-friendly-interface.html.2013.
[16] S. W. Ambler, ―Designing Web-Based User Interfaces,‖ http://www.drdobbs.com/architecture-and-design/184414719?cid=Ambysoft.2001.
[17] Apple Computer Inc., Apple Human Interface Guidelines, Addison-Wesley Publishing Company, Reading, Massachusetts, pp. 3 – 43, 1995.
[18] C. Benson, A. Elman, S. Nickell, C. Z. Robertson, ―GNOME Human Interface Guidelines 2.0,‖ The GNOME Usability Project, pp. 1 – 4, 2004.
[19] D. Fadeyev, ―12 Useful Techniques for Good User
Interface Design,‖
http://uxdesign.smashingmagazine.com/2009/01/19 /12-useful-techniques-for-good-user-interface-design-in-web-applications/.2009.
[20] J. Hobart, ―Principals of Good GUI Design,‖
http://classicsys.com/wp- content/uploads/2011/10/Principals-of-Good-GUI-Design.pdf.1995.
[21] Wikipedia, ―Interface metaphor,‖
http://en.wikipedia.org/wiki/Interface_metaphor.201 1.
[22] A. Marcus, K. Wieser, J. Armitage, V. Frank, E. Guttman, ―User-Interface Design for Medical Informatics: A Case Study of Kaiser Permanente,‖
Proc. 33rd Hawaii International Conference on System Sciences, pp. 1 – 11, 2000.
[23] S. W. Ambler, ―User Interface Design Tips, Techniques, and Principles,‖
http://www.ambysoft.com/essays/userInterfaceDesi gn.html.2010.
[24] L. Cortes, ―Designing a Graphical User Interface,‖
Medical Computing Today, May 1997.
[25] J. M. Carrol, ―Human computer interaction: psychology as a science of design,‖ Int. J. Human-Computer Studies, Vol. 46, pp. 501 – 522, 1997.
[26] S.K. Card, T.P. Moran, and A. Newell, The Psychology of Human-Computer Interaction. Hillsdale, N.J.: Lawrence Erlbaum Assoc., pp. 23 – 44, 1983.
[27] J.A.J. Roufs, M.C. Boschman, ―Text quality metrics for visual display units: I. Methodological aspects‖,
Displays, Vol. 18, pp. 37-43, 1997.
[28] S. Zuffi, C. Brambilla, G. Beretta, P. Scala, ―Human Computer Interaction: Legibility and Contrast,‖
Proc. 14th International Conference on Image Analysis and Processing (ICIAP), 2007.
[29] K. S. Vallerio, L. Zhong, N. K. Jha, ―Energy-Efficient Graphical User Interface Design,‖ IEEE Transactions on Mobile Computing, Vol. 5, No. 7, pp. 846 – 859, July 2006.
[30] C. K. Vee, C. S. Ling, W. S. Yee, W. M. N. W. Zainon, ―GUI Design Based on Cognitive Psychology: Theoretical, Empirical, and Practical Approaches,‖ Proc.8th International Conference on Computing Technology and Information Management (ICCM), pp. 836 – 841, 2012.
[31] G. L Geissler, ―Building customer relationships online: The web designers‘perspective,‖ Journal of Consumer Marketing, Vol. 18 No. 6, pp. 488 – 502, 2001.
[32] S. Berkun, ―Fitts's UI Law Applied to the Web,‖
http://msdn.microsoft.com/en-us/library/ms993291.aspx.2000.
[33] R. Gravelle, ―The Three Laws of Form Building,‖
208
[34] Wikipedia, ―Direct Manipulation Interface,‖
http://en.wikipedia.org/wiki/Direct_manipulation_int erface.2011.
[35] Ergo TMC, ―Chapter 11 - The User-Computer Interface,‖
http://ergotmc.gtri.gatech.edu/dgt/Design_Guideline s/hndchb28.htm
[36] C. X. Zhang, ―Chapter 5: Affective Aspects,‖
http://www.uncp.edu/home/xzhang/Teaching/HCI/s pring2010_onsite/Chapter_5_ID2e_slides.pdf.2007.