www.nat-hazards-earth-syst-sci.net/10/589/2010/ © Author(s) 2010. This work is distributed under the Creative Commons Attribution 3.0 License.
and Earth
System Sciences
Landslide tsunami hazard in the Indonesian Sunda Arc
S. Brune1, A. Y. Babeyko1, S. Ladage2, and S. V. Sobolev1
1Deutsches GeoForschungsZentrum GFZ, Telegrafenberg, 14473 Potsdam, Germany
2Bundesanstalt f¨ur Geowissenschaften und Rohstoffe (BGR), Stilleweg 2, 30655 Hannover, Germany
Received: 21 January 2010 – Accepted: 1 March 2010 – Published: 26 March 2010
Abstract. The Indonesian archipelago is known for the occurrence of catastrophic earthquake-generated tsunamis along the Sunda Arc. The tsunami hazard associated with submarine landslides however has not been fully addressed. In this paper, we compile the known tsunamigenic events where landslide involvement is certain and summarize the properties of published landslides that were identified with geophysical methods. We depict novel mass movements, found in newly available bathymetry, and determine their key parameters. Using numerical modeling, we compute possi-ble tsunami scenarios. Furthermore, we propose a way of identifying landslide tsunamis using an array of few buoys with bottom pressure units.
1 Introduction
1.1 Submarine slope failures
During the past decades, awareness has grown that subma-rine landslides can generate large tsunamis (e.g. Hampton et al., 1996; Yalc¸iner et al., 2003; Masson et al., 2006). The involvement of submarine mass movements could be proven amongst others for the 1929 Grand Banks tsunami (Heezen and Ewing, 1952; Piper and Aksu, 1987), the Aleu-tian tsunami of 1946 (Okal et al., 2003), the Skagway event in 1994 (Lander, 1995; Kulikov et al., 1996) and the Papua New Guinea tsunami in 1998 (Tappin et al., 1999; Okal, 1999). Volumes of tsunamigenic submarine landslides range between several million m3(i.e. 0.001 km3) for cliff failures or volcanic debris flows (H´ebert et al., 2002; Tinti et al., 1999; Maramai et al., 2005) to thousands of km3at formerly glaciated margins (Evans et al., 2005; ten Brink, 2009).
Major causes for submarine slope failures and landslide terminology are reviewed in Hampton et al. (1996): rapid
Correspondence to: S. Brune (brune@gfz-potsdam.de)
sedimentation plays a major role that is characteristic for river deltas or glacial troughs. Especially fine grained de-posits with high water content can be extremely undercon-solidated. If permeability is low and sedimentation rate high, the pore fluid can not drain and pore pressure increases. This reduces the effective shear strength and leads to instability. Elevated pore pressure can moreover result from melting of gas hydrates, as suspected for landslides in the North Atlantic (Sultan et al., 2004; Mienert et al., 2005), but also off Indone-sia evidences for gas hydrates have been found (Kopp, 2002). Another important cause is steepening of the slope. An in-crease of the slope angle due to tectonic movement, erosion or sedimentation might lead to oversteepening and eventu-ally to failure (Leynaud et al., 2009). At a critical slope, earthquake may provide the final trigger, as they can induce large vertical and horizontal soil acceleration. Many large re-cent tsunamigenic landslides have been ultimately triggered by earthquakes (Masson et al., 2006).
At many locations in Indonesia, the failure conditions could be fulfilled: Large amounts of sediments are deposited offshore Indonesia in accretionary wedges or at the slopes of forearc basins providing plenty of potential slide mate-rial (e.g. Susilohadi et al., 2005). At the Sunda Arc, many earthquakes larger than magnitude of 7.0 occur (Lay et al., 2005; Briggs et al., 2006; McCloskey et al., 2008) that have the potential to generate tsunamis, but also to trigger major submarine mass movements.
90
94
98
102
106
110
114
118
122
126
130
134
138
142
Longitude in deg
-12
-8
-4
0
4
8
L
a
ti
tu
d
e
i
n
d
e
g
1
2
5 4
3
6
1
4 3
2
7 6 5 8
9
10
12 11
13 15 14
Simeulue Nias
Siberut
S um
atra
Java
Bali Lombok
Sumbawa Sumba
Flores
Timor Seram Sulawesi
Borneo
New Guinea
Mindanao
S un
da T renc
h
Java Trench
7 cm/yr
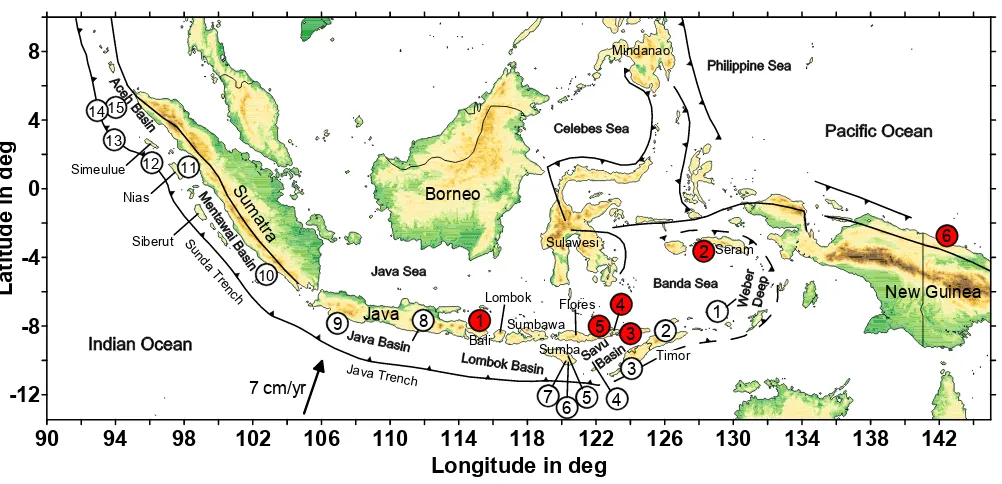
Fig. 1. Literature overview map. Locations where landslide tsunamis were witnessed are shown in red (see Sect. 2.1 for descriptions). White
circles represent places of geophysical evidence for landslides, some of these events might have been tsunamigenic (see Sect. 2.2).
in the Indonesian Sunda Arc region. Rapid identification of landslide tsunamis could be crucial for coastal communities. In the last section, we propose an identification method that compares the incoming tsunami signal to precomputed sce-narios of a large database. We discuss the scope of this tech-nique, by applying it to the eastern Sunda Arc, where the largest landslides have been found.
1.2 Tectonic background
The Indonesian archipelago consists of more than 18 000 islands and extends over 5000 km from Sumatra in the west to the Papua New Guinean border in the east. Indonesia is located at the junction of four major lithospheric plates: Eurasia, Indo-Australia, the Pacific, and the Philip-pine plates whose interplate fault zones exhibit volcanism and frequent earthquakes (Hamilton, 1979).
In the western part of Indonesia, oceanic lithosphere of the Indo-Australian plate subducts beneath the Eurasian plate representing a classical convergent margin system. A vol-canic arc has been formed on Sumatra, Java, Bali, Lombok, Sumbawa and Flores (Fig. 1). Several depositional basins are located adjacent to the arc (i.e. Aceh Basin, Mentawai Basin, Java Basin, Lombok Basin). The accumulation of sediments at the plate boundary produced an accretionary prism with a pronounced forearc high. Between the Sunda trench and Sumatra, it rises above sea level constituting the Mentawai Islands. Subduction direction changes from trench-perpendicular at the Java Trench to oblique at the Sumatra Trench. The oblique setting results in slip
parti-tioning between the subduction thrust and the trench parallel Sumatran strike-slip fault (McCaffrey, 2009). This process causes an increasing convergence rate from northwest (40– 50 mm/yr off Sumatra) to southeast (∼70 mm/yr off Java and Bali) (Simons et al., 2007).
In East Indonesia, active deformation and earthquakes take place within a complex zone of multiple micro plates and several subduction zones. The subduction of an oceanic em-bayment, for example, led to the formation of the horseshoe-shaped Banda Arc that comprises the islands of Flores, Timor and Seram (Hamilton, 1988; Hall, 2002).
The Indonesian Sunda Arc is particularly prone to earth-quake and tsunami hazard. According to the Harvard Centroid-Moment-Tensor Catalog, more than 30 earthquakes with magnitude 7 or greater took place during the last 30 years in the Sunda subduction zone (www.globalcmt.org). The largest event withMw=9.3 was the Sumatra-Andaman
earthquake of 2004 that ruptured over 1000 km (Kr¨uger and Ohrnberger, 2005; Lay et al., 2005; Ishii et al., 2005) gen-erating a catastrophic ocean-wide tsunami. Maximum run-up in Aceh reached more than 30 m (Borrero et al., 2006) and nearly 20 m in Thailand (Tsuji et al., 2006). Follow-ing this event, the GITEWS Project (German-Indonesian Tsunami Early Warning System) was initiated (Rudloff et al., 2009). At the southeastern part of the Sunda subduc-tion zone, off Java, Sumbawa and Sumba, devastating earth-quake tsunamis occurred during the last decades. The largest were theMw=8.3 Sumba Earthquake of 1977, the East Java
Earthquake (Mw=7.8) of 1994 and the Mw=7.7
run-up reached 8 m (Kato and Tsuji, 1995), 14 m (Tsuji et al., 1995a) and 20 m (Lavigne et al., 2007; Fritz et al., 2007), respectively.
2 Historical perspective
2.1 Known landslide tsunamis in the Indonesian region By triggering submarine mass failures, even moderate earth-quakes can generate locally disastrous tsunamis. Tsunami-genic slope failures have been observed multiple times in Indonesian history. Results of scientific surveys and witness accounts of the last centuries are published in tsunami catalogs (Iida, 1967; Soloviev, 1974; Soloviev, 1992; Rynn, 2002; www.ngdc.noaa.gov, http://tsun.sscc.ru/ htdbwld). Here, we summarize the known events in chrono-logical order (locations are mapped in Fig. 1):
(1) 1815 Bali: an earthquakeMS=7.0 triggered a
catas-trophic subaerial landslide at the foot of the coastal moun-tains. When it reached the shore, it induced a tsunami that flooded the surrounding area killing over 1000 people (Rynn, 2002; www.ngdc.noaa.gov).
(2) 1899 Seram Island: a magnitudeMS=7.8 earthquake
took place. Large subaerial landslides have been observed that together with the earthquake generated a local tsunami (www.ngdc.noaa.gov).
(3) 1979 Lomblen Island: the tsunami event of Lomblen Island (east of Flores) is the only one, where no earthquake took place. A spontaneous landslide is being accounted for the strong tsunami with heights of 7–9 m and inundation dis-tances of up to 1500 m. A characteristic first negative wave has been reported followed by a large positive second wave. The tsunami claimed 539 casualties and further 700 people missing from four villages (Soloviev, 1992).
(4) 1982 Flores: an earthquake of magnitudeMS=5.6 took
place at the eastern tip of Flores Island in December 1982. The caused landslides resulted together with the earthquake in a fairly undocumented tsunami that, nevertheless, claimed 15 lives (Rynn, 2002).
(5) 1992 Flores: ten years after the East-Flores tsunami, an earthquake struck in December 1992 at the northern coast of the island. Over 1000 people died because of the earthquake and another 1000 due to the generated tsunami. An inter-national survey team measured run-up of 2 m at Maumere, 3 m at Wuring and nearly 6 m at Babi Island (Tsuji et al., 1995b). Exceptionally large run-up was found in east Flo-res, with 11 m in Waibalan and 26 m in Riangkroko where even the foundations of houses were washed away. The over-all wave distribution could be explained assuming rupture on two seismic faults (Imamura and Kikuchi, 1994; Hidayat et al., 1995), however, the largest run-up values in Waibalan and Riangkroko are not explicable with a tectonic source model. In these areas, large landslides were triggered by the earth-quake (Yeh et al., 1993). Numerical landslide modeling re-sulted in wave heights comparable to the measured values,
confirming the landslide tsunami hypothesis (Imamura et al., 1995; Hidayat et al., 1995). A well studied case constitutes the tsunami behavior at the nearly conical Babi Island. Here, the largest run-up was found on the backward island side (Yeh et al., 1994; Liu et al., 1995). In numerical and analog experiments, this feature could be attributed to the splitting of the tsunami front when it reached the island. Two waves propagated around each side and superposed on the far island coast, leading to especially large run-up.
(6) 1998 Aitape, Papua New Guinea: only 130 km east of the Indonesian border, one of the best studied land-slide events took place 1998 near Sissano lagoon, west of Aitape. A catastrophic tsunami succeeded a comparatively small earthquake of magnitudeMW=7.0 (Harvard
Centroid-Moment-Tensor Catalog). Two weeks later, an international survey team found the extreme flooding confined to a shore-line area of 25 km but with maximum run-up heights of up to 15 m (Kawata et al., 1999; Davies et al., 2003). Neither could the large run-up be explained by “slow” earthquake source mechanics (Newman and Okal, 1998), nor did modeling of the earthquake tsunami yield comparable wave heights (Titov and Gonzalez, 1998). Thus an alternative tsunami source like a submarine slump was discussed. The hypothesis was sup-ported by offshore data collected during three ship cruises that revealed a landslide 30 km off Sissano lagoon (Tappin et al., 1999, 2001; Sweet and Silver, 2003). Further, hydroa-coustic wave records at Wake Island have been identified to represent the seismic signal of the submarine slump (Okal, 1999). The thereby associated timing of the mass failure corresponds very well to eyewitness accounts of tsunami ar-rival, as numerical tsunami modeling shows (Synolakis et al., 2002; Okal, 2003). Recent geometry interpretations revealed slump width, length and thickness of 4.2, 4.5, and 0.75 km, respectively, resulting in a slide volume of 6.4 km3(Tappin et al., 2008).
The above listed events are probably only a small subset of landslide generated tsunamis in the Indonesian region. Due to the strong localization of landslide tsunamis (Okal and Synolakis, 2003), events in areas of low population densi-ties might not have been observed at all. Furthermore, the contribution of landslides to tsunami generation, especially in historic cases, is not obvious and often matter of debate (Gusiakov, 2009). So tsunamis that are listed in catalogs as purely earthquake-generated might in fact have had a land-slide contribution (Gusiakov, 2002). It is suspected, for ex-ample, that the extreme run-up of 20 m at Permisan (Fritz et al., 2007) during the 2006 Central Java tsunami was caused by a landslide (Matsumoto, 2007).
2.2 Known landslides offshore Indonesia
events (locations are shown in Fig. 1). To our knowledge, we took into account every available publication in this field, whereby data were collected in form of seismic lines, swath bathymetry, sediment echosound data, backscatter data or vi-sual inspection. This landslide compilation can only be frag-mentary, as large portions of the ocean floor have not been mapped yet and complete coverage would obviously exceed financial possibilities. Furthermore, scientific attention is fo-cused on specific regions, for example the transition zone be-tween Sunda subduction and Timor Trough or the area of the 2004 and 2005 earthquakes, so the apparent frequency of landslides is strongly biased with scientific interest. The sur-veys were mostly conducted by geomorphologists who stud-ied tectonic processes in this region and not tsunami hazard posed by submarine slope failures. Therefore in some cases, important parameters like landslide thickness and width have not been evaluated.
(1) During the Snellius II Expedition, Jongsma et al. (1989) discovered seismic sequences at the lower slope of the Weber trough. The sequences show irregular bound-aries and are interpreted as slump deposits of about 50 m height. A subsequent slope stability study for the Banda Sea (Nitzsche, 1989) related slope steepness, sediment ma-terial, and possible seismic accelerations to calculate a factor of safety. Large areas of the Banda Sea are stated to be po-tentially unstable.
(2) In the Wetar Basin north of Timor, Masson et al. (1991) detected a chaotic slide sequence in seismic data. Areas of high back-scatter coincide with the slide. Unfortunately, no information on slide size has been published.
(3) A slump complex composed of several slide units is situated southwest of Timor (Karig et al., 1987). The area is 10 km wide and covers 200 km2. Maximal thickness amounts to 200 m.
(4) Van Weering et al. (1989) relate mass movements in the Savu Basin with acoustic voids in seismic data. Slump scars at the southwestern basin slope are reported that involve head scarps of up to 80 m. The apparently most recent slide is located in a depth of 1800 m featuring a thickness of 40 m and length of 2 km.
(5–7) Sumba Island has experienced more than 4 km up-lift during the last 7 million years (Rutherford et al., 2001). Thus, marine sediments of Miocene to Pliocene age are ex-hibited on land. This gives the opportunity to study se-quences of submarine mass movements directly. An early Pliocene slope failure that took place in a former water depth of 1–2 km is exposed near Kambatatana (Roep and Fortuin, 1996). Deposits exhibit a thickness of 20 m. The largest events on Sumba can be found near Kananggar (Fortuin et al., 1992). With 120 m height and a width of more than 10 km the slump complex covers a surface of at least 10 km2. Near Tanarare, slump deposits of 30 m thickness are described. All slides are found where slopes increased at failure age, sug-gesting tectonically induced oversteepening as main cause of instability (Fortuin et al., 1992).
(8) South of Central Java, mass movements can be associ-ated with seamount subduction (Kopp et al., 2006). A large slide is located at the southern side of the Java Basin. Slide parameters are not given. However, the bathymetry data in-terpreted in the present publication contains this event, in Sect. 2.3 we refer to it as slide 7.
(9) Near the Sunda Strait, buried slump structures are found in seismic lines (Susilohadi et al., 2005). The chaotic sequences are located at the northern side of the Java Basin with a length of nearly 10 km in slope direction. The sequences are 0.2 s TWT thick, corresponding to roughly 150 m (assumed sound speed: 1500 m/s, after Hamilton, 1985).
(10) Off South Sumatra, chaotic sediments dated to late Miocene age may be interpreted as slide or crept deposition. The sequence is 0.5 s TWT (i.e. 375 m) thick and more than 50 km long (Susilohadi et al., 2005).
(11) Beaudry and Moore (1985) identified small slumps in seismic lines of the western Nias Basin.
(12–14) Large blocky debris flows took place at the foot of the accretionary slope west of Northern Sumatra. Off Simeu-lue Island, largest blocks of 100 m height have been trans-ported up to 15 km away from the deformation front (Kopp et al., 2008). The volume of slide 14 was estimated to be 1 km3, while the largest block has a size of 0.2 km3(Moran and Tappin, 2006). In Sect. 2.3, we refer to these events as slides 1 to 3.
(15) A 6 km long slump has been identified in backscatter data at the western slope of the Aceh Basin (Seeber et al., 2007). Slide thickness must be quite small, as it is hardly visible in bathymetry data.
2.3 Landslides in new bathymetry data and tsunami calculations
Table 1. Geometrical landslide parameters. Length denotes downslope dimension of the slide body, while width refers to the extension
perpendicular to the slope. Numbers marked with a star (∗) are referenced to the largest block and not to the entire slide.
Longitude Latitude Depth Height Length Width Volume
(deg) (deg) (km) (m) (km) (km) (km3)
1 93◦100E 4◦100N 4.5 70∗ 3∗ 2∗ 1 2 94◦050E 2◦500N 4.6 100∗ 2.5∗ 1∗ 0.1∗ 3 96◦050E 1◦300N 5.1 110∗ 3∗ 2∗ 0.3∗ 4A 99◦580E 1◦250S 1.3 100 6 3 0.7 4B 99◦590E 1◦280S 1.3 100 6 2 0.5 4C 100◦010E 1◦300S 1.3 50 2.5 2.5 0.1 5A 104◦110E 6◦380S 1.9 50 4 3.5 0.3 5B 104◦180E 6◦380S 1.9 50 2 2 0.1 6 104◦450E 6◦580S 2.1 100 5 2 0.4
7 110◦310E 9◦180S 2.0 150 8 7 3
8 115◦570E 11◦060S 5.3 200 7 7 4
9 117◦520E 11◦04’S 5.3 200 8 23 15
10 118◦120E 11◦090S 6.0 100 4 7 1 11 118◦340E 11◦040S 6.1 300 5 25 15 12 119◦150E 11◦030S 5.0 300 10 18 20
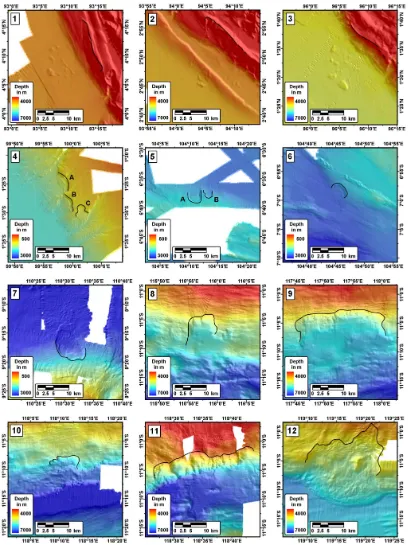
A compilation of bathymetric images is shown in Fig. 3. The landslides 1, 2, and 3 at the trench off Northern Suma-tra can be described as blocky debris avalanches. The mass movements started at the frontal thrust ridge and came to a halt within the trench area where several well-defined blocks are visible. The deposits of slide 2 overly a young thrust ridge, so probably the slides occurred before the ridge has formed tens of thousands of years ago (Henstock et al., 2006). Sites 4 to 7 are located at depths of 1.3 to 2 km at the foot of the forearc basins. Three events can be seen at site 4 (denominated 4A, 4B and 4C). The foot of slide 4A ex-hibits compressional features that are interpreted as the lower end of a listric failure surface. Two distinct landslides are distinguishable at location 5 (5A and 5B) located in prox-imity to slide 6 southwest of the Sunda strait. The largest events are situated at sites 8 to 12 near the eastern end of the Java Trench. Massive head scarps of several hundred me-ters height are found at the front of the accretionary prism. Nevertheless, associated landslide sediment deposits are not observable for slides 8 to 11. Slide 12, on the contrary, ex-hibits a large depositional lobe filling the trench area.
We quantify geometric parameters that are essential for tsunami calculation (Table 1). Slide dimensions perpendicu-lar and parallel to the slope are denoted as width and length, respectively. Slide heights are evaluated by comparing the slope profile inside the slide zone and besides it. Slide vol-umes are estimated based on slide height, length and width. We therefore assume a smooth slide shape with parabolic profiles in direction of both length and width.
We studied whether the slope failures generated a tsunami and how much run-up was generated at the shore using nu-merical tsunami modeling for the events at site 4 (Brune et
90 95 100 105 110 115 120
Longitude in deg -10
-5 0 5 10
L
a
ti
tu
d
e
i
n
d
e
g 12
3 4
5 6
7
8 9 11
10 12
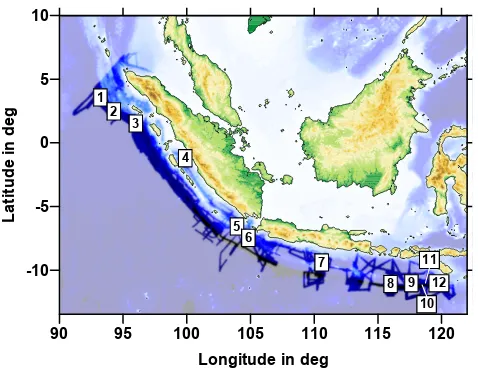
Fig. 2. Landslide locations. Bathymetric data coverage is depicted
in strong color. Note the large gaps in coverage off Java.
Fig. 3. Bathymetry images of the landslides. Please note the different depth scales for slides in for-arc basins (3000 to 500 m) and near the
trench (7000 to 4000 m). Head scarp interpretations are marked as black lines. Locations are mapped in Fig. 2. Slides 1, 2, 3, and 4 have been previously published by Moran and Tappin (2006), Henstock et al. (2006), Kopp et al. (2008, 2006), respectively.
results as effective “estimated run-up heights”. For a detailed description of the applied modeling techniques we refer to Brune et al. (2009b).
estimated run-up at Padang for the events 4A and 4B was each roughly 1 m (Brune et al., 2009a). The maximum run-up took place closer to the slide area, south of Padang, reach-ing 3 m. The largest run-up at Siberut Island on the opposite side of the forearc basin did not exceed 1 m. It is not possible to tell whether the landslides failed simultaneously or in suc-cession. An earthquake that induced the failure of one slump might have also triggered the other. In an additional study, we considered simultaneous landsliding by superposing the initial wave distributions. The resulting tsunami would have reached run-ups of up to 4 m south of Padang. Finally, we computed the wave field due to the third landslide 4C. How-ever, it did not generate a significant tsunami.
The largest slides of our study (sites 9, 11, and 12 with a volume of 15 to 20 km3) were found 150 km southeast of Sumba and 250 km south of Sumbawa (in Brune et al., 2009b, they are denominated C, E, and F, respectively). They generated large tsunamis with maximum run-up heights of nearly 6 m on Sumbawa for slides 9 and 11. The largest run-up for slide 12 took place in Leterua on Sumba, reaching 7 m. The arrival times of the computed tsunamis varied between 20 and 30 min for all areas exposed to large wave heights. 3 Landslide distribution
The distribution of landslides (Figs. 1 and 2) shows that mass movements occur everywhere on the submarine slopes of the Sunda Arc, however, the largest events cluster at the east-ern Java Trench. Surprisingly, despite thick sediment cover and frequent large earthquakes, comparably large events are missing off Sumatra. Keeping in mind that the overall num-ber of landslides is quite small, we propose the tentative statement that landslide size and the associated tsunami haz-ard is small off Sumatra and larger at the Java Trench.
To investigate the reason for this distribution we summa-rize the tectonic, geologic and seismological differences at the Sumatra and the Java Trench. Relative plate velocities between the Australian and the Sunda Plate increase from 60 mm/yr off Sumatra to 70 mm off Bali (Bock et al., 2003; Simons et al., 2007). Off Java and Bali, the Australian plates subducts nearly perpendicular to the trench, while slip par-titioning takes place at the oblique subduction at Sumatra. Most of the trench-parallel movement is effectuated along the Sumatran strike-slip fault, which leaves an orthogonal convergence rate of only 40 mm/yr at the Sumatra Trench (Chlieh et al., 2008). Sediment cover of the oceanic plate changes dramatically from the northwestern to the southeast-ern part of the Sunda margin. This is due to the fact that the main sediment supply in this region is derived from the Ben-gal fan (Curray et al., 2003). With less sediment supply in larger distance to the fan, the size of the accretionary prism decreases steadily to the southeast, so that the Java Trench does not contain any sediment fill along extensive distances (Kopp et al., 2006). An important mechanical factor for land-sliding is the inclination of the submarine slope. The slope
angle of an accretionary wedge depends on the sediment bal-ance at the trench resulting from the amount of material that is delivered by the oceanic plate, subducted into the mantle or accreted at the upper plate. If more material is being sub-ducted than delivered, the trench retreats landward and one speaks of tectonic erosion. If the frontal prism grows, the margin is termed accretionary. Which kind of mode is re-alized, depends among other parameters on orthogonal plate convergence rate and trench sediment thickness (discussed above). According to Clift and Vannucchi (2004), the Suma-tra Trench clearly belongs to the accretionary regime, with an estimated mean forearc slope angle of 1.4◦for the Suma-tra segment. The Java Trench, on the other side, exhibits features of tectonic erosion (Kopp et al., 2006) and the aver-aged forearc slope angle is 4◦ off Central Java. This could be the main reason for the large slide volumes at the Java Trench: Steep slopes that are locally further oversteepened by the mechanism of subduction erosion might eventually fail in large catastrophic events comparable to those exhib-ited off Sumba Island.
Differences in seismic activity between the Sumatra and the Java Trench can be related to the different ages of the sub-ducting plate: 40–70 Ma off Sumatra and 70–150 Ma off Java (Ghose et al., 1990; Widiyantoro and van der Hilst, 1996). Older plate segments at the Java Trench feature lower litho-spheric buoyancies and hence steeper dip angles upon sub-duction. Indeed, tomographic modeling suggests an increase in dip from Sumatra to Java (Ghose et al., 1990). This leads to a narrower seismogenic zone and lower coupling between subducting and overriding plate which results in the absence of huge seismic events (Burbidge et al., 2008). Evidence for lower coupling comes also from GPS data, as motion vectors of Java, Bali and Sumbawa point eastward, despite northward subduction (Bock et al., 2003). It is clear that earthquakes are a primary trigger for submarine landslides. Therefore it is astonishing that no large landslide could be found that was triggered by the 2004 Sumatra Earthquake. Tappin et al. (2007) argue that the sediment supply of the Bengal fan to the Sumatran accretionary prism has been reduced by the northward movement of the Ninetyeast Ridge in early Qua-ternary, thus promoting only small scale landslides. On all accounts, the landslide distribution discussed here is not con-trolled by earthquake magnitude.
4 Case study: hypothetical slide event off Bali
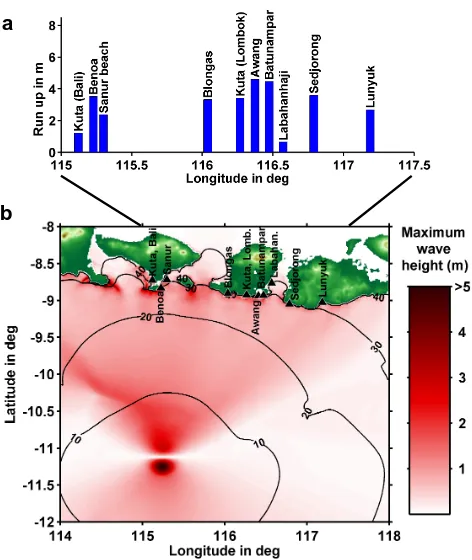
a
b
Fig. 4. (a) Estimated run-ups for a hypothetical 20 km3event off Bali. (b) Maximum wave heights and arrival times (in minutes). Virtual gauge locations are marked with blue triangles and abbrevi-ated names.
We compute the resulting tsunami using the modeling techniques summarized in Sect. 2.3. The distribution of maximum wave height can be seen in Fig. 4b. Offshore wave heights reach 2 m off Bali, 1.5 m off Lombok and decrease rapidly when entering the straits between the is-lands. Calculated run-up heights (Fig. 4a) reach nearly 4 m in Benoa, 2 m at Sanur beach and only 1 m in Kuta, which appears to be sheltered by the Bukit peninsula. Run-up on the southern coast of Lombok ranges around 4 m. These values somewhat depend on the assumed failure location. Moving the slide 70 km westward increases the run-up in Benoa up to 5 m while decreasing it in Lombok down to 2 m. Alternatively, moving the event 70 km eastward yields 3 m for Bali and 5 m for Lombok. Depending on current tidal conditions, these run-up values could be modified by±1 m (University of Hawaii Sea Level Center, http://uhslc.soest. hawaii.edu).
5 Investigating the possibility for real-time detection of landslide tsunamis
Underwater earthquakes can be detected rapidly by seismo-logical methods. Source parameters of a potentially induced tsunami can be estimated with reasonable precision by
es-tablished seismological (e.g., Lomax et al., 2007) or new GPS techniques (Blewitt et al., 2006; Sobolev et al., 2007). Tsunamigenic landslides, however, are very difficult to iden-tify. As the released seismic energy is usually very small, seismic stations are not effective in detecting slope failures. Okal (2003) identified landslide signals in hydrophone and seismic data, but the technique is not yet applicable in real time. Based on numerical modeling, Brune et al. (2009c) showed that tiltmeters can be used to detect a landslide in the course of the event. This method can be applied to large slides at formerly glaciated margins or volcanic islands, but not for the Sunda margin, where slide volumes are signifi-cantly smaller. A tsunami however, whether it was produced by an earthquake or a landslide, can be identified using accu-rate devices like coastal tide gauges, ocean bottom pressure sensors or GPS buoys (Gonz´alez et al., 2005; Kato et al., 2000; Sch¨one et al., 2010). In this section we propose a pro-cedure that, by measuring the landslide-generated tsunami, can be used to determine the location of slope failure and to predict tsunami heights at the coast. We thereby follow a database approach, where many theoretically possible sce-narios are computed and their essential parameters stored in a catalog. Measurements of wave height and arrival time at the gauges are then used to select scenarios of the database which in turn yield a range of possible coastal wave heights. First, we describe the database setup, taking as sample re-gion the eastern part of the Sunda margin. Then, we illus-trate the process of scenario selection. Finally, the function-ality is demonstrated for the landslide example of Sect. 4. We thereby assume that the tsunami was solely generated by a landslide. Superposition of landslide and earthquake tsunamis would result in a complicated wave field that will be more difficult to assess.
5.1 Database setup
A landslide tsunami database of a certain region has to cover all possible landslide generated tsunamis. Depending on the kind of slope failure, landslides may involve various param-eters like slide height, length and width, slide velocity and initial acceleration, sediment density, slope angle, runout dis-tance, radius of curvature and angular displacement. The resultant tsunami in the source region, however, can be de-scribed with reasonable accuracy by a smaller set of param-eters: initial wave height, wave length and the lateral dimen-sion (aspect ratio) (Watts et al., 2005; Synolakis et al., 2002). Thus, from the point of view of tsunami prediction, the set of parameters needed to describe a landslide can be reduced to a few essential parameters of the tsunami’s initial wave field. Therefore, the starting point to construct our database will be initial tsunami wave shapes instead of detailed scenarios of landslide motion.
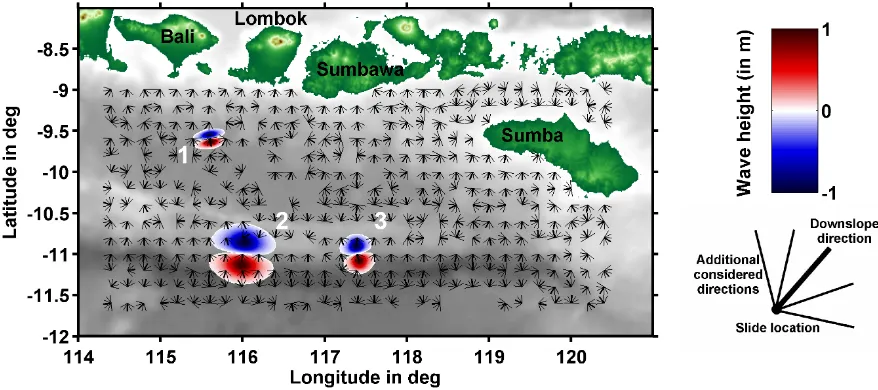
Fig. 5. Database scenario locations. Black dots represent slide locations and lines show considered slide directions as indicated in the sketch.
Three initial wave shapes are shown: (1) wave length of 10 km, aspect ratio 2, (2) wave length 30 km, aspect ratio 1, (3) wave length 20 km, aspect ratio 0.5. For orientation, ETOPO 1 bathymetry is underlain in grey scale.
defined on a rectangular grid covering our sample area (Lon-gitude range: 114.4◦E to 120.4◦E, Latitude range: –11.6◦S to –9◦S) with a spacing of 0.2◦ (Fig. 5). Locations at the bottom of the forearc and on the oceanic plate that feature a slope angle smaller than 0.5◦are excluded from the database.
The overall number of considered positions amounts to 384. The direction of the slide depends on the bathymetry gra-dient. Possible deviations from downslope movement as predicted by the bathymetry grid (ETOPO 1, Amante and Eakins, 2009) are taken into account for two reasons: (i) morphological details like canyons might not be resolved, (ii) slides with net lateral mass transport may occur, where initial sliding triggers adjacent instability. This will be less likely for steep slopes, thus for shallow gradients (<2◦) we vary the direction in 7 steps by±90◦, while for steep slopes (>2◦) we use 5 steps to account for±60◦(Fig. 5). The wave height of our database scenarios is uniformly set to 1 m. As-suming linearity, this allows for scaling of the initial height to match gauge measurements. The applied range of wave lengthλ(5 km, 10 km, 15 km, 20 km, 25 km, and 30 km) is aligned with the characteristic wave lengths of the tsunami-genic landslides investigated in Sect. 2.3: slides 4B and 12 involved a tsunami wave length of 5 km and 27 km, respec-tively (Brune et al., 2009a, b). Finally, the width of the initial wave form is varied with respect to the wave length. We thereby applied aspect ratios of 0.5, 1 and 2. So, each grid location is populated by 90 (if gradient is smaller than 2◦) or 126 (if gradient is larger than 2◦) scenarios resulting in a total scenario number of 48 384.
For each scenario an initial wave form was computed in analogy to Watts et al. (2005) (see also Brune et al., 2009b). The wave shape is composed of a wave crest and a trough in positive and negative slide direction, respectively. Along
the axis of movement, the wave profile is approximated by two Gaussians with opposite signs and a height of 1 m. The distance between their center points is set to one wave length. Thus, the initial wave with a wave length of 2λ
collapses into two wave trains of wave length λthat prop-agate in opposite directions. Perpendicular to the slide di-rection we apply a solitary-like extrapolation proportional to sech2(3·y/(a·λ+λ)) where y designates the coordinate in slide-perpendicular direction whilea denotes the aspect ra-tio (Watts et al., 2005). Three examples of initial wave forms are depicted in Fig. 5.
The tsunami propagation of every scenario is calculated on a rectangular grid (interpolated ETOPO 1, Amante and Eakins, 2009) with a step size of 30 arcseconds (926 m) in space and 2 s in time. Wave propagation is calculated for 90 min of system time. During this time span the tsunami of every scenario reaches all coastal points of interest. We ap-ply a linear shallow water code following the numerical al-gorithm of Kowalik and Whitmore (1991), which is explicit time-stepping on a staggered finite-difference grid. Fully re-flective boundary conditions are assumed along the shore-line. A linear scheme is used for two reasons: (i) during the inversion process, we take advantage of linearity in scal-ing the tsunami initial wave height in order to match gauge recordings. (ii) The linear program is very fast, and calcu-lation speed is essential for computing several ten thousand scenarios within reasonable time.
Full Database
Correct Polarity
Correct time difference at gauges
Compatible wave heights at gauges
Wave signal above detection threshold
Possible scenarios Full Database Full Database
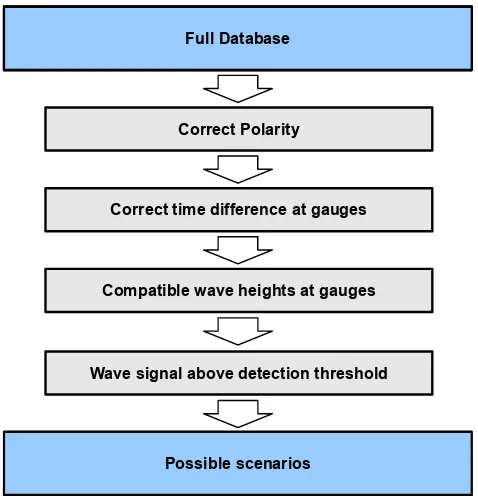
Fig. 6. Diagram of the database selection process. Blue rectangles
represent a set of scenarios, while grey ones stand for filters of the selection process.
5.2 Inversion concept
During a real event, tsunami height and arrival time can be gained from the buoy recordings. We use these data to extract possible scenarios from the fully populated database. We therefore apply four different filter mechanisms schematized in Fig. 6.
First, we require correct polarity, i.e. we discard every sce-nario whose sign of the wave height does not correspond to the measured wave polarity at the buoys.
The second filter is based on the correct difference in ar-rival time at the buoy stations: In contrast to earthquake in-duced tsunamis where seismological arrays yield the exact timing of an earthquake, the moment of generation is not known for landslides tsunamis. Hence, tsunami arrival at the first buoy t1 (or second buoy, t2) does not yet provide
a travel time. Merely the difference between both events
1t=t1−t2contains information on tsunami source location.
For a given 1t, the ensemble of possible tsunami origins is situated on a curved line (black contours in Fig. 7). As an example we consider a tsunami that reaches first buoy 1 and after a time 1t of 10 min it arrives at buoy 2. To reach buoy 1 it could have taken 5 min, 10 min, or 15 min, but due to the known1t the wave must have spend 15 min, 20 min, or 25 min, respectively, to arrive at buoy 2. These possibilities each correspond to a crossing of the green and the red isochrones in Fig. 7. The whole set of possible
Fig. 7. Tsunami travel time isochrones. Green, red and grey contour
lines represent the necessary travel time isochrones to reach buoys 1, 2, and 3, respectively (in minutes). The difference in arrival time 1tbetween buoys 1 and 2 is shown as black contour lines.
origins is marked by the black line with a 1t of 10 min. When extracting possible scenarios from the database, a certain tolerance in 1t has to be considered accounting for the discrete distribution of database source locations. In our calculations, a tolerance of 2 min provided good results.
The third filter relates to the measured wave height at the buoys. As mentioned beforehand, the database only contains scenarios with an initial wave height of 1 m. We denote the stored tsunami heights at the buoys withη∗1 andη2∗, while measured heights are designated η1 andη2 for buoy 1 and
2, respectively. Assuming linearity, we scale the initial wave height by a factor ofA1=η1/η∗1orA2=η2/η∗2for each buoy.
These factors have to coincide for the correct source loca-tion. During the filtering process, we compareA1 andA2
and if their difference is less than a tolerance of 20%, we consider the scenario possible. However, we do not allow ar-bitrary large amplification factors. If the initial wave height exceeds unphysical values of more than 50 m the scenario is discarded. To estimate wave heights at the coastal buoy 3, only one amplification factor is needed. In the following, we apply the maximum of both factorsA=max(A1,A2).
Tsunami detection using buoys necessitates a minimum tsunami amplitude that is related to the accuracy of the de-vice but moreover to the ubiquitous background noise of the oceanic wave field. Usually the detection threshold is in the order of a few centimeters (Gonz´alez et al., 2005). Here, we use a minimal detection wave height of 5 cm. During the last filtering process, scenarios involving wave heights below this value are discarded.
0 0.2 0.4 0.6 0.8 1 1.2 1.4 1.6 1.8 Maximum wave
height off Bali (in m)
e
−5 0 5 10 15 20 25 30
Time in min
dArrival buoy 1 Arrival buoy 2 First positive wave off Bali (’real’)
First positive wave off Bali (inverted)
−5 0 5 10 15 20 25 30
−1 −0.5 0 0.5 1 1.5
Wave height at Buoy 1 (in m)
a
−5 0 5 10 15 20 25
−1 −0.5 0 0.5 1 1.5
Wave height at Buoy 2 (in m)
b
−5 0 5 10 15 20 25 30
−1 −0.5 0 0.5 1 1.5
Wave height at Buoy 3 (in m)
c
Real
Inverted
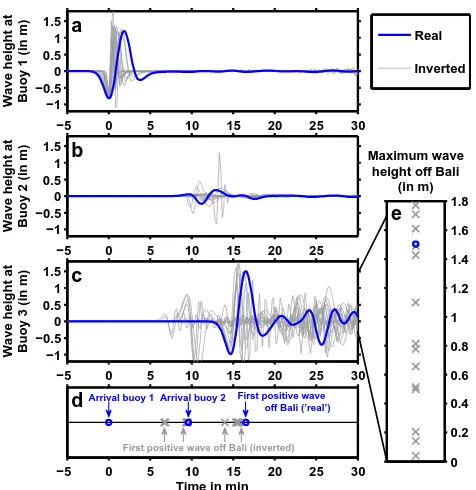
Fig. 8. Tsunami comparisons. Blue lines/circles designate the
“real” input event, grey lines/crosses the predictions. (a–c) Mare-ograms for the scenario off Bali. Buoy locations are shown in Figs. 7 and 9. (d) Time line of tsunami arrival. (e) Maximal wave heights at buoy 3.
wave heights at a final coastal location, i.e. buoy 3. Possible wave heightsη3at the coastal buoy are computed by
ampli-fying the precomputed wave heightη3∗with the amplification factor: η3=A·η∗3. This is done for every possible scenario
which results in a set of potential wave heights and their ar-rival times. This set constitutes the final outcome of our rou-tine.
5.3 Example for hypothetical Bali event
We exemplify the inversion routine for the case of the hy-pothetical 20 km3 slide south of Bali that was discussed in Sect. 4. Again, two buoys are positioned in the southern fore-arc basin. Predictions of wave height will be made off Bali, at the positions of the virtual buoy 3. In the following we will refer to the results of the input scenario as the “real” data.
The time series measured at buoy 1 and 2 are shown as blue lines in Fig. 8a and b. The tsunami reaches buoy 1 with a wave height of –0.8 m at the momentt1=0. This
informa-tion alone allows no conclusions about its origin and initial height nor about the arrival time and wave height at Bali. Af-ter 9.5 min it arrives at buoy 2 with a first extremum of 7 cm. We filter the database for correct polarity and difference in arrival time1t resulting in 620 possible scenarios. Requir-ing compatible wave heights at the buoy yields 15 scenarios, involving amplification factorsAbetween 4.8 and 15. One of these would not have been detectable at buoy 2 as its
de-Fig. 9. Locations of possible data base events (white circles) that
correspond to landslide scenario off Bali (red circle). Numbers in-side the circles show how many scenarios are conin-sidered possible at each position. Possible scenarios are situated on a curved line, compare Fig. 7.
tection threshold is 5 cm. This leaves 14 possible scenarios whose source locations are mapped in Fig. 9 (white circles). For comparison the slide position of the input scenario is de-picted in red. The numbers in the white circles show how many possible scenarios locate at that specific point. We recall that for each position at least 90 scenarios are stored in the database. Possible source locations are situated on a curved line. As discussed above, this reflects the influence of a fixed1ton the selection process (compare Fig. 7).
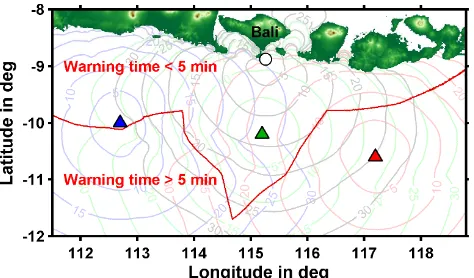
Fig. 10. Arrival times at buoys. Travel time isochrones (in minutes)
are plotted in the respective buoy color. The thick red line shows principal scope of early detection for a warning time of five minutes. Tsunamis that originate north of that line reach Bali in less than 5 min before two buoys experience a tsunami signal.
5.4 Remarks
In the previous section, we theoretically describe how buoy systems can be used to identify landslide tsunamis. Even though our computations yield promising results, this technique has to be carefully verified during real events be-fore the technique is implementable in a tsunami warning system. Nevertheless, we can derive some fundamental con-clusions.
In this study, the time between tsunami arrival at buoy 2 and the coast was only 7 min. Considering the effort of an evacuation this is an extremely brief period. For a given buoy distribution, there is always a tsunami source region so that warning time is very short. This region depends solely on tsunami travel times and thus on bathymetry. For the case of Bali, we map the region where warning time is less than 5 min (Fig. 10). We use positions of buoy 1, 2, 3 and an addi-tional buoy south of Java. Travel time isochrones are plotted in the respective buoy color. Locations where the tsunami arrives at Bali 5 min after it reached at least two buoys are marked by the red line. Thus, this line divides the area in two regions where the warning time for Bali is less or more than 5 min. The region with less than 5 min warning time is astonishingly large. It could be reduced by shifting the buoys landward, however, this would cause that events at the trench will be recognized later than before. Placing two buoys at the 5 min isochrone off Bali yields 5 min warning time for all events. However, this holds true only for Bali while adjacent areas would need their own gauges. This issue shows the fundamental difficulty of area-wide warning for landslides tsunamis, even with advanced buoy technology, simply be-cause landslide tsunamis are very localized and the possible origin is not known in advance.
Another problem associated with landslide tsunami detec-tion by buoys or tide gauges is the directivity of the wave. Largest waves can be expected in positive and in negative di-rection of movement. Perpendicular to the slope, however, waves interfere negatively and annihilate each other. Thus, an area adjacent to the slide exists, where wave heights are very small or zero, even if the slide itself is huge. That is the reason, why wave heights at buoy 2 in Sect. 5.3 are so much smaller than at buoy 1. The problem could only be solved by applying more measurement devices which can be very cost-intensive.
In this publication, we considered purely landslide-generated tsunamis and neglect any earthquake contribution. In most cases though, it is an earthquake that triggers slope failure. This might solve the problem of unknown landslide location, as one can assume the slide to happen within the area of strong shaking. Tsunami measurements at the closest buoy could then be used to give an estimation of the tsunami height at the source. On the other hand the wave field will be a superposition of the landslide and the earthquake tsunami and distinction between both origins will be very complex.
6 Summary
gauge measurements. With inverted location and initial wave height and wave length, predictions for near shore tsunami amplitudes are computed. This theoretical concept presumes that the tsunami was fully landslide-generated. Superposi-tions of landslide and seismic tsunamis are not taken into ac-count. The technique reveals fundamental problems of land-slide tsunami detection: for rapid identification, buoy net-works would have to be especially dense while due to the local nature of landslide tsunamis, warning times are very short.
Acknowledgements. This is publication 106 of the GITEWS
project (German Indonesian Tsunami Early Warning System). The project is carried out through a large group of scientists and engineers from GeoForschungsZentrum Potsdam (GFZ) and its partners from DLR, AWI GKSS, IFM-GEOMAR, UNU, BGR, GTZ, as well as from Indonesian and other international partners. Funding is provided by the German Federal Ministry for Education and Research (BMBF), grant 03TSU01.
Edited by: U. M¨unch
Reviewed by: H. Kopp and another anonymous referee
References
Amante, C. and Eakins, B. W.: ETOPO1 1 Arc-Minute Global Relief Model: Procedures, Data Sources and Analysis, NOAA Technical Memorandum NESDIS NGDC-24, 19 pp., 2009. Beaudry, D. and Moore, G. F.: Seismic Stratigraphy and Cenozoic
Evolution of West Sumatra Forearc Basin, AAPG Bull., 69(5), 742–759, 1985.
Blewitt, G., Kreemer, C., Hammond, W. C., Plag, H. P., Stein, S., and Okal, E.: Rapid determination of earthquake magnitude us-ing GPS for tsunami warnus-ing systems, Geophys. Res. Lett., 33, L11309, doi:10.1029/2006GL026145, 2006.
Bock, Y., Prawirodirdjo, L., Genrich, J. F., Stevens, C. W., McCaffrey, R., Subarya, C., Puntodewo, S. S. O., and Calais, E.: Crustal motion in Indonesia from Global Position-ing System measurements, J. Geophys. Res., 108(B8), 2367, doi:10.1029/2001JB000324, 2003.
Borrero, J. C., Synolakis, C. E., and Fritz, H.: Northern Suma-tra field survey after the December 2004 Great SumaSuma-tra earth-quake and Indian Ocean tsunami, Great Sumatra Earthearth-quakes and Indian Ocean Tsunamis of December 26, 2004 and March 28, 2005, Earthq. Spectra., 22(S3), S93–S104, 2006.
Briggs, R. W., Sieh, K., Meltzner, A. J., Natawidjaja, D., Galet-zka, J., Suwargadi, B., Hsu, Y. J., Simons, M., Hananto, N., Suprihanto, I., Prayudi, D., Avouac, J. P., Prawirodirdjo, L., and Bock, Y.: Deformation and slip along the Sunda Megathrust in the great 2005 Nias-Simeulue earthquake, Science, 311, 1897– 1901, 2006.
Brune, S., Babeyko, A. Y., Gaedicke, C., and Ladage, S.: Haz-ard assessment of underwater landslide-generated tsunamis: a case study in the Padang region, Indonesia, Nat. Hazards, doi:10.1007/s11069-009-9424-x, published online, 2009a.
Brune, S., Ladage, S., Babeyko, A. Y., M¨uller, C., Kopp, H., and Sobolev, S. V.: Submarine landslides at the eastern Sunda mar-gin: observations and tsunami impact assessment, Nat. Hazards, doi:10.1007/s11069-009-9487-8, published online, 2009b. Brune, S., Babeyko, A. Y., and Sobolev, S. V.: Are
tilt measurements useful in detecting tsunamigenic subma-rine landslides?, Geochem. Geophys. Geosy., 10, Q06002, doi:10.1029/2009GC002491, 2009c.
Burbidge, D., Cummins, P. R., Mleczko, R., and Thio, H. K.: A Probabilistic Tsunami Hazard Assessment for Western Australia, Pure Appl. Geophys., 165, 2059–2088, 2008.
Chlieh, M., Avouac, J. P., Sieh, K., Natawidjaja, D. H., and Galet-zka, J.: Heterogeneous coupling of the Sumatran megathrust constrained by geodetic and paleogeodetic measurements, J. Geophys. Res., 113, B05305, doi:10.1029/2007JB004981, 2008. Clift, P. D. and Vannucchi, P.: Controls on tectonic accretion versus erosion in subduction zones: implications for the origin and re-cycling of the continental crust, Rev. Geophys., 42, RG2001, doi 10.1029/2003RG000127, 2004.
Curray, J. R., Emmel, F. J., and Moore, D. G.: The Bengal Fan: morphology, geometry, stratigraphy, history and processes, Mar. Petrol. Geol., 19, 1191–1223, 2003.
Davies, H. L., Davies, J. M., Perembo, R. C. B., and Lus, W. Y.: The Aitape 1998 Tsunami: Reconstructing the Event from In-terviews and Field Mapping, Pure Appl. Geophys., 160, 1895– 1922, 2003.
Evans, D., Harrison, Z., Shannon, P. M., Laberg, J. S., Nielsen, T., Ayers, S., Holmes, R., Hoult, R. J., Lindberg, B., Haflida-son, H., Long, D., Kuijpers, A., Andersen, E. S., and Bryn, P.: Palaeoslides and other mass failures of Pliocene to Pleistocene age along the Atlantic continental margin of NW Europe, Mar. Petrol. Geol., 22(9–10), 1131–1148, 2005.
Fortuin, A. R., Roep, T. B., Sumosusastro, P. A., van Weering, T. C. E., and van der Werff, W.: Slumping and sliding in Miocene and Recent developing arc basins, onshore and offshore Sumba (Indonesia), Mar. Geol., 108, 345–363, 1992.
Fritz, H., Kongko, W., Moore, A., McAdoo, B., Goff, J., Harbitz, C., Uslu, B., Kaligeris, N., Titov, V., and Synolakis, C. E.: Ex-treme run-up from the 17 July 2006 Java tsunami, Geophysical Research Abstracts (GRA), 9, 10765, 2007.
Ghose, R., Yoshioka, S., and Oike, K.: 3-Dimensional Numerical-Simulation of the Subduction Dynamics in the Sunda Arc Re-gion, Southeast-Asia, Tectonophysics, 181(1–4), 223–255, 1990. Gonz´alez, F. I., Bernard, E. N., Meinig, C., Eble, M. C., Mofjeld, H. O., and Stalin, S.: The NTHMP Tsunameter Network, Nat. Hazards., 35, 25–39, 2005.
Grilli, S. T., ASCE, M., and Watts, P.: Tsunami generation by sub-marine mass failure Part I: Modeling, Experimental Validation, and Sensitivity Analyses, J. Waterw. Port. C.-ASCE, 131(6), 283–297, 2005.
Gusiakov, V. K.: “Red”, “green” and “blue” Pacific tsunamigenic earthquakes and their relation with conditions of oceanic sedi-mentation, in: Tsunamis at the End of a Critical Decade, edited by: Hebenstreit, G. T., Adv. Nat. Technol. Haz., 18, 282 pp., 2002.
Hall, R.: Cenozoic geological and plate tectonic evolution of SE Asia and the SW Pacific: computer-based reconstructions, model and animations, J. Asian Earth Sci., 20, 353–434, 2002. Hamilton, E. L.: Sound velocity as a function of depth in marine
sediments, J. Acoust. Soc. Am., 78(4), 1348–1355, 1985. Hamilton, W.: Tectonics of the Indonesian region, US Geol. Surv.
Prof. Paper, 1078, 345 pp., 1979.
Hamilton, W. B.: Plate tectonics and island arcs, Geol. Soc. Am. Bull., 100, 1503–1527, 1988.
Hampton, M. A., Lee, H. J., and Locat, J.: Submarine landslides, Rev. Geophys., 34, 33–59, 1996.
H´ebert, H., Piatanesi, A., Heinrich, P., and Schindel´e, F.: Numeri-cal modeling of the September 13, 1999 landslide and tsunami on Fatu Hiva Island (French Polynesia), Geophys. Res. Lett., 29(10), 1484, doi:10.1029/2001GL013774, 2002.
Heezen, B. C. and Ewing, W. M.: Turbidity currents and submarine slumps, and the 1929 Grand Banks (Newfoundland) earthquake, Am. J. Sci., 250, 849–873, 1952.
Henstock, T. J., McNeill, L. C., and Tappin, D. R.: Seafloor mor-phology of the Sumatran subduction zone: Surface rupture dur-ing megathrust earthquakes?, Geology, 34(6), 485–488, 2006. Hidayat, D., Barker, J. S., and Satake, K.: Modeling the Seismic
Source and Tsunami Generation of the December 12, 1992 Flo-res Island, Indonesia, Earthquake, Pure Appl. Geophys., 144, 537–554, 1995.
Iida, K., Cox, D. C., and Pararas-Carayannis, G.: Preliminary cat-alog of tsunamis occurring in the Pacific Ocean. HIG 67–10, Hawaii Institute of Geophysics, University of Hawaii, Honolulu, 131 pp., 1967.
Imamura, F. and Kikuchi, M.: Moment Release of the 1992 Flores Island Earthquake Inferred from Tsunami and Seismic Data, Sci. Tsunami Hazards., 12, 67–76, 1994.
Imamura, F., Gica, E., Takahashi, T., and Shuto, N.: Numerical simulation of the 1992 Flores tsunami: Interpretation of tsunami phenomena in northeastern Flores Island and damage at Babi Is-land, Pure Appl. Geophys., 144(3–4), 555–568, 1995.
Imamura, F., Shuto, N., Goto, C., and Ogawa, Y.: IUGG/IOC time project IOC manuals and guides No. 35, UNESCO, 1997 Ishii, M., Shearer, P. M., Houston, H., and Vidale, J. E.: Extent,
duration and speed of the 2004 Sumatra-Andaman earthquake imaged by the Hi-Net array, Nature, 435, 933–936, 2005. ITDB – Integrated Tsunami Database for the World Ocean,
Ver-sion 6.51, CD-ROM, Tsunami Laboratory, ICMMG SD RAS, Novosibirsk, Russia, 2007.
Jongsma, D., Woodside, J. M., Huson, W., Suparka, S., and Kadarisman, D.: Geophysics and tentative late Cenozoic seis-mic stratigraphy of the Banda Arc-Australian continent collision zone along three transects, Neth. J. Sea Res., 24(2–3), 205–229, 1989.
Karig, D. E., Barber, A. J., Charlton, T. R., Klemperer, S., and Hus-son, D. M.: Nature and distribution of deformation across the Banda Arc Australian collision zone at Timor, Geol. Soc. Am. Bull., 98, 18–32, 1987.
Kato, K. and Tsuji, Y.: Tsunami of the Sumba earthquake of August 19, 1977, J. Nat. Disaster Sci., 17(2), 87–100, 1995.
Kato, T., Terada, Y., Kinoshita, M., Kakimoto, H., Isshiki, H., Mat-suishi, M., Yokoyama, A., and Tanno, T.: Real-time observa-tion of tsunami by RTK-GPS. Earth Planet. Space, 52, 841–845, 2000.
Kawata, Y., Benson, B., Borrero, J. C., Borrero, J. L., Davies, H. L., de Lange, W. P., Imamura, F., and Letz, H.: Tsunami in Papua New Guinea was as intense as first thought, EOS T. Am. Geo-phys. Un., 80(9), 101 pp., 1999.
Kopp, H.: BSR occurrence along the Sunda margin: evidence from seismic data, Earth Planet. Sc. Lett., 197, 225–235, 2002. Kopp, H., Flueh, E. R., Petersen, C. J., Weinrebe, W., Wittwer, A.,
and Meramex Scientists: The Java margin revisited: Evidence for subduction erosion off Java, Earth Planet. Sc. Lett., 242, 130– 142, 2006.
Kopp, H., Weinrebe, W., Ladage, S., Barckhausen, U., Klaeschen, D., Flueh, E. R., Gaedicke, C., Djajadihardja, Y., Grevemeyer, I., Krabbenhoeft, A., Papenberg, C., and Zillmer, M.: Lower slope morphology of the Sumatra Trench system, Basin Res., 20, 519– 529, 2008.
Kowalik, Z. and Whitmore, P. M.: An investigation of two tsunamis recorded at Adak, Alaska, Sci. Tsunami Haz., 9, 67–84, 1991. Kr¨uger, F. and Ohrnberger, M.: Tracking the rupture of the Mw 9.3
Sumatra earthquake over 1150 km at teleseismic distance, Na-ture, 435, 937–939, doi:10.1038/nature03696, 2005.
Kulikov, E. A., Rabinovich, A. B., Thomson, R. E., and Bornhold, B. D.: The landslide tsunami of November 3, 1994, Skagway Harbor, Alaska, J. Geophys. Res., 101(C3), 6609–6615, 1996. Lander, J.: Nonseismic tsunami event in Skagway, Alaska, Tsunami
Newslett., 1, 8–9, 1995.
Lavigne, F., Gomez, C., Giffo, M., Wassmer, P., Hoebreck, C., Mar-diatno, D., Prioyono, J., and Paris, R.: Field observations of the 17 July 2006 Tsunami in Java, Nat. Hazards Earth Syst. Sci., 7, 177–183, 2007,
http://www.nat-hazards-earth-syst-sci.net/7/177/2007/.
Lay, T., Kanamori, H., Ammon, C. J., Nettles, M., Ward, S. N., Aster, R. C., Beck, S. L., Bilek, S. L., Brudzinski, M. R., But-ler, R., DeShon, H. R., Ekstrom, G., Satake, K. and Sipkin, S.: The great Sumatra- Andaman earthquake of 26 December 2004, Science, 308, 1127–1133, 2005.
Leynaud, D., Mienert, J., and Vanneste, M.: Submarine mass move-ments on glaciated and non-glaciated European continental mar-gins: A review of triggering mechanisms and preconditions to failure, Mar. Petrol. Geol., 26(5), 618–632, 2009.
Liu, P. L. F., Cho, Y. S., Briggs, M. J., Kanoglu, U., and Syno-lakis, C. E.: Runup of solitary waves on a circular Island, J. Fluid Mech., 302, 259–285, 1995.
Lomax, A., Michelini, A., and Piatanesi, A.: An energy duration procedure for rapid determination of earthquake magnitude and tsunamigenic potential, Geophys. J. Int., 170, 1195–1209, 2007. Maramai, A., Graziani, L., Alessio, G., Burrato, P., Colini, L., Cucci, L., Nappi, R., Nardi, A., and Vilardo, G.: Near- and far-field survey report of the 30 December 2002 Stromboli (Southern Italy) tsunami, Mar. Geol., 215(1–2), 93–106, 2005.
Masson, D. G., Milsom, J., Barber, A. J., Sikumbang, N., and Dwiyanto, B.: Recent tectonics around the island of Timor, east-ern Indonesia, Mar. Petrol. Geol., 8(1), 35–49, 1991.
Masson, D. G., Harbitz, C. B., Wynn, R. B., Pedersen, G., and Løvholt, F.: Submarine landslides: processes, triggers and haz-ard prediction, Phil. T. R. Soc. A, 364, 2009–2039, 2006. Matsumoto, T.: An underwater landslide or slump on an active
McCaffrey, R.: The Tectonic Framework of the Sumatran Subduc-tion Zone, Annu. Rev. Earth Pl. Sc., 37, 345–366, 2009. McCloskey, J., Antonioli, A., Piatanesi, A., Sieh, K., Steacy, S.,
Nalbant, S., Cocco, M., Giunchi, C., Huang, J. D., and Dunlop, P.: Tsunami threat in the Indian Ocean from a future megathrust earthquake west of Sumatra, Earth Planet. Sc. Lett., 265, 61–81, 2008.
Mienert, J., Vanneste, M., B¨unz, S., Andreassen, K., Haflidason, H., and Sejrup, H. P.: Ocean warming and gas hydrate stability on the mid-Norwegian margin at the Storegga Slide, Mar. Petrol. Geol., 22, 233–244, doi:10.1016/j.marpetgeo.2004.10.018, 2005. Moran, K. and Tappin, D.: SEATOS 2005 Cruise Report:
Suma-tra Earthquake and Tsunami Offshore Survey (SEATOS), 92 pp., available at: http://ocean.oce.uri.edu/seatos (last access: March 2010), 2006.
Newman, A. V. and Okal, E. A.: Teleseismic estimates of radiated seismic energy: The E/M0 discriminant for tsunami earthquakes, J. Geophys. Res., 103(B11), 26885–26898, 1998.
Nitzsche, M.: Submarine slope instability, eastern Banda Sea, Neth. J. Sea Res., 24(4), 431–436, 1989.
Okal, E. A.: The probable source of the 1998 Papua New Guinea tsunami as expressed in oceanic T waves, EOS. T. Am. Geophys. Un., Fall Meet. Suppl., Abstract S51C-04, 1999.
Okal, E. A.: T waves from the 1998 Papua New Guinea earthquake and its aftershocks: Timing the tsunamigenic slump, Pure Appl. Geophys., 160, 1843–1863, 2003.
Okal, E. A. and Synolakis, C. E.: A Theoretical Comparison of Tsunamis from Dislocations and Landslides, Pure Appl. Geo-phys., 160, 2177–2188, 2003.
Okal, E. A., Plafker, G., Synolakis, C. E., and Borrero, J. C.: Near-Field Survey of the 1946 Aleutian Tsunami on Unimak and Sanak Islands, B. Seismol. Soc. Am., 93(3), 1226–1234, 2003. Piper, D. J. W. and Aksu, A. E.: The source and origin of the 1929
grand banks turbidity current inferred from sediment budgets, Geo-Mar. Lett., 7, 177–182, 1987.
Roep, T. B. and Fortuin, A. R.: A submarine slide scar and chan-nel filled with slide blocks and megarippled Globigerina sands of possible contourite origin from the Pliocene of Sumba, Indone-sia, Sediment Geol., 103, 145 145–160, 1996.
Rudloff, A., Lauterjung, J., M¨unch, U., and Tinti, S.: Preface “The GITEWS Project (German-Indonesian Tsunami Early Warning System)”, Nat. Hazards Earth Syst. Sci., 9, 1381–1382, 2009, http://www.nat-hazards-earth-syst-sci.net/9/1381/2009/. Rutherford, E., Burke, K., and Lytwyn, J.: Tectonic history of
Sumba Island, Indonesia, since the Late Cretaceous and its rapid escape into the forearc in the Miocene, J. Asian Earth Sci., 19(4), 453–479, 2001.
Rynn, J.: A preliminary assessment of tsunami hazard and risk in the Indonesian region, Science of Tsunami Hazards, 20(4), 193 pp., 2002.
Sch¨one, T., Zech, C., Iligner, J., Roemer, S., Koeppl, M., Queisser, T., Stolarczuk, N., Selke, C., Manurung, P., Subarya, C., Mudita, I., and Pandoe, W.: Off- and onshore sea level monitoring, to be submitted, Nat. Hazards Earth Syst. Sci., 2010.
Seeber, L., Mueller, C., Fujiwara, T, Arai, K., Soh, W., Djajadi-hardja, Y. S., and Cormier, M. H.: Accretion, mass wasting, and partitioned strain over the 26 Dec 2004 Mw9.2 rupture off-shore Aceh, northern Sumatra, Earth Planet. Sc. Lett., 263, 16– 31, 2007.
Simons, W. J. F., Socquet, A., Vigny, C., Ambrosius, B. A. C., Haji Abu, S., Promthong, C., Subarya, C., Sarsito, D. A., Matheussen, S., Morgan, P., and Spakman, W.: A decade of GPS in Southeast Asia: Resolving Sundaland motion and boundaries, J. Geophys. Res., 112, B06420, doi:10.1029/2005JB003868, 2007.
Sobolev, S. V., Babeyko, A. Y., Wang, R., Hoechner, A., Galas, R., Rothacher, M., Sein, D. V., Schr¨oter, J., Lauterjung, J., and Subarya, C.: Tsunami early warning using GPS-Shield arrays, J. Geophys. Res., 112, B08415, doi:10.1029/2006JB004640, 2007. Soloviev, S. L. and Go, C. N.: A catalogue of tsunamis on the western shore of the Pacific Ocean. Academy of Sciences of the USSR, Nauka Publishing House, Moscow, 439 pp., 1974 (Cana-dian Translation of Fisheries and Aquatic Sciences No. 5077, 1984, translation available from Canada Institute for Scientific and Technical Information, National Research Council, Ottawa, Ontario, Canada K1A OS2, 447 pp.).
Soloviev, S. L., Go, C. N., and Kim, K. S.: Catalogue of Tsunamis in the Pacific 1969–1982, Academy of Sciences of the USSR, Soviet Geophysical Committee, Moscow, 1992, translated by Amerind Publishing Co. Pvt. Ltd, New Delhi, 210 pp., 1988. Sultan, N., Cochonat, P., Foucher, J. P., and Mienert, J.: Effect
of gas hydrate melting on seafloor slope instability, Mar. Geol., 213(1–4), 379–401, doi:10.1016/j.margeo.2004.10.015, 2004. Susilohadi, S., Gaedicke, C., and Ehrhardt, A.: Neogene
struc-ture and sedimentation history along the Sunda forearc basins off southwest Sumatra and southwest Java Marine Geology, Mar. Geol., 219, 133–154, 2005.
Sweet, S. and Silver, E. A.: Tectonics and Slumping in the Source Region of the 1998 Papua New Guinea Tsunami from Seismic Reflection Images, Pure Appl. Geophys., 160, 1945–1968, 2003. Synolakis, C. E., Bardet, J. P., Borrero, J. C., Davies, H. L., Okal, E. A., Silver, E. A., Sweet, S., and Tappin, D. R.: The slump origin of the 1998 Papua New Guinea Tsunami, Proc. R. Soc. Lond. A., 458, 763–789, 2002.
Tappin, D. R., Matsumoto, T., Watts, P., Satake, K., McMurtry, G. M., Matsuyama, M., Lafoy, Y., and Tsuji, Y.: Sediment slump likely caused 1998 Papua New Guinea tsunami, EOS T. Am. Geophys. Un., 80(30), 329 pp., 1999.
Tappin, D. R., Watts, P., McMurtry, G. M., Lafoy, Y., and Mat-sumoto, T.: The Sissano, Papua New Guinea Tsunami of July 1998-offshore evidence on the source mechanism, Mar. Geol., 175, 1–23, 2001.
Tappin, D. R., McNeil, L. C., Henstock, T., Mosher, D.: Mass wast-ing processes – offshore Sumatra, in: Advances in Natural and Technological Hazards Research Vol 27: Submarine Mass Move-ments and Their Consequences, edited by: Lykousis, V., Sakel-lariou, D., and Locat, J., Springer, Dordrecht, 327–336, 2007. Tappin, D. R., Watts, P., and Grilli, S. T.: The Papua New Guinea
tsunami of 17 July 1998: anatomy of a catastrophic event, Nat. Hazards Earth Syst. Sci., 8, 243–266, 2008,
http://www.nat-hazards-earth-syst-sci.net/8/243/2008/.
ten Brink, U.: Tsunami hazard along the U.S. Atlantic coast, Mar. Geol., 264(1–2), 1–3, 2009.
Tinti, S., Bortolucci, E., and Armigliato, A.: Numerical simula-tion of the landslide-induced tsunami of 1988 on Vulcano Island, Italy, B. Volcanol., 61, 121–137, 1999.
Tsuji, Y., Imamura, F., Matsutomi, H., and Synolakis, C. E.: Field Survey of the East Java Earthquake and Tsunami of June 3, 1994, Pure Appl. Geophys., 144(3/4), 839 pp., 1995a.
Tsuji, Y., Matsutomi, H., Imamura, F., and Takeo, M.: Damage to Coastal Villages due to the 1992 Flores Island Earthquake Tsunami, Pure Appl. Geophys., 144(3/4), 481 pp., 1995b. Tsuji, Y., Namegaya, Y., Matsumoto, H., Iwasaki, S. I., Kanbua,
W., Sriwichai, M., and Meesuk, V.: The 2004 Indian tsunami in Thailand: Surveyed runup heights and tide gauge records, Earth Planets Space, 58, 223–232, 2006.
van Weering, T. C. E., Kusnida, D., Tjokrosapoetro, S., Lubis, S., and Kridoharto, P.: Slumping, sliding and the occurrence of acoustic voids in recent and subrecent sediments of the Savu forearc Basin (Indonesia), Neth. J. Sea Res., 24(4), 415–430, 1989.
Ward, S. N. and Asphaug, E.: Asteroid impact tsunami of 2880 March 16, Geophys. J. Int., 153, F6–F10, 2003.
Watts, P., Grilli, S. T., Tappin, D. R., and Fryer, G. J.: Tsunami Generation by Submarine Mass Failure. II: Predictive Equations and Case Studies, J. Waterw. Port C.-ASCE, 131(6), 298-310, 2005.
Widiyantoro, S. and van der Hilst, R.: Structure and evolution of lithospheric slab beneath the Sunda arc, Indonesia, Science, 271(5225), 1566–1570, 1996.
Yalc¸iner, A. C., Pelinovsky, E., Okal, E., and Synolakis, C. E.: Submarine Landslides and Tsunamis, Kluwer Acad., Norwell, Mass., NATO Sci. Ser. IV, 21, 327 pp., 2003.
Yeh, H., Imamura, F., Synolakis, C. E., Tsuji, Y., Liu, P., and Shi, S.: The Flores Island Tsunamis, EOS T. Am. Geophys. Un., 74(33), 369, 371–373, 1993.