Mathematical Modeling Of Solar Air Collector
With A Trapezoidal Corrugated Absorber Plate
Ondieki H. O., Koech R. K., Tonui J. K., Rotich S. K.
Abstract: Modeling and simulation are considered as fast and cheap analytical tools by engineers in developing optimal solar energy systems for a given application prior to their construction. This study involved modeling and simulation of the solar air heater system. The modeling results showed a good agreement with the experimental results and the model was used to investigate the effects of the design parameters on the performance of SAH. It was observed that the efficiency of the collector increases with increase in both the collector length and width and the system attains its optimum values of efficiency between 1.0 to 2.0 m. In addition, better performances of the collector are obtained with smaller channel depths.
Key words: Solar air heaters, collector length & width, channel depth, solar radiation, efficiency
1.0
Introduction
The increasing pressure of energy demand, the environmental degradation through greenhouse gas emissions and the rise in fuel prices are the major driving forces behind the efforts of finding more effective ways of utilizing the various sources of renewable energy. Renewable technologies are considered as clean energy sources and optimal use of these resources minimizes environmental impacts and produces minimum secondary wastes, and such resources are sustainable based on current and future economic and social societal needs [1]. The growth of world population coupled with rising material needs has escalated the rate of energy usage. Rapid increase in energy usage characteristic in the past years cannot continue indefinitely as finite energy resources of earth are exhaustible [2]. Therefore, there is a need to explore the renewable energy sources to meet out the energy demand in present context [3]. Solar energy is the one most abundant renewable energy source. The primary forms of solar energy are heat and light. Sunlight and heat are transformed and absorbed by the environment in a multitude of ways [4]. One of the most potential applications of solar energy is the supply of hot air for the drying of agricultural, textile, marine products, heating of buildings to maintain a comfortable environment especially in the winter season [5]. The SAHs are solar systems that transform solar radiant energy into heat, which is transferred convectively from the absorber to the air flowing in the duct and are basically used for drying applications. The main disadvantage of SAHs stem on its low conversion efficiencies as a result of their poor thermal-physical properties.
Thus, more studies are being done to improve the thermal efficiency of the SAH systems by proposing the various ways of improving the heat transfer coefficients. Charters [6] considered the aspects of flow duct design for solar air heaters and pointed out that, there is no simple method to optimize the flow duct dimensions on purely technical considerations. Therefore, a combined technical and economical evaluation should be undertaken for each individual installation using the best cost and available local materials. Garg et al. [7] and Choudhury et al. [8] investigated the effect of channel depth on efficiency. Ho-Ming et al. [9] and Hegazy [10] performed a theoretical investigation on the effect of aspect ratio on the collector efficiency of solar heater systems. Bolaji [11] developed and evaluated the performance of a box type absorber solar air collector for crop drying. Lin et al. [12] carried out a parametric study to investigate the thermal performance of cross-corrugated solar air collectors. Many studies have been done both experimental and theoretical to improve the performance of solar heaters systems. Modeling and simulation are considered as fast and cheap analytical tools by engineers in developing optimal solar energy systems for a given application prior to their construction. This study involves modeling of a solar air heater system with trapezoidal corrugate absorber plate. The model is validated using the experimental values obtained from a prototype model built and tested outdoors.
2.0 Mathematical modelling
2.1 Theoretical Analysis
The collector under consideration consists of a glass cover and absorber plate with a well insulated parallel bottom plate, forming a rectangular duct profile through which the air to be heated flows. The corrugation of the absorber plate is trapezoidal in shape and the air is made to flow along the corrugation. The theoretical solutions of the thermal performance of the SAH system involve the formulation of the energy balance equations that describe the heat transfer mechanisms at each component of the solar air collector. The heat distribution through the air heater is as shown in Fig.1. The energy balance equations obtained are as follows:
On the glass cover:
p g
c g f
t g a
g
rp
T
T
h
T
T
U
T
T
h
(1)________________________
Ondieki H. O., Koech R. K., Tonui J. K., Rotich S. K.
University University of Eldoret, School of Science, Department of Physics, P.O Box 1125 Eldoret, Kenya
52
On the absorber plate:
AI
Ah
c
T
p
T
f
Ah
r,pg
T
p
T
g
AU
b
T
p
T
a
(2)The air flow:
out in
c
g f
c
p f
p
T
T
Ah
T
T
Ah
T
T
C
m
(3)
Fig. 1: Schematic diagram of flat plate solar collector with heat transfer parameters
The equations (1) to (3) are used to derive the solutions for the collector components‟ temperatures, i.e. Tp, Tg and Tout as follows:
b c rpg a b f c g rpg pU
h
h
T
U
T
h
T
h
AI
T
(4)rpg c t f c a t p rpg g
h
h
U
T
h
T
U
T
h
T
(5)
p g f
inp c p
out
T
T
T
T
C
m
h
A
T
2
(6)
It is assumed that there is linear temperature rise in the channel, hence Tf is evaluated as the mean of the inlet and the outlet temperatures:
2
in out fT
T
T
(7)
2.2 Heat Transfer Coefficients
The top heat transfer coefficient
U
t and wind heat transfer coefficient can be obtained by the expressions:g rp w t
h
h
U
(8)Where,
h
w is calculated from the following empirical correlation suggested by McAdams [15]:V
h
w
5
.
7
3
.
8
(9)The radiation heat transfer coefficient, (
h
r.gs), from the glass cover to the sky is obtained as [13]:
a g s g s g s g g s g rT
T
T
T
T
T
T
T
h
2 2
.
(10)Where the sky temperature
T
s is estimated by Swinbank [14]: 5 . 10552
.
0
a sT
T
(11)The radiation heat coefficient between the absorber plate and glass cover
h
r,pg is given
1
1
1
2 2 , g p g p g p g p rT
T
T
T
h
(13)The back heat loss coefficient
U
b by conduction through the back insulation is determined by the expression;d
k
U
b
i (13)The natural convection heat transfer coefficient between both the glass cover and the absorber plate and the airflow in the duct is calculated as [15]:
h c
D
k
Nu
h
(14)The hydraulic diameter is given by:
W
L
WL
D
h
2
(15)The Nusselt number can be approximated by the following correlation given by Hollands et. al [16]
1 5830 1708 1 8 . 1 sin 1708 1 44 . 1 1 3 1 6 . 1 RaCos
Cos Ra Cos
Ra
Where
is the angle of inclination of the collector andRa
is the Rayleigh number
v
TL
g
Ra
3 '
(17)
The notation [ ]+ in eqn (16) is used to denote that if the quantity in the bracket is negative, it should be set equal to zero. Also, the correlation is valid for 0o ≤ θ ≤ 75o
.
2.3 Theoretical solutions
The analytical solutions of the system temperatures Tp and
Tg as well as the outlet air temperature, Tout are given in Eqns. 4, 5 and 6 respectively. These equations cannot be solved directly because most of the heat transfer coefficients are functions of these temperatures. Hence, an iteration process is involved to solve and obtain the values of plate, glass and outlet temperatures. The iteration process involves the repetitive calculation of a numeric value until the new and the preceding values are equal or very close. In the iteration process, initial first guessed values are assigned to these system temperatures and used to calculate the convective and radiative heat transfer coefficients. The values of the calculated coefficients are then used to determine the new values of Tp, Tg and Tout. The newly calculated temperature values are compared with the previously assumed ones. The iterative process is repeated until all the consecutive system temperatures differs by less than 0.01 0C. The computer program, based on FORTRAN, was developed to perform the iteration process of the solar air collector.
3. Results and Discussions
3.1 Validation of the model
The validation of the model was done by comparing the predicted and the measured values of the system temperatures. The experimental results were measured on a prototype model built and tested outdoors at the department of physics. Fig. 2 shows the validation results, where the theoretical and experimental output air temperatures are compared for a selected representative day. The graph shows a plot of temperature against time of the day when the measurements were done. It is observed that the theoretical, To,cal and experimental, To,exp, output air temperatures are almost equal with a small deviation of less than 2.5 oC. This gives a good correlation between To,cal and To,exp.
Fig. 2: Correlation between the theoretical and experimental output temperature
Fig. 3: Comparison between the experimental and theoretical plate temperatures.
Fig. 3 shows the correlation between the theoretical and experimental values of the plate temperature against time. In order to measure the plate temperature, it is recommended to mount temperature sensors at several points on the absorber plate area to enable the average plate temperature to be obtained. This will give the average plate temperature more accurately but such process is cumbersome. Thus, the plate temperature is usually measured at two locations on the plate. One sensor is placed at ⅓ and the other at ⅔ from the inlet of the collector and their average value is used as the plate temperature. This is how the plate temperature was measured in the experimental model. In Fig. 3, the plate temperatures measured at the two locations, Tp1 and Tp2, are plotted together with the theoretical value. The results show that the theoretical values lie symmetrically between the two experimental values (i.e. at the ⅓ and ⅔ positions) and with a similar profile. Comparison between the theoretical values and the average of the two plate temperature values is also given in Fig. 4. The results show that the calculated and the average experimental values are almost equal throughout the day. In addition, the plate temperature in both cases increases to a maximum value at some time past mid-day when the solar radiation intensity is high and then starts to fall due to the decrease in the solar radiation intensity showing that the plate temperature depends on the amount of solar radiation intercepted on the absorber plate. It is also observed that the fall of the plate temperature does not assume the in-phase response to solar radiation due to the
0 10 20 30 40 50 60 70
10:00 10:30 11:00 11:30 12:00 12:30 13:00 13:30 14:00
Tout,exp
Tout,cal
TE
M
P
E
R
A
T
U
R
E (
oC
)
TIME (hr)
10 30 50 70 90 110
10:00 10:30 11:00 11:30 12:00 12:30 13:00 13:30 14:00
Tp,cal
Tp1
Tp2
TE
M
P
E
R
A
TU
R
E
(
oC
)
54 effect of thermal mass. The thermal mass provides „inertia‟
against temperature fluctuations resulting to a time lag between system‟s temperature and solar radiation.
Fig. 4: Representation of the trend of insolation and the corresponding correlation between Tp,exp and Tp,cal of the
representative day
3.2 Effect of Channel Depth
The channel depth is one of the design parameters that determine the performance of the solar air heater. The efficiency of the collector was determined at different ambient temperatures as the channel depth varied from 0.05 – 0.2 m. Fig. 5 shows the variation of the efficiency with channel depth for three different ambient temperatures. The results show that the efficiency of the collector decreases with increase in channel depth at all ambient temperatures. In addition, for a given channel depth, the collector efficiency is higher at low ambient temperatures than at high ambient temperature. Therefore, smaller channel depths can be used for natural flow mode to achieve high efficiencies. However, a decrease in channel depth increases the pressure drop in the collector channel hence need for pumping of air as in the case of forced flow mode systems. The pumping of air results to increase in the cost of operation of the collector due to the additional cost of pumping.
Fig. 5: Efficiency against channel depth at different inlet temperature
3.3 Effect of the collector length and width
The collector dimensions usually define the collector area and influences the mass flow rate and the convective heat transfer of the solar system. Their effect on the performance of the collector was investigated by determining the thermal efficiencies at different values of collector length and width. Figure 6 and 7 presents the results showing the effect of the collector length and collector width on thermal performance respectively.
0.0 0.5 1.0 1.5 2.0 2.5
5 10 15 20 25 30 35 40 45
Ta=20 Ta =30 Ta=40
Ef
fici
e
n
cy
(
%
)
Lenght ( m )
Fig. 6: Effect of collector length on efficiency at different inlet temperatures
0.0 0.5 1.0 1.5 2.0
0 4 8 12 16 20 24 28
Ta=20 Ta=30 Ta=40
Ef
fi
ci
e
n
cy
(
%
)
WIDTH ( m)
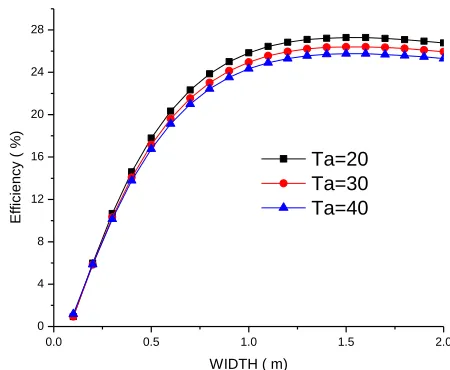
Fig. 7: Effect of collector width on efficiency at different inlet temperatures
It is observed that the efficiency at all ambient temperatures increases with increase in the collector length to about 2.0 m and thereafter decreases with further increase in length. Similarly, efficiency increases with increase in collector width attains its optimum efficiency when the width is between 1.0 – 1.5 m. The collector area usually determines the total amount of solar radiation that is intercepted by the SAH system. Thus, an increase in the collector length
40 50 60 70 80 90 100
800 850 900 950 1000 1050
10:00 10:30 11:00 11:30 12:00 12:30 13:00 13:30 14:00
Tp,exp Tp,cal
Insolation
T
e
m
p
e
ra
tu
re
(
oC
)
In
so
la
ti
o
n
(
W/
m
2)
TIME ( hr )
0.00 0.04 0.08 0.12 0.16 0.20
16 18 20 22 24 26
Ta=20 Ta=30 Ta=40
Efficiency ( % )
and/or collector width increases the surface area intercepting the solar radiation resulting to higher heat production in the SAH system. The length also increases the air residence time inside the solar collector channel and enhances the convective heat transfer rate between the absorber plate and the flowing air [9] (Ho-Ming 1999). This results to the increase in efficiency as the length increases. Conversely, the increase in collector length results to the increase in pressure drop and thermal losses. The increase in pressure drop is as a result of friction between the air and the channel walls whereas the increase in thermal losses is due to increase in surface area of the collector. This leads to a reduction in efficiency when the length exceeds 2.0 m. Therefore, the optimum collector length of the SAH system for optimum efficiency to be achieved should be between 1.5 -2.0 m.
4.0 Conclusion
The validation results showed a good agreement between experimental and modelling results hence the model could be used with confidence for analytical analysis of this type of SAH system and as a design aid for practical systems. The model was used to study the effects of design parameters on the performance of SAH. It was observed that system‟s efficiency is high with smaller channel depth and attains its optimum values of efficiency between 1.0 to 2.0 m for both length and width.
5. References
[1]. Tyagi V.V., Panwar N.L., Rahim N.A., Richa Kothari (2012) , Review on solar air heating system with and without thermal energy storage system, Renewable and Sustainable Energy Reviews 16
2289– 2303
[2]. Bhushan B, Singh R., (2010). A review on methodology of artificial roughness used in duct of solar air heaters. Energy; 35: 202–12.
[3]. Towler GP, Oroskar AR, Smith SE., (2004). Development of a sustainable liquid fuels infrastructure based on biomass. Environmental Progress; 23(4):334–41.
[4]. Panwar NL, Kaushik SC, Kothari S., (2011). Role of renewable energy sources in environmental protection: a review. Renewable and Sustainable Energy Reviews, 15:1513–24.
[5]. Tchinda R., (2009). A review of the mathematical models for predicting solar air heaters systems.
Renewable and Sustainable Energy Reviews,
13:1734–59
[6]. Charters, W. W. S. (1971). Some aspects of flow duct design for solar air heater applications. Solar Energy13: 283-288.
[7]. Garg, H. P., Datta, G. and Bhargava, A. K., (1984). Some studies on the flow passage dimension for solar air heating collectors. Energy Convers.mngt 24 No 3: 181-184.
[8]. Choudhury, C., Chauhan, P. M. and Garg, H. P. (1995). Design curves for conventional solar air heaters. Renewable energy (6) 739-749.
[9]. Ho-Ming Yeh,Chii-Dong Ho and Chun-Hung Chem. (1999). The effect of collector aspect ratio on the collector efficiency of sheet and tube solar fluid heaters. Tam-Kang journal of science and engineering (2) 61-68
[10]. Hegazy, A. A. (2000). Performance of flat plate solar air heaters with optimum channel geometry for constant/variable flow operation. Energy conversion management (41) 401-17.
[11]. Bolaji, B. O., (2005). Development and performance evaluation of a box-type absorber solar air heater for drying crops. Journal of food technology (3) 595-600.
[12]. Lin W. Gao W. and Liu T. (2006).A parametric study on the thermal performance of cross-corrugated solar air collectors. Applied Thermal Engineering (26) 1043–1053.
[13]. Zhai X. Q., Dai Y.J., Wang R.Z. (2005). Comparison of heating and natural ventilation in a solar house induced by two roof solar collectors.
Applied Thermal Engineering (25)741–757
[14]. Swinbank W.C. (1963). Long-wave radiation from clear skies. Quarterly Journal of the Royal Meteorological Society (89) 339.
[15]. Duffie, A.D., and Beckman, W. A., (1991) Solar Engineering of Thermal processes. 2nd Ed. New York: Wiley.
[16]. Hollands K.G.T., Unny T. E., Raithby G.D., Konicek L.J. “Free convection heat transfer across inclined air layers.” Transactions of the ASME, Journal of Heat Transfer98 (1976):189–193.
Nomenclature
A
Surface area of the collector (m2)p
C
Specific heat capacity of air at constant pressure (Jkg -1K-1)
a
T
Temperature (0C)p
T
Plate temperature (0C)out
T
Output temperature (0C)in
T
In-let temperature (0C)f
T
Average air temperature (0C)g
T
Glass temperature (0C)s
T
Sky temperature (0C)L
U
Overall heat loss coefficient (W/m2 K)t
56
b
U
Back heat loss coefficient (W/m2 K)V
Wind velocity (m/s)c
h
Convection heat coefficient (W/m2 K)g rp
h
Radiation heat loss coefficient from plate to glass (W/m2 K)s rg
h
Radiation heat loss coefficient from plate to sky (W/m2 K)w
h
Wind convection heat loss coefficient (W/m2 K.)R
F
Heat removal factor for solar air heaterI
Plane of array solar radiation (Wm-2)p
Absorptivity of the absorber platem
Mass flow rate (kgs-1)
The transmittance of the glass coverv
Kinematic viscosity (kg/m s)
Stefan–Boltzmann constant (W/m2 K4)g
Emmisivity of glassp
Emmisivity of the absorber plated
Insulation thickness (m)i
k
Thermal conductivity of insulation (W/m K)k
Thermal conductivity of air (W/m K)Nu
Nusselt numberL
Channel depth (m)h
D
The hydraulic diameter (m)W
Collector width (m)
Thermal expansion coefficient (K-1)g
Acceleration due to gravity (ms-2)
Collector tilt angle (degrees)Subscripts