INTRODUCTION
Despite progress in decreasing acute rejection and improving short-term sur-vival (1-4), much of it through im-proved immunosuppression and anti-infective agents, late kidney allograft loss remains a problem. Progressive graft function deterioration causes most kidney allograft losses and re-mains the central clinical challenge for improving long-term graft survival rate. With close to 5000 kidney trans-plants failing per year and returning the recipient to dialysis in the U.S., kid-ney transplant failure is a leading cause of end-stage renal disease (4).
Interstitial fibrosis and tubular atrophy (IF/TA) in renal allografts are the major hallmarks of progressive graft dysfunc-tion, with the result of a continuous de-crease in graft survival after one year post-transplant (3). The mechanisms that lead to IF/TA likely are of multifactorial na-ture, including immunological and hyper-tensive injury and immunosuppressant-related toxicity (3,4).
The complex, multistage processes that result in chronic IF/TA are poorly under-stood. Whereas the determination of organ failure often relies on measurable physiological parameters, the early stages of chronic IF/TA are difficult to diagnose.
Detection requires invasive procedures to obtain graft biopsies for histological eval-uation. Moreover, current methods for diagnosing allograft dysfunction are in-adequate for detecting the significant organ damage that occurs before the es-tablishment of clinical manifestations. The development of assays or novel tech-nologies that will able to detect allograft dysfunction/rejection and predict long-term outcomes is vital for the long-long-term success of transplantation (1-6).
The original nephron mass present in the donor kidney at transplantation de-pends on donor quality (e.g., age, hyper-tension). After kidney transplantation and as a consequence of the surgery stress, preservation methods, ischemia, acute rejection, and other stressors, the number of the initial nephrons in the donor kidney is reduced. Ordinarily, after six months posttransplantation, the number of nephrons is stable, resulting
with Tubular Atrophy and Interstitial Fibrosis
Daniel G Maluf,
1Valeria R Mas,
1,2Kellie J Archer,
3,4Kenneth Yanek,
1Eric M Gibney,
5Anne L King,
5Adrian Cotterell,
1Robert A Fisher,
1and Marc P Posner
1Address correspondence and reprint requests toDaniel Maluf, Division of Transplant, Depart-ment of Surgery, West Hospital 9th floor, 1200 East Broad Street, PO Box 980057, Richmond, VA 23298-0057. Phone: (804) 828-2461; Fax: (804) 828-5861; E-mail: [email protected]. Submitted October 23, 2007; Accepted for publication February 5, 2008; Epub (www. molmed.org) ahead of print February 7, 2008.
Departments of 1Surgery, 2Pathology, and 3Biostastistics, Division of Transplant, Virginia Commonwealth University, Richmond,
Virginia, United States of America; 4Center for the Study of Biological Complexity, Virginia Commonwealth University, Richmond,
Virginia, United States of America; and 5Division of Nephrology, Virginia Commonwealth University, Richmond, Virginia, United
States of America
Loss of kidney graft function with tubular atrophy (TA) and interstitial fibrosis (IF) causes most kidney allograft losses. We aimed to identify the molecular pathways involved in IF/TA progression. Kidney biopsies from normal kidneys (n = 24), normal allografts (n = 6), and allografts with IF/TA (n = 17) were analyzed using high-density oligonucleotide microarray. Probe set level tests of hypotheses tests were conducted to identify genes with a significant trend in gene expression across the three groups using Jonckheere-Terp-stra test for trend. Interaction networks and functional analysis were used. An unsupervised hierarchical clustering analysis showed that all the IF/TA samples were associated with high correlation. Gene ontology classified the differentially expressed genes as re-lated to immune response, inflammation, and matrix deposition. Chemokines (CX), CX receptor (for example, CCL5 and CXCR4), interleukin, and interleukin receptor (for example, IL-8 and IL10RA) genes were overexpressed in IF/TA samples compared with nor-mal allografts and nornor-mal kidneys. Genes involved in apoptosis (for example, CASP4 and CASP5) were importantly overexpressed in IF/TA. Genes related to angiogenesis (for example, ANGPTL3, ANGPT2, and VEGF) were downregulated in IF/TA. Genes related to matrix production-deposition were upregulated in IF/TA. A distinctive gene expression pattern was observed in IF/TA samples compared with normal allografts and normal kidneys. We were able to establish a trend in gene expression for genes involved in different pathways among the studied groups. The top-scored networks were related to immune response, inflammation, and cell-to-cell interaction, showing the importance of chronic inflammation in progressive graft deterioration.
in an allograft with normal function (4). For an important number of grafts, however, the loss of nephrons continues, reflecting continued graft injury. This con-dition ends in fibrosis and atrophy, with the final event loss of graft function (4).
Although different genes have been as-sociated with the biology of IF/TA (7-9), it is essential to advance the understand-ing of the immune response and the re-sponses of the transplanted organ to both immune and nonimmune injury mechanisms. Microarray is a powerful technology that detects thousands of genes simultaneously and might be an important tool in elucidating patterns for mechanism, diagnosis, prognosis, and treatment of complex, multifactorial diseases such as IF/TA (10).
In this study, we aimed to characterize the genes involved in the progression to IF/TA. We evaluated gene expression profiles in normal kidneys, normal allo-grafts, and kidney tissues with diagnosis of IF/TA.
MATERIALS AND METHODS
Kidney Samples and Patients The study included 23 kidney trans-plant recipients. Written informed con-sent was obtained from all the patients. The Western Institutional Review Board (WIRB) approved the study protocol. Renal allograft tissue was obtained using an 18-gauge biopsy needle. All the biop-sies were histologically evaluated. The biopsies were instantly submerged in RNAlater (Ambion, Austin, TX, USA) and homogenized. All biopsies were evaluated according to the Banff criteria (11). Twenty-four kidney biopsies with normal histopathology were also in-cluded in the study.
RNA Isolation from Kidney Tissues, cDNA Synthesis, and In Vitro
Transcription for Labeled cRNA Probe With minor modifications, the sam-ple preparation protocol follows the Affymetrix GeneChip Expression Analy-sis manual (Santa Clara, CA, USA). Total RNA was extracted from kidney tissue
samples using TRIzol (Life Technologies, Rockville, MD, USA). After extraction, integrity of RNA was checked using Agilent 2100 Bioanalyzer. The purity of the RNA preparations was tested by the 260/280 nm ratio (range 1.8-2.0). Briefly, total RNA was reverse-transcribed using T7-polydT primer, and converted into double-stranded cDNA using Superscript Choice System (One-Cycle Target Label-ing and Control Reagents, Affymetrix), with templates used for an in vitro tran-scription reaction at 37°C for 8 h to yield biotin-labeled antisense cRNA. The la-beled cRNA was chemically fragmented and made into a hybridization cocktail according to the Affymetrix GeneChip protocol, and was then hybridized to U133A 2.0 GeneChip probe arrays (Affymetrix). The array image was generated by the high-resolution GeneChip Scanner 3000 (Affymetrix). All CEL files were processed using Affymetrix GeneChip Operating
soft-ware, version 5.0, and appropriate Bio-conductor packages (12) available in the R programming environment (13).
Quality Control
RNA integrity from kidney tissues was checked using the Agilent 2100 Bioana-lyzer (Agilent Technologies). To be con-sidered for microarray analysis, the RNA samples needed to pass quality control criteria, 28S/18S ratios >1.5 and A260 nm/ A280 nm >2.0. We established a cutoff value of 30% rRNA contribution to the total area under the electropherogram for RNA samples to be considered as in-tact or undegraded (14). Products of cDNA synthesis and IVT were tested using the Agilent 2100 Bionalyzer (cDNA synthesis 1.5 kb < cDNA < 5.0 kb; IVT 1.0 kb < cRNA < 4.5 kb) (14).
Data Analysis
After hybridization of the cRNA sam-ples to Affymetrix HG-U133A 2.0 Array,
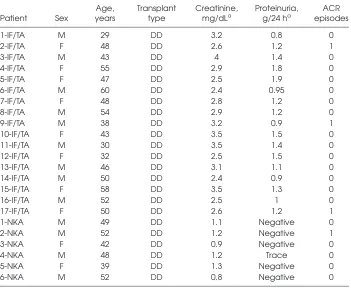
Table 1.Characteristics of the studied patients.
Age, Transplant Creatinine, Proteinuria, ACR Patient Sex years type mg/dLa g/24 ha episodes
1-IF/TA M 29 DD 3.2 0.8 0
2-IF/TA F 48 DD 2.6 1.2 1
3-IF/TA M 43 DD 4 1.4 0
4-IF/TA F 55 DD 2.9 1.8 0
5-IF/TA F 47 DD 2.5 1.9 0
6-IF/TA M 60 DD 2.4 0.95 0
7-IF/TA F 48 DD 2.8 1.2 0
8-IF/TA M 54 DD 2.9 1.2 0
9-IF/TA M 38 DD 3.2 0.9 1
10-IF/TA F 43 DD 3.5 1.5 0
11-IF/TA M 30 DD 3.5 1.4 0
12-IF/TA F 32 DD 2.5 1.5 0
13-IF/TA M 46 DD 3.1 1.1 0
14-IF/TA M 50 DD 2.4 0.9 0
15-IF/TA F 58 DD 3.5 1.3 0
16-IF/TA M 52 DD 2.5 1 0
17-IF/TA F 50 DD 2.6 1.2 1
1-NKA M 49 DD 1.1 Negative 0
2-NKA M 52 DD 1.2 Negative 1
3-NKA F 42 DD 0.9 Negative 0
4-NKA M 48 DD 1.2 Trace 0
5-NKA F 39 DD 1.3 Negative 0
6-NKA M 52 DD 0.8 Negative 0
NKA, normal kidney allograft; DD, deceased donor; ACR, acute cellular rejection. aAt
probe set expression summaries were es-timated using the robust multiarray aver-age method (15). Quality assessment of each GeneChip was performed by as-sessing the average background, scaling factor, percent present calls, the 3′:5′ratio for GAPDH, β-actin and ISGF, and the overall 3′:5′ratio with associated 95% con-fidence interval (16) using the publicly available application (17). Classic multidi-mensional scaling (MDS) was applied to the standardized quality control (QC) var-iables and the resulting two-dimensional MDS plot to determine whether any chips had outlying quality. Before conducting additional statistical analyses, all control probe sets were removed, leaving 22,215 probe sets for statistical analysis.
Probe set level tests of hypothesis tests were conducted to identify genes with a significant trend (increase or decrease) in gene expression across the three groups using Jonckheere-Terpstra test for trend. That is, we were interested in identifying genes with expression levels increasing normal donor > normal allograft > IF/TA, or decreasing normal donor < normal allograft < IF/TA across the three groups.
Interaction Networks and Functional Analysis
Gene ontology and gene interaction analyses were executed using Ingenuity Pathways Analysis tools 3.0 (http:// www.ingenuity.com). The gene lists con-taining Entrez GeneIDs as clone identi-fiers, as well as fold-change values from corresponding supervised analyses, were mapped to their corresponding gene ob-ject in the Ingenuity Pathways Knowl-edge Base (IPKB). These so-called focus genes were then used in the network gen-eration algorithm, based on the curated list of molecular interactions in IPKB. Sig-nificance for the enrichment of the genes in a network with particular biologic functions was determined by the right-tailed Fisher exact test, using a list of all the genes on the array as a reference set.
Validation of Microarray Results Real-time PCR (QPCR) reactions were used for quantifying the expression of
transforming growth factor (TGF)-β, thrombospondin-1 (TSP-1), and epidermal growth factor receptor (EGFR) mRNA in the stock RNA samples that were sub-jected to microarray study. Each assay consisted of two unlabeled PCR primers and a FAM dye-labeled TaqMan MGB probe. The endogenous control, β -2-microglobulin (B2M), was detected with a VIC dye-labeled TaqMan MGB probe (human B2M endogenous control, VIC/ TAMRA Probe; Primer Limited, Applied Biosystems). Total RNA from each sam-ple was subjected to reverse transcription using TaqMan Reverse Transcription Reagents (Applied Biosystems) accord-ing to the manufacturer’s protocol. Real-time PCR reactions were carried out in a 25-µL reaction mixture using an ABI Prism 7700 sequence detection system (Applied Biosystems). All amplifications were carried out in duplicate, and threshold cycle (Ct) scores were averaged for calculations of relative expression values. The Ctscores for genes of interest were normalized against Ctscores for the corresponding B2M control. Relative expression was determined by the fol-lowing calculation where the amount of
target is normalized to an endogenous reference (B2M RNA) and relative to an arbitrary calibrator (the reference class of patients used in the comparison) (18): relative expression = 2-∆∆Ct, where ∆∆Ct=
(∆Ctof experimental group) – (∆Ctof
cali-brator group).
RESULTS
Patients
Seventeen kidney transplant patients with biopsy-proven diagnosis of IF/TA and six transplant kidneys with normal histopathology were included in the study. Among the patients with IF/TA were eight women and nine men, rang-ing in age from 29 to 60 years (mean 46.0 ± 9.3), all deceased donor recipients. Among the kidney transplant patients with normal allograft function (all de-ceased donor recipients), biopsies were performed at 12 ± 3 months posttrans-plantation. All the patients had creatinine <2 mg/dL and proteinuria <500 mg/24 h. Immunosuppression consisted of either a cyclosporine-based (seven patients) or tacrolimus-based (16 patients) regimen. For patients with IF/TA, biopsies were
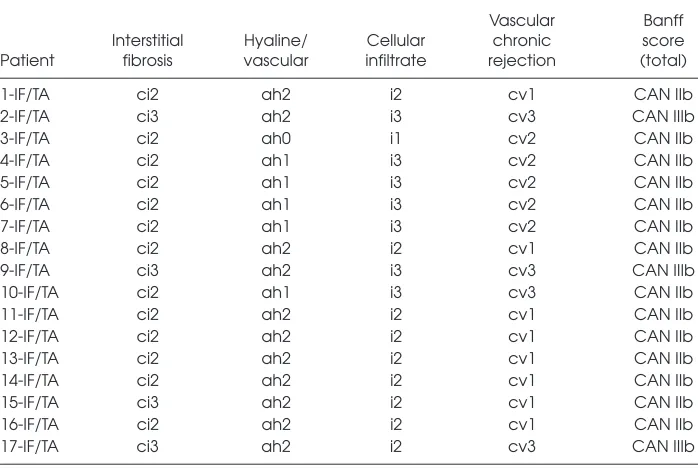
Table 2.Histological evaluation of IF/TA biopsies using Banff 97 (11)
Vascular Banff Interstitial Hyaline/ Cellular chronic score Patient fibrosis vascular infiltrate rejection (total)
1-IF/TA ci2 ah2 i2 cv1 CAN IIb
2-IF/TA ci3 ah2 i3 cv3 CAN IIIb
3-IF/TA ci2 ah0 i1 cv2 CAN IIb
4-IF/TA ci2 ah1 i3 cv2 CAN IIb
5-IF/TA ci2 ah1 i3 cv2 CAN IIb
6-IF/TA ci2 ah1 i3 cv2 CAN IIb
7-IF/TA ci2 ah1 i3 cv2 CAN IIb
8-IF/TA ci2 ah2 i2 cv1 CAN IIb
9-IF/TA ci3 ah2 i3 cv3 CAN IIIb
10-IF/TA ci2 ah1 i3 cv3 CAN IIb
11-IF/TA ci2 ah2 i2 cv1 CAN IIb
12-IF/TA ci2 ah2 i2 cv1 CAN IIb
13-IF/TA ci2 ah2 i2 cv1 CAN IIb
14-IF/TA ci2 ah2 i2 cv1 CAN IIb
15-IF/TA ci3 ah2 i2 cv1 CAN IIb
16-IF/TA ci2 ah2 i2 cv1 CAN IIb
17-IF/TA ci3 ah2 i2 cv3 CAN IIIb
performed between 15 and 58 months after kidney transplantation (mean 36 ± 12 months). Patient serum creatinine levels ranged from 2.4 to 4.0 mg/dL (mean 2.9 ± 0.5 mg/dL), with proteinuria >500 mg/24 h in all the patients (Table 1). Biopsies were graded 2 or 3 CAN per Banff classification (11) (Table 2).
Quality Control
All RNA samples met all of the quality control criteria for sample preparation. Moreover, RNA amount isolated from all the kidney biopsies was sufficient for the microarray studies using the One-Cycle Target Labeling and Control Reagents (Affymetrix). IVT and cDNA synthesis were checked in all the samples, showing
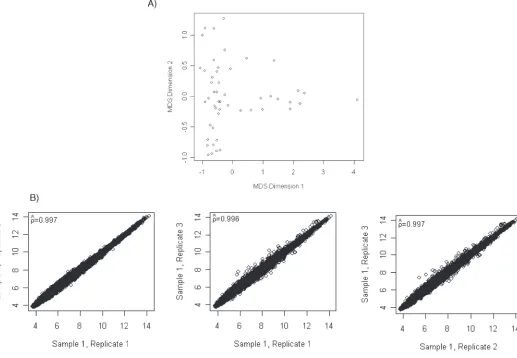
satisfactory results in concordance with the pre-established quality control crite-ria. Results from the quality assessments revealed that eight GeneChips had a lower confidence limit exceeding 1-however, these lower limits only ranged from 1.01 to 1.76. Due to the other quality assess-ments indicating similarity across GeneChips, these samples were ascer-tained to meet quality standards. A scat-terplot of the MDS plot revealed no fur-ther quality concerns (Figure 1A).
Interassay Reproducibility Analysis for Kidney Tissue Samples
To further assess reproducibility using kidney samples, three different isola-tions were performed on two kidney
tissue samples. Pairwise scatterplots and Pearson correlation again revealed high correspondence between probe set expression summaries obtained from the three independent extractions (Figure 1B).
Gene Expression Profiles among the Kidney Tissue Study Biopsies
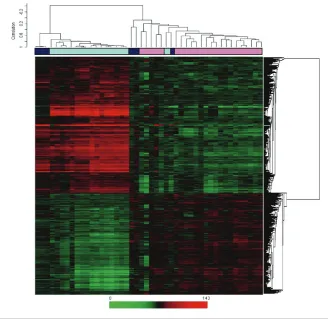
Relationships between the expression profiles of all kidney tissues were fur-ther explored by unsupervised hierar-chical clustering. The resulting dendro-gram showed two major branches (Figure 2). All but one of the kidney tis-sue samples with IF/TA clustered to-gether in one branch with high correla-tion. Similar behavior was shown for
the normal donor kidney tissues that clustered together in the second branch. The normal allograft kidney samples, however, clustered in closer association with normal kidney (n= 3) and in an in-dependent subbranch closer to the IF/TA group (n= 3). From this analysis, we observed a high homogeneity in the IF/TA kidney tissue group.
Identifying Trends in Gene Expression among Normal Kidneys, Normal Allografts, and IF/TA Samples
Probe set level tests of hypotheses tests were conducted to identify genes with a significant trend (increase or decrease) in gene expression across the three groups using Jonckheere-Terpstra test for trend. Using the Bonferroni adjustment for mul-tiple hypothesis testing, 1794 probe sets were identified as having a significant trend across the three groups (Supple-mental Table 1). Probe sets are listed in as-cending order by Pvalue, so those at the top of the list have the smallest P val-ues. Included in the list is the gene anno-tation information as well as the median by each group (normal kidney, normal al-lograft, IF/TA) and the Spearman rank correlation (trend). Of the 1794 significant probe sets, 764 have a negative trend while 1030 have a positive trend. Figure 3 shows two-dimensional hierarchical clus-tering results for the differentially ex-pressed genes among kidney samples.
We evaluated the more important pathways where the significant probe sets were classified. Specifically, a posi-tive trend in gene expression levels was
observed with expression levels increas-ing normal kidney > normal allograft > IF/TA for apoptosis. The more important differentially expressed genes associated
with apoptosis included TNFRSF7(5.2, 5.6, 7.2; Spearman rank correlation trend 0.83), TNFAIP8(6.4, 7.9, 8.4; trend 0.81),
FAS(6.9, 7.8, 8.2; trend 0.77), FASL6(4.2, Figure 2.Unsupervised hierarchical clustering analysis including all the study kidney sample tissues. The dendrogram shows that the IF/TA tissue samples clustered with high correlation (black boxes, IF/TA samples).
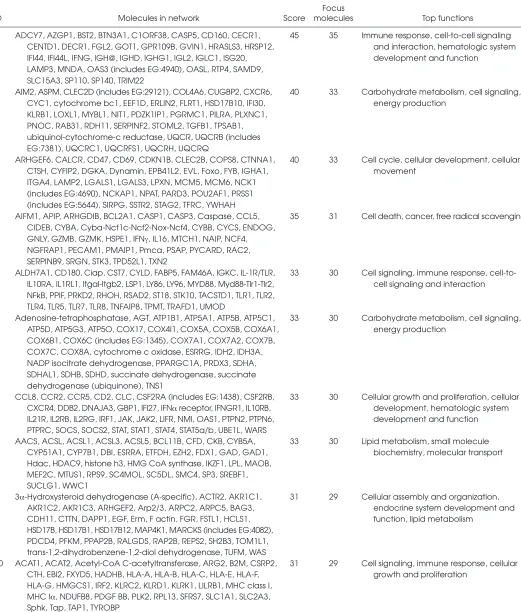
Table 3.Biological networks ranked by score in kidney tissues from patients with IF/TA.
Focus
ID Molecules in network Score molecules Top functions
1 ADCY7, AZGP1, BST2, BTN3A1, C1ORF38, CASP5, CD160, CECR1, 45 35 Immune response, cell-to-cell signaling CENTD1, DECR1, FGL2, GOT1, GPR109B, GVIN1, HRASLS3, HRSP12, and interaction, hematologic system IFI44, IFI44L, IFNG, IGH@, IGHD, IGHG1, IGL2, IGLC1, ISG20, development and function
LAMP3, MNDA, OAS3 (includes EG:4940), OASL, RTP4, SAMD9, SLC15A3, SP110, SP140, TRIM22
2 AIM2, ASPM, CLEC2D (includes EG:29121), COL4A6, CUGBP2, CXCR6, 40 33 Carbohydrate metabolism, cell signaling, CYC1, cytochrome bc1, EEF1D, ERLIN2, FLRT1, HSD17B10, IFI30, energy production
KLRB1, LOXL1, MYBL1, NIT1, PDZK1IP1, PGRMC1, PILRA, PLXNC1, PNOC, RAB31, RDH11, SERPINF2, STOML2, TGFB1, TPSAB1, ubiquinol-cytochrome-c reductase, UQCR, UQCRB (includes EG:7381), UQCRC1, UQCRFS1, UQCRH, UQCRQ
3 ARHGEF6, CALCR, CD47, CD69, CDKN1B, CLEC2B, COPS8, CTNNA1, 40 33 Cell cycle, cellular development, cellular CTSH, CYFIP2, DGKA, Dynamin, EPB41L2, EVL, Foxo, FYB, IGHA1, movement
ITGA4, LAMP2, LGALS1, LGALS3, LPXN, MCM5, MCM6, NCK1 (includes EG:4690), NCKAP1, NPAT, PARD3, POU2AF1, PRSS1 (includes EG:5644), SIRPG, SSTR2, STAG2, TFRC, YWHAH
4 AIFM1, APIP, ARHGDIB, BCL2A1, CASP1, CASP3, Caspase, CCL5, 35 31 Cell death, cancer, free radical scavenging CIDEB, CYBA, Cyba-Ncf1c-Ncf2-Nox-Ncf4, CYBB, CYCS, ENDOG,
GNLY, GZMB, GZMK, HSPE1, IFNγ, IL16, MTCH1, NAIP, NCF4, NGFRAP1, PECAM1, PMAIP1, Pmca, PSAP, PYCARD, RAC2, SERPINB9, SRGN, STK3, TPD52L1, TXN2
5 ALDH7A1, CD180, Ciap, CST7, CYLD, FABP5, FAM46A, IGKC, IL-1R/TLR, 33 30 Cell signaling, immune response, cell-to-IL10RA, IL1RL1, Itgal-Itgb2, LSP1, LY86, LY96, MYD88, Myd88-Tlr1-Tlr2, cell signaling and interaction NFkB, PPIF, PRKD2, RHOH, RSAD2, ST18, STK10, TACSTD1, TLR1, TLR2,
TLR4, TLR5, TLR7, TLR8, TNFAIP8, TPMT, TRAFD1, UMOD
6 Adenosine-tetraphosphatase, AGT, ATP1B1, ATP5A1, ATP5B, ATP5C1, 33 30 Carbohydrate metabolism, cell signaling, ATP5D, ATP5G3, ATP5O, COX17, COX4I1, COX5A, COX5B, COX6A1, energy production
COX6B1, COX6C (includes EG:1345), COX7A1, COX7A2, COX7B, COX7C, COX8A, cytochrome c oxidase, ESRRG, IDH2, IDH3A, NADP isocitrate dehydrogenase, PPARGC1A, PRDX3, SDHA, SDHAL1, SDHB, SDHD, succinate dehydrogenase, succinate dehydrogenase (ubiquinone), TNS1
7 CCL8, CCR2, CCR5, CD2, CLC, CSF2RA (includes EG:1438), CSF2RB, 33 30 Cellular growth and proliferation, cellular CXCR4, DDB2, DNAJA3, GBP1, IFI27, IFNαreceptor, IFNGR1, IL10RB, development, hematologic system IL21R, IL2RB, IL2RG, IRF1, JAK, JAK2, LIFR, NMI, OAS1, PTPN2, PTPN6, development and function PTPRC, SOCS, SOCS2, STAT, STAT1, STAT4, STAT5a/b, UBE1L, WARS
8 AACS, ACSL, ACSL1, ACSL3, ACSL5, BCL11B, CFD, CKB, CYB5A, 33 30 Lipid metabolism, small molecule CYP51A1, CYP7B1, DBI, ESRRA, ETFDH, EZH2, FDX1, GAD, GAD1, biochemistry, molecular transport Hdac, HDAC9, histone h3, HMG CoA synthase, IKZF1, LPL, MAOB,
MEF2C, MTUS1, RPS9, SC4MOL, SC5DL, SMC4, SP3, SREBF1, SUCLG1, WWC1
9 3α-Hydroxysteroid dehydrogenase (A-specific), ACTR2, AKR1C1, 31 29 Cellular assembly and organization, AKR1C2, AKR1C3, ARHGEF2, Arp2/3, ARPC2, ARPC5, BAG3, endocrine system development and CDH11, CTTN, DAPP1, EGF, Erm, F actin, FGR, FSTL1, HCLS1, function, lipid metabolism
HSD17B, HSD17B1, HSD17B12, MAP4K1, MARCKS (includes EG:4082), PDCD4, PFKM, PPAP2B, RALGDS, RAP2B, REPS2, SH2B3, TOM1L1, trans-1,2-dihydrobenzene-1,2-diol dehydrogenase, TUFM, WAS
10 ACAT1, ACAT2, Acetyl-CoA C-acetyltransferase, ARG2, B2M, CSRP2, 31 29 Cell signaling, immune response, cellular CTH, EBI2, FXYD5, HADHB, HLA-A, HLA-B, HLA-C, HLA-E, HLA-F, growth and proliferation
4.4, 4.6; trend 0.75), CASP5(4.9, 5.1, 5.2; trend 0.73), CASP1(4.5, 5.6, 7.3; trend 0.85), and CASP3(5.4, 6.4, 6.7; trend = 0.8). Genes involved in homing and chemotaxis also showed a positive trend with increasing expression levels in IF/TA samples (for example, CD44(5.5, 6.6, 8.1; trend 0.83), CCL5(4.3, 6.9, 8.7; trend 0.86), CCL4(5.4, 7.4, 8.2; trend 0.85), among others).
Interestingly, a negative trend of gene expression was observed for genes re-lated to angiogenesis, with gene expres-sion levels decreasing normal kidney < normal allograft < IF/TA across the three groups, for example, ANG(7.9, 6.9, 4.6; trend -0.82), ANGPTL3(7.9, 6.3, 4.6, trend -0.72), and EGF(8.2, 5.6, 4.7; trend -0.84).
From the analysis of the cell types pres-ent in the IF/TA tissues, activation of the
humoral branch of the immunological re-sponse was observed (immunoglobulins were clearly overexpressed in IF/TA tis-sues, including IGHG3, IGHA1, IGHM, among others). However, genes related to both cell types (B and T) were involved in IF/TA profiles, and a predominantly im-munologic pattern and/or response was not clearly identified (for example, CD4,
As previously published (14), genes related to matrix production and depo-sition (for example, LAMA4, COL1A2,
MMP9) were overexpressed in samples with IF/TA compared with normal kid-neys and normal allografts. However, TGF-β1 was overexpressed in IF/TA samples compared with normal kid-neys, but not compared with normal allografts.
Functional Analysis of the Differential Gene Expression between Normal Kidneys, Normal Allografts, and IF/TA
The 1794 differentially expressed probe sets were overlaid onto a global molecular network developed from information contained in the IPKB. Net-works of these genes were then algorith-mically generated based on their
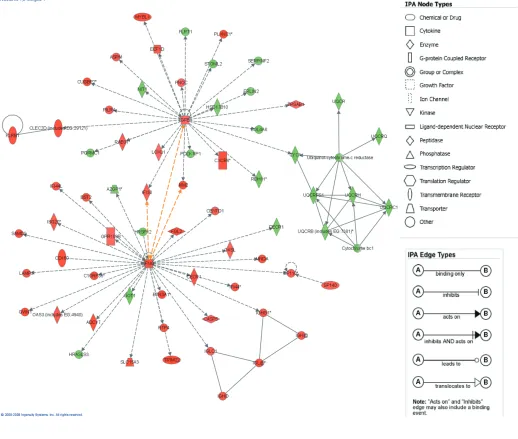
connec-tivity, or interactions between one an-other. Biological networks were ranked (Table 3), where the score corresponds to the likelihood of a set of genes being found in the networks due to chance; i.e., a score of 3 indicates that there is a 1/1000 chance that the focus genes are in a network due to chance. Therefore, scores of 3 or higher have a 99.9% confi-dence of not being generated by chance alone. This score was used as the cutoff for identifying gene networks signifi-cantly affected in IF/TA samples. Inter-connections of significant functional net-works were generated, principally for two of the most significant functional networks (Figure 4). These networks in-cluded molecules involved in the im-mune response and cell-to-cell signaling and interaction, showing the important
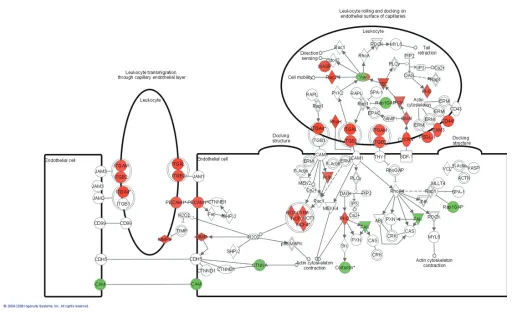
role that chronic inflammation and chronic inflammatory cell infiltrates might play in IF/TA progression. More-over, from the analysis of the canonical pathways, we observed that antigen presentation pathway, leukocyte extrava-sation signaling, and natural killer cell signaling were among the more impor-tant. Figure 5 shows the molecules that were found to be differentially expressed in the IF/TA samples in the leukocyte extravasation signaling pathway.
Validation of Microarray Studies Expression levels of TGF-β, EGFR, and
TSP-1were further confirmed using a quantitative real time RT-PCR. The results from the microarray were reproduced by real time RT-PCR (r= 0.85, P< 0.001;
DISCUSSION
Progressive graft deterioration with IF/TA remains an important problem in renal transplantation because its patho-genesis is still not understood and thus treatment is not available. IF/TA might be the end result of a series of time-depen-dent injuries to the allograft resulting in permanent damage and loss of nephrons. Destroyed nephrons cannot be replaced, leading to accumulation of damage in a progressive and cumulative manner, as confirmed in prospective protocol biopsy studies (19,20). The damage occurring to the transplanted kidney might be the re-sult of a combination of pre-existing donor disease and subsequent insults to the transplant leading to cumulative in-jury. Specific histological lesions that de-fine the etiology have increasingly been identified. These include arteriolar hyali-nosis, which is the hallmark of CNI (cal-cineurin inhibitors) toxicity; cellular inter-stitial infiltration found with subclinical rejection; specific electron-microscopy or immunofluorescence findings found with recurrent glomerulonephritis; and tubular cell inclusions suggestive of viral infec-tion. Currently, data from large-scale pro-spective studies suggest that initial im-mune injury occurs within the first 12 months, often presenting as subclinical re-jection, which can progress to chronic im-mune injury. A second level of injury oc-curring after 12 months is associated with arteriolar hyalinosis, ischemic glomeru-losclerosis, and secondary fibrosis, which is predominantly due to CNI toxicity (1,2). At the molecular level, there is in-creasing identification of chemokine, growth factor, and cytokine impact on tubulointerstitial damage (21-23). Other pathways include cellular senescence, ep-ithelial-to-mesenchymal tubular cell tran-sition, cytokine excess, and structural damage with loss of tubules leading to the formation of atubular glomeruli (24). To find appropriate therapeutic strategies, more detailed insights into the molecular pathogenesis are essential.
Analysis of gene-expression patterns will provide a window on the biology and pathogenesis of IF/TA. Despite the
high number of published references on single gene analysis and chronic allograft injury (25-31), mechanisms and predic-tors of progressive alloimmune scarring remain unclear.
Because differential degradation of RNA could lead to misleading conclu-sions, verification of RNA quality is an important aspect of any microarray ex-periment. In this study, we used pre-established quality control criteria for evaluating sample quality at every reac-tion step (RNA isolareac-tion, cDNA synthesis, IVT reaction, and hybridization). In addi-tion, we were able to obtain sufficient RNA concentration for running the mi-croarrays without the necessity of an am-plification method. These methods of quality control greatly strengthen the data and conclusions found in this study.
A distinctive gene expression pattern was observed in IF/TA samples, com-pared with normal allografts and normal kidneys. It was clearly demonstrated in an unsupervised cluster analysis in which all but one IF/TA kidney biopsy clus-tered together with high correlation. However, we did not observe associa-tions between specific histopathologic features of progressive graft deterioration with IF/TA and gene expression profiles.
Using Jonckheere-Terpstra test for trend analysis, we were able to establish a trend in gene expression for genes in-volved in different pathways among the studied groups. A biopsy of a chronically failing kidney transplant usually shows nonspecific or end-stage changes, so the relative contributions of pre-existing disease in the allograft and immunologic and nonimmunologic factors become dif-ficult to distinguish. A major impediment has been the lack of prospective, longitu-dinal histologic data from studies of hu-mans with chronic graft dysfunction. Thus, we evaluated how the gene expres-sion changed from normal donor kid-neys, normal allografts, and IF/TA sam-ples. We understand the limitation related to interindividual variation, but this study design provides an initial step for the analysis of the more important pathways leading to progressive graft
deterioration with IF/TA. Also, this study described the gene expression sig-nature at the specific study point related with the patient condition (normal kid-ney, normal allograft, IF/TA). The biopsy time was different between groups (nor-mal allograft versus IF/TA), but we in-cluded as a normal allograft group kid-ney transplantation patients with >9 months posttransplantation, normal kid-ney function, and nonhistological evi-dence of IF/TA. It has been reported that in protocol biopsies performed during the first 6 months after kidney transplan-tation, 25% to 50% of patients already display variable histological evidence of chronic allograft nephropathy (19,20).
Activation of the humoral branch of the immunological response was ob-served. However, as we reported re-cently (14,32), genes related to both cell types (B and T) were involved in IF/TA sample profiles, and a predominantly immunologic pattern and/or response was not clearly identified. Moreover, when samples for different groups were compared for identifying specific cell types and/or immunological branch predominance, a positive trend leading to IF/TA was also observed, reaffirming our initial results.
progression and deserves further evalua-tion and study. Finally, as was previ-ously demonstrated, matrix production and deposition gene expression were in-creased in kidneys with IF/TA.
Interaction networks and functional analysis were used for evaluating the dif-ferent pathways involved in the progres-sion to IF/TA. This approach revealed highly connected coexpression networks with significant gene-gene associations in relation to kidney tissue status (normal kidney, normal allograft, IF/TA). The 10 networks with the highest complexity score (see “Methods”) were identified as potentially important in the multifactor-ial pathology of IF/TA, as shown in Table 3. Moreover, almost all the top-scored networks were related to immune response, inflammation, and cell-to-cell interaction, showing the importance of the chronic inflammation and chronic cell infiltrates in IF/TA progression.
Prospective studies including protocol biopsies (pre-implantation and follow-up during the first 12 months posttransplan-tation) are needed for establishing poten-tial biomarkers as predictors of IF/TA.
ACKNOWLEDGMENTS
This study has been supported by a grant from ROCHE Laboratories Investi-gator Initiated Research Program.
DISCLOSURE
The authors of this manuscript do not have any conflict of interest.
REFERENCES
1. Hariharan S, et al.(2000) Improved graft survival after renal transplantation in the United States, 1988 to 1996. N. Engl. J. Med.342:605-12. 2. Meier-Kriesche HU, et al.(2004) Lack of
improve-ment in renal allograft survival despite a marked decrease in acute rejection rates over the most re-cent era. Am. J. Transplant.4:378-83.
3. Solez K, et al.(2007) Banff ‘05 Meeting Report: differential diagnosis of chronic allograft injury and elimination of chronic allograft nephropathy (‘CAN’). Am. J. Transplant.7:518-26.
4. Halloran PF, et al.(2004) Assessing long-term nephron loss: is it time to kick the CAN grading system? Am. J. Transplant. 11:1729-30.
5. Nankivell BJ, Chapman JR. (2006) Chronic allo-graft nephropathy: current concepts and future directions. Transplantation 81:643-54.
6. Nankivell BJ, et al.(2004) Natural history, risk factors, and impact of subclinical rejection in kid-ney transplantation. Transplantation78:242-9. 7. Mas V, et al.(2002) Intragraft messenger RNA
expression of angiotensinogen: relationship with transforming growth factor beta-1 and chronic allograft nephropathy in kidney transplant pa-tients. Transplantation4:718-21.
8. Szeto CC, et al.(2005) Messenger RNA expres-sion of target genes in the urinary sediment of patients with chronic kidney diseases. Nephrol. Dial. Transplant.20:105-13.
9. Nicholson ML, Waller JR, Bicknell GR. (2002) Renal transplant fibrosis correlates with intra-graft expression of tissue inhibitor of metallopro-teinase messenger RNA. Br. J. Surg.89:933-7. 10. Mansfield ES, Sarwal MM. (2004) Arraying the
orchestration of allograft pathology. Am. J. Trans-plant.4:853-62.
11. Racusen LC, et al.(1999) The Banff 97 working classification of renal allograft pathology. Kidney. Int.55:713-23.
12. Irizarry RA, Bolstad BM, Collin F, Cope LCM, Hobbs B, Speed TP. (2003) Summaries of Affymetrix GeneChip probe level data. Nucleic Acids Res.31:e15.
13. Hubbell E, Liu W-M, Mei R. (2002) Robust esti-mators for expression analysis. Bioinformatics
18:1585-92.
14. Mas V, et al.(2007) Establishing the molecular pathways involved in chronic allograft nephropathy for testing new noninvasive diag-nostic markers. Transplantation83:448-57. 15. Gentleman R, et al.(2005) Bioinformatics and
Computational Biology Solutions Using R and Bioconductor. Springer: New York.
16. Gentelman R. (2004) Using GO for statistical analysis. In: Antioch R (ed.) COMPSTAT: Pro-ceedings in Computational Statistics. Physica-Verlag/Springer: Heidelberg, p. 171.
17. Ali S, et al.(2005) Renal transplantation: exami-nation of the regulation of chemokine binding during acute rejection. Transplantation79:672-9. 18. Livak KJ, Schmittgen TD. (2001) Analysis of
rela-tive gene expression data using real-time quanti-tative PCR the 2(-Delta Delta C (T)) Method. Methods25:402-8.
19. Solez K, Vincenti F, Filo RS. (1998) Histopatho-logic findings from 2-year protocol biopsies from a U.S. multicenter kidney transplant trial com-paring tacrolimus versus cyclosporine: a report of the FK506 Kidney Transplant Study Group.
Transplantation66:1736-40.
20. Nankivell BJ, et al.(2003) The natural history of chronic allograft nephropathy. N. Engl. J. Med.
349:2326-33.
21. Mas V, et al.(2000) Intragraft expression of trans-forming growth factor-beta 1 by a novel quanti-tative reverse transcription polymerase chain reaction ELISA in long lasting kidney recipients.
Transplantation70:612-6.
22. Szeto CC, et al.(2006) mRNA expression of target genes in the urinary sediment as a noninvasive
prognostic indicator of CKD. Am. J. Kidney Dis.
47:578-86.
23. Bicknell GR, et al.(2000) Differential effects of cyclosporin and tacrolimus on the expression of fibrosis-associated genes in isolated glomeruli from renal transplants. Br. J. Surg.87:1569-89. 24. Chapman JR. (2005) Longitudinal analysis of
chronic allograft nephropathy: clinicopathologic correlations. Kidney Int. Suppl. 99:S108. 25. Pribylova-Hribova P, et al.(2006) TGF-beta1 mRNA
upregulation influences chronic renal allograft dysfunction. Kidney Int.69:1872-9.
26. Muthukumar T, et al. (2005) Messenger RNA for FOXP3 in the urine of renal-allograft recipients.
N. Engl. J. Med. 353:2342-51.
27. Eikmans M, et al.(2005) Expression of surfactant protein-C, S100A8, S100A9, and B cell markers in renal allografts: investigation of the prognostic value. J. Am. Soc. Nephrol.16:3771-86. 28. Djamali A, et al.(2005) Heat shock protein 27 in
chronic allograft nephropathy: a local stress re-sponse. Transplantation79:1645-57.
29. Koop K, et al.(2004) Differentiation between chronic rejection and chronic cyclosporine toxic-ity by analysis of renal cortical mRNA. Kidney Int.66:2038-46.
30. Eikmans M, et al.(2003) Renal mRNA levels as prognostic tools in kidney diseases. J. Am. Soc. Nephrol. 14:899-907.
31. Yehia M, et al.(2006) Predictors of chronic allo-graft nephropathy from protocol biopsies using histological and immunohistochemical tech-niques. Nephrology (Carlton) 11:261-6. 32. Hotchkiss H, et al.(2006) Differential expression
of profibrotic and growth factors in chronic allo-graft nephropathy. Transplantation81:342-9. 33. Polverini PJ. (1997) Role of the macrophage in
angiogenesis-dependent diseases. EXS79:11-28. 34. Libby P, Zhao DX. (2003) Allograft
arteriosclero-sis and immune-driven angiogenearteriosclero-sis. Circulation
107:1237-9.
35. Libby P, Pober JS. (2001) Chronic rejection. Immu-nity14:387-97.
36. Reinders ME, Briscoe DM. (2002) Angiogenesis and allograft rejection. Graft5:96-8.
37. Leibovich SJ, et al.(1987) Macrophage-induced angiogenesis is mediated by tumor necrosis factor-alpha. Nature329:630-2.
38. Leibovich SJ, Wiseman DM. (1988) Macrophages, wound repair and angiogenesis. Prog. Clin. Biol. Res.266:131-45.
39. Kang DH, et al.(2002) Role of the microvascular endothelium in progressive renal disease. J. Am. Soc. Nephrol. 13:806-16.
40. Kang DH, et al.(2001) Impaired angiogenesis in the aging kidney: vascular endothelial growth factor and thrombospondin-1 in renal disease.
Am. J. Kidney Dis.37:601-11.
41. Masuda Y, et al.(2001) Vascular endothelial growth factor enhances glomerular capillary repair and ac-celerates resolution of experimentally induced glomerulonephritis. Am. J. Pathol.159:599-608. 42. Iruela-Arispe L, et al.(1995) Participation of