Open Access
Research
pkaPS: prediction of protein kinase A phosphorylation sites with the
simplified kinase-substrate binding model
Georg Neuberger, Georg Schneider and Frank Eisenhaber*
Address: IMP – Research Institute of Molecular Pathology, Dr. Bohr-Gasse 7, A-1030 Vienna, Austria
Email: Georg Neuberger - [email protected]; Georg Schneider - [email protected]; Frank Eisenhaber* - [email protected]
* Corresponding author
Abstract
Background: Protein kinase A (cAMP-dependent kinase, PKA) is a serine/threonine kinase, for which ca. 150 substrate proteins are known. Based on a refinement of the recognition motif using the available experimental data, we wished to apply the simplified substrate protein binding model for accurate prediction of PKA phosphorylation sites, an approach that was previously successful for the prediction of lipid posttranslational modifications and of the PTS1 peroxisomal translocation signal.
Results: Approximately 20 sequence positions flanking the phosphorylated residue on both sides have been found to be restricted in their sequence variability (region -18...+23 with the site at position 0). The conserved physical pattern can be rationalized in terms of a qualitative binding model with the catalytic cleft of the protein kinase A. Positions -6...+4 surrounding the phosphorylation site are influenced by direct interaction with the kinase in a varying degree. This sequence stretch is embedded in an intrinsically disordered region composed preferentially of hydrophilic residues with flexible backbone and small side chain. This knowledge has been incorporated into a simplified analytical model of productive binding of substrate proteins with PKA.
Conclusion: The scoring function of the pkaPS predictor can confidently discriminate PKA phosphorylation sites from serines/threonines with non-permissive sequence environments (sensitivity of ~96% at a specificity of ~94%). The tool "pkaPS" has been applied on the whole human proteome. Among new predicted PKA targets, there are entirely uncharacterized protein groups as well as apparently well-known families such as those of the ribosomal proteins L21e, L22 and L6.
Availability: The supplementary data as well as the prediction tool as WWW server are available at http://mendel.imp.univie.ac.at/sat/pkaPS.
Reviewers: Erik van Nimwegen (Biozentrum, University of Basel, Switzerland), Sandor Pongor (International Centre for Genetic Engineering and Biotechnology, Trieste, Italy), Igor Zhulin (University of Tennessee, Oak Ridge National Laboratory, USA).
Published: 12 January 2007
Biology Direct 2007, 2:1 doi:10.1186/1745-6150-2-1
Received: 09 January 2007 Accepted: 12 January 2007
This article is available from: http://www.biology-direct.com/content/2/1/1
© 2007 Neuberger et al; licensee BioMed Central Ltd.
Open peer review
This article was reviewed by Erik van Nimwegen (Biozen-trum, University of Basel, Switzerland), Sandor Pongor (International Centre for Genetic Engineering and Bio-technology, Trieste, Italy) and Igor Zhulin (University of Tennessee, Oak Ridge National Laboratory, USA). For the full reviews, please go to the Reviewers' comments sec-tion.
Background
Phosphorylation is one of the biologically most impor-tant post-translational modifications known today. Eukaryote kinases, which are the enzymes that are respon-sible for this type of chemical alteration, transfer phos-phate moieties onto the hydroxyl groups of serines, threonines or tyrosines of substrate peptides. Phosphor-ylation plays a key role in a large set of signal transduction pathways and is known to regulate the functions of a vast number of different proteins. Not only are substrate motifs for phosphorylation found in proteins from vari-ous cellular contexts, there are also >500 kinases [1] with at least partly non-overlapping substrate specificities encoded in each of the higher eukaryote genomes. This broad distribution, coupled with the potential medical applications, makes them interesting research targets with regard to their role in signaling cascades. Therefore, it is important to determine the complete protein substrate set for each kinase. The sheer number of yet uncharacterized proteins implies that a lot of phosphorylation motifs
remained undetected so far. Accurate in silico predictors
recognizing kinase substrates from their amino acid sequences are desirable to bring this task closer to a solu-tion. A low false-positive prediction rate is especially important in this context.
Protein kinase A (PKA), alternatively called cAMP-dependent protein kinase, is one of the best studied mem-bers of the kinase group of enzymes and, therefore, appears among the most attractive targets for substrate site predictor development. It is actually the first kinase for which the crystal structure has been resolved [2,3]. PKA acts on serine and, to a lesser extent, threonine residues that are embedded in a specific recognition motif. In its first characterizations, the PKA motif was described as consisting of arginines at the 3rd and 2nd positions prior to the phosphorylation site, and of a large hydrophobic amino acid immediately thereafter [4-7].
Several groups already applied various approaches for pre-dicting PKA phosphorylation sites from primary protein sequence. NETPHOS [8] was one of the first to outper-form simpler PROSITE-like approaches [9-11] by apply-ing artificial neural networks. A more recent version, NETPHOSK [12], makes kinase-specific predictions. SCANSITE 2.0 uses position-specific scoring matrices
(PSSM) to predict phosphorylation motifs for 62 different kinases, again including PKA [13]. PREDPHOSPHO is a kinase-specific predictor that uses support vector machines [14]. GPS does not use standard machine learn-ing approaches but implements a so-called group-based scoring technique, which makes use of the BLOSUM62 matrix to score distances between query sequences and known clusters of kinase substrate peptides [15,16]. As GPS focuses on straight sequence similarity traits, the like-lihood for GPS to recognize query peptides as phosphor-ylation targets that are similar to known sites is especially high whereas GPS might have difficulties if it is con-fronted with unusual substrate examples of the same kinase that are not reflected in the learning set. Among these tools, GPS [15,16] and PREDPHOSPHO [14] appear to have highest accuracy. Although the sequence sets used for testing are limited, their sensitivities are clearly below 90% for specificities estimated to be close to 90%. As more than 10% of the query sites are expected to be misclassified, database-wide studies that rely solely on current predictors cannot produce reliable results.
In order to achieve higher sensitivity and specificity, major improvements are needed. In this work, we implemented two new aspects: (i) Since there is no "average phosphor-ylation site", high prediction accuracy can only be achieved if the function for scoring of putative phosphor-ylation sites is specific for each kinase system. In our approach, the scoring function is thought to estimate the probability of productive binding of the respective sub-strate protein segment with the binding site of PKA; thus, the scoring function is a simplified physical model of the binding process [17-22]. (ii) The motif regions that are used to discriminate between true sites and non-permis-sive targets should be as long as possible. These shall include all substrate sequence stretches that influence the binding process and should not be restricted to the region of the motif that is most conserved in terms of amino acid types. It is also necessary to consider properties of corre-lated motif positions [23].
polypep-tide chain. In this work, we wanted to test the approach for an internal sequence signal.
PKA-dependent phosphorylation is an excellent example in this context since the rich experimental data allow for the derivation of a quite accurate qualitative binding site model as we show in this work. Not only are there more than 200 documented phosphorylation sites for PKA. The available sequence data is also accompanied by other val-uable heterogeneous information such as 3D data and mutation experiments [3,25].
Results
Overview
The whole work consist of two major parts – first, the der-ivation of the property pattern that characterizes sequence segments with PKA phosphorylation sites and, second, the development and the validation of a prediction tool for the recognition of PKA phosphorylation sites in query sequences.
The following four sections of the Results ("The motif length", "Positive charge in the N-terminal flank", "Polar-ity and flexibil"Polar-ity in the C-terminal flank", "Phylogenetic variation of the substrate binding site of PKA") are dedi-cated to the derivation of the sequence motif coding for PKA phosphorylation sites. This work is based on analyses of the sequence environment of known phosphorylation sites in substrate proteins and of the PKA sequences and structures. We correlate amino acid compositions at vari-ous alignment positions with physical properties of amino acid residues. As major results, we obtain the sequence length of the motif and the pattern of physical properties in various sequence segments surrounding the phosphorylation site. Moreover, if several phosphoryla-tion sites occur in one protein, they tend to be sequen-tially clustered.
The next three sections ("Predictor description and the self-consistency test", "Neighbor-jackknife test", "Sum-mary of the prediction performance and comparison to other tools") describe the development of the prediction tool and its validation with the self-consistency test and a rigorous cross-validation procedure called neighbor-jack-knife test (exclusion of groups of sequentially similar pro-teins). The specificity and the sensitivity values are close to 95% and, thus, superior compared with previously pub-lished predictors.
The succeding section of the Results ("Prediction of PKA targets within the human proteome") describes the appli-cation of the predictor to the human proteome. Among new predicted PKA targets, there are entirely uncharacter-ized protein groups as well as apparently well-known fam-ilies such as those of the ribosomal proteins L21e, L22 and
L6. The last section of the Results ("Description of the associated WWW site") supplies information about the PKA WWW server.
The motif length
The deduction of accurate motif boundaries is not straightforward, as this region also comprises positions that make only minor contributions to substrate recogni-tion by PKA. For example, these include residues that interact only weakly with the receptor or which are con-text-dependent upon neighboring positions. As a conse-quence, it is helpful to base such estimations on a standard model which has already been successfully applied in related situations.
The concept of a linker-embedded binding motif is utterly suited for this task. The underlying assumption is that the peptide stretch which binds to the receptor enzyme and which is buried in the catalytic cleft must first be made accessible for interaction: as part of an intrinsically disor-dered region, through a permanent native location on the surface of the globular part of the substrate protein or via exposure after an induced conformational change. As a consequence, the flanking regions which connect the sequence segment that fits into the catalytic cavity and the rest of the substrate protein must have sufficient confor-mational flexibility and hydrophilicity. Such a motif structure has already been observed and successfully applied in predictor development [21-24,26]. Recent work by Dunker and co-workers further confirms the applicability of this model to protein phosphorylation motifs as they find evidence for inherently disordered regions surrounding phosphorylated residues. They used a similar formulation of the concept for "disorder enhanced" prediction of phosphorylation sites [27].
Mean values of amino acid property indices [23,28] (including many flexibility and hydrophobicity scales) were calculated over a gapless multiple alignment of learning set sequences which consists of the modified sites in the center together with 40 flanking residues on each side. Sequence redundancy was removed by applying a method which involves frequencies of identical residues on alignment positions -6 to +6 (Materials and Methods). Exemplarily, we show the outcomes obtained for the hydrophobicity scale EISD840101 [29] and for VINM940104 [30] as flexibility measure in Figure 1.
properties (data not shown). It appears also interesting that this region is slightly longer on the C-terminal side than on the N-terminal one. This might be a result of the more hydrophobic nature of the residues that lie adjacent to the phosphorylated site on the C-terminal side. As depicted in Figure 1, the motif boundaries cannot be boiled down unambiguously to a unique position. We set the edges well into the regions where the property mean values do not fall below the steady level of approximately ± 20%. The resulting region is defined from positions -18 to +23 and, thus, we estimate the total length of the sequence signal for PKA-dependent phosphorylation as 42 positions.
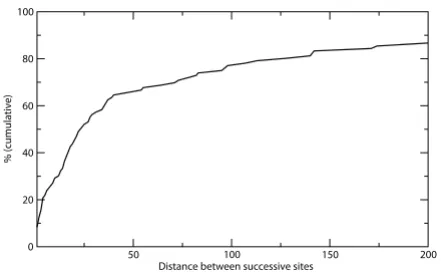
The significance of multiple phosphorylated residues within the same motif region is an important issue that needs to be addressed (see also legend to Figure 1). We find that pairs of phosphorylated serines/threonines are not separated farther than the 50 residues in the sequence in two thirds of all cases (Figure 2). This threshold is just about the motif length derived above. Theoretically, every proximal neighboring site would prolong one of the link-ers by at least the distance between the sites. From a
bio-logical point of view, it appears reasonable to pack multiple phosphorylation sites closely together. In such a situation, long additional linker stretches that would be necessary for maintaining an inherent structural disorder in the environment of phosphorylation sites [27] are avoided.
Positive charge in the N-terminal flank
Historically, charge requirements were the first observed characteristics of the PKA motif. Kinetic studies at the end of the 1970s revealed a cluster of positive residues directly N-terminally of the phosphorylated site as main determi-nant for PKA substrate specificity. The main constituents of this cluster are the 2nd and 3rd positions prior to the
phosphorylated serine or threonine. Kemp et al. [5]
postu-lated that at least one arginine should be present at one of these locations. Moreover, replacement of the arginine by lysine was reported to cause less activity loss than substi-tutions by other amino acids. In another study [31], the adjacent arginines were positioned at various distances from the phosphorylated site and activity measurements were performed. The results demonstrated that the bind-Variation of hydrophobicity and of flexibility over the motif region
Figure 1
Variation of hydrophobicity and of flexibility over the motif region. The graph depicts the mean value deviations of the hydrophobicity-related property EISD840101 [29] and the flexibility scale VINM940104 [30] over the 81 positions that encompass the learning set sites. The mean values are presented as deviations from the UNIREF average (baseline) in percent of UNIREF standard deviations. The plots were smoothed by applying sliding windows (running averages) over 5 residues. Mean values were calculated using two different sequence sets: (i) one that contains all entries from the learning set, and (ii) one that consists of all proteins that are phosphorylated only once in the learning set. The difference between these two curves is not dramatic although, as a trend, the property values appear to fall back more sharply to the database values if only proteins with single PKA phosphorylation sites are taken into account.
-40 -20 0 20 40
Position -100
-50 0 50
% deviation from UniRef VINM940104 - all sitesVINM940104 - single sites
ing affinity is indeed highest at positions -3/-2 and decreases with increasing distance from the site.
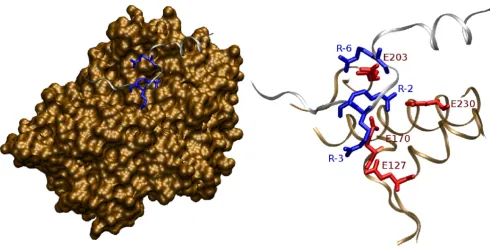
The requirement for positively charged residues is depicted in the 3D structure of PKA bound to an inhibitor peptide (Figure 3). The arginines at positions -3 and -2 interact with Glu127 and Glu170/Glu230 of the PKA enzyme, respectively [3]. Both substrate residues make close contacts with the enzyme in a spatially restricted binding pocket, explaining their importance in determin-ing substrate specificity. In this structure, the arginine at position -6 also contributes to substrate recognition by interacting with Glu203.
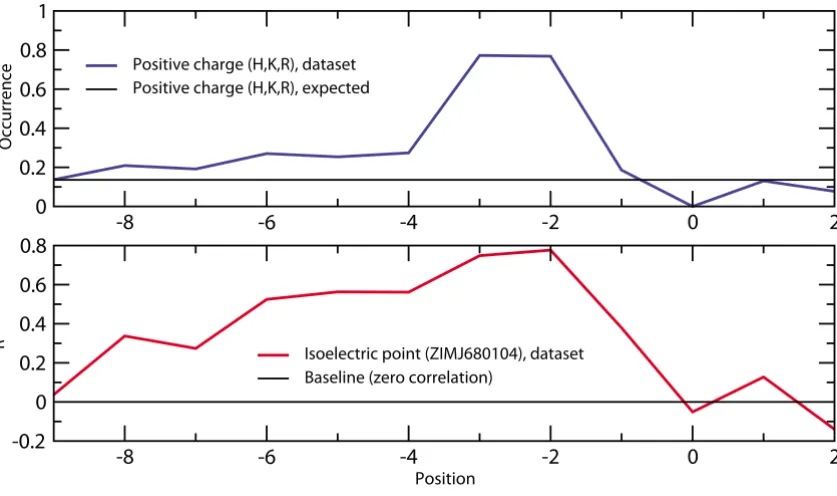
The requirement for positive charge is highest for residues -2 and -3 but can be detected as far as 6 to 8 residues prior to the phosphorylated serine (Figure 4). Several studies focus on the role of position -6 as this residue apparently interacts with the PKA enzyme [3,7]. In contrast, it is unclear how the amino acids at positions -5 and -4 con-tribute to substrate specificity. Although positive charge at these locations is as much favored as for position -6, nei-ther of them makes close contacts with PKA in any solved structure. The reason could lie in a variable structural con-text of this N-terminal region. The currently resolved sub-strate-bound 3D structures have typically been obtained using the same inhibitor peptide (PKI). Thus, other, yet unknown conformations might exist if the bound peptide does not involve a positively charged residue at position -6. Alternatively, long-range charge interactions might con-tribute to substrate specificity at these positions. The pref-erence for positive charge is further confirmed by
Songyang et al. [25], who used an oriented peptide library
to demonstrate that the positional range -4 to -1 has strong preferences for arginine and to, a lesser extent, for histidine or lysine.
Physico-chemical preferences in the region prior to the phosphorylation site are complemented with flexibility and polarity requirements, e.g. for the property
VINM940103 (normalized flexibility parameters [30], R ≥
0.62) at positions -8 to -6 and -4, or for the
hydrophilicity-related scales EISD840101 [29] (R ≥ -0.66 at position -3
and -0.69 at position -2) and KRIW790102 [32] (R = 0.60 at positions -7, -6 and -4). Although these might be a rem-nant of charge requirements, it seems clear that a substitu-tion of arginine by hydrophilic residues is less disfavored than an exchange by bulky, apolar amino acids.
Polarity and flexibility in the C-terminal flank
The residue at position +1 lies in vicinity of a hydrophobic pocket that is built up by the side chains of Leu198, Pro202 and Leu205 (Figure 5). As a consequence, a large hydrophobic residue was found to be favored at this sub-strate position [7]. A value of R = 0.78 for NAKH900109 (amino acid composition of membrane proteins [33]) confirms the detected tendency for hydrophobic, apolar residues. Also, analysis of mean value deviations from the expected database average indicates a preference for
amino acids that occur more frequently in β-strands.
Properties such as GEIM800105 (β-strand indices [34]) or
KANM800104 (average probability for inner β-sheet [35])
produce significant t-values of 2.71 (99.2%) and 2.59 (98.9%), respectively. These secondary structure scales typically have elevated property values for aliphatic and aromatic amino acids.
Interestingly, correlation effects can be detected between positions +1 and +4, as indicated by an F-value of 1.38
(96.6%) for the property GEIM800107 (β-strand indices
for β-proteins [34]). Few data about the role of residue +4
is available from the literature, as this position is missing in the currently resolved 3D structures. It has no clear amino acid preferences, although it is preferentially less polar than the clearly hydrophilic surrounding positions (data not shown). Its spatial location in vicinity of the hydrophobic patch (Figure 5) combined with the correla-tions with residue +1 could suggest that posicorrela-tions +1 and +4 both may interact with the apolar surface loop of PKA. However, alternative conformations which involve an apolar residue at position +3 also appear possible.
The intermediary positions +2 and +3 can be character-ized by a preference for small residues. Numerous sizerelated scales such as FASG760101 [36] (R of 0.62 and -0.63 for positions +2 and +3, respectively) produce signif-icant correlation coefficients. To some extent, position +3 Cumulative distribution of distances between successive sites
in learning set proteins with multiple phosphorylated serine/ threonine residues
Figure 2
Cumulative distribution of distances between succes-sive sites in learning set proteins with multiple phos-phorylated serine/threonine residues. The figure demonstrates that about two thirds of all distances are within the extended motif length of approximately 50 posi-tions. The maximum distance, which exceeds the displayed x-axis, is 1759 amino acids.
50 100 150 200
Distance between successive sites 0
20 40 60 80 100
also seems to favor flexible amino acids, as indicated by a correlation coefficient R of 0.65 for VINM940102 [30]. The respective substrate positions indeed lie in a spatially constrained region at the mouth of the binding cavity (Figure 5), which explains the appearance of size restric-tions.
Phylogenetic variation of the substrate binding site of PKA
When collecting the learning set substrate proteins, we found 50% human and 89% mammalian example sites. The remaining 11% were from other metazoan species, yeasts and plants (see Materials and Methods for detail). We wished to estimate to which extent substrates and enzymes from various organisms are exchangeable with respect to PKA-dependent phosphorylation. In Figure 6, we show the alignment of the sequences of the catalytic subunit of PKA in a large variety of organisms spreading from yeast to human. Positions that are critically impor-tant for binding the substrate protein stretch are marked with triangles. Not only are these positions 100% con-served among all sequences shown, but even their sequence environment is almost unchanged among taxa. Therefore, we suggest that substrates for the human PKA are most likely also substrates for PKA of other taxa and a
predictor for recognizing human substrates can also be used for finding PKA substrates in other eukaryote organ-isms.
Predictor description and the self-consistency test
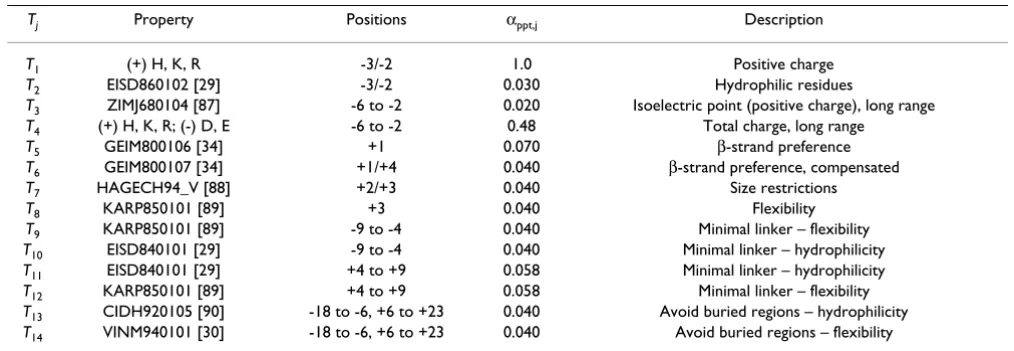
The motif structure that was presented in the preceding sections served as a basis for the generation of a prediction tool. The final version of the predictor, called "pkaPS", uses one profile over 13 sequence positions and 14 phys-ico-chemical property terms. In the self-consistency test,
the pkaPS predictor generates scores S ≥ 0 for 236 out of
239 (98.7%) positive examples from the learning set, and, thus, correctly predicts these sequences as potential sub-strates for PKA-dependent phosphorylation.
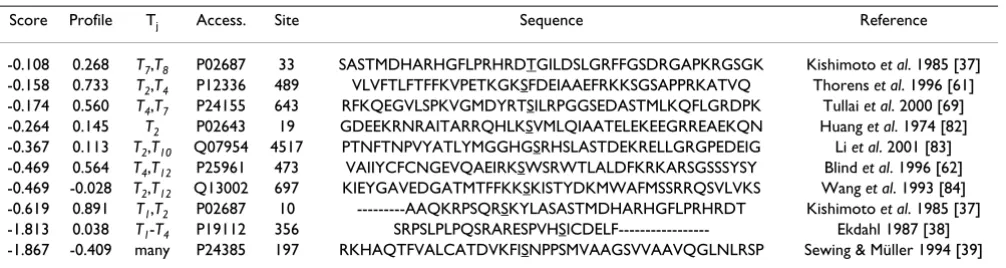
The three entries that are not predicted are summarized in Table 1. Although all of them produce profile scores Sprofile above zero, the three database sites (i) Ser10 from the rat brain myelin basic protein [37], (ii) Ser356 from the rat liver fructose-1,6-bisphosphatase [38] and (iii) Ser197 from human cyclin C1 [39] obviously differ from the con-sensus represented by the scoring function to a considera-ble extent. Among other unmet requirements, the charge pattern on the N-terminal side of the reported phosphor-Structure of the inhibitor peptide PKI bound to the PKA enzyme: N-terminal region of the substrate
Figure 3
ylation sites is deviant. Typically, positive charged resi-dues are observed and negative charges are absent. Actually, none of these sites harbors an arginine at either of the important positions -3 or -2. Therefore and given the current knowledge on substrate binding, it is difficult to imagine how these targets fit into the binding site of PKA. Since experimental protocols for determining phos-phorylation sites are non-trivial and the reports are of con-siderable age, an experimental re-examination these cases would be advisable.
The expected rate of false-positive predictions can directly be estimated using the set of 1026 negative examples. For a given serine or threonine residue of a query sequence, the probability of true-negative prediction lies at 93.5%
(Fp-rate of 6.5%). This set was used to generate an
empir-ical score distribution of negative examples. In order to obtain a value for the false-positive rate for any generated score S, an analytical approximation of this score distribu-tion was determined (Materials and Methods).
Neighbor-jackknife test
Thorough cross-validation tests are needed in order to assess whether the score function is stably parameterized
by the learning set. The pkaPS tool was subjected to a strict cross-validation test where the query sequence in addition to sequences which share more than 30% of identical amino acids with the query were excluded from the parameterization procedure (neighbor-jackknife test, Materials and Methods).
As summarized in Table 2, 10 out of the 239 (4.2%) sites from the learning set were not predicted by pkaPS. As expected, the entries that were not predicted in the self-consistency test were not recognized in the cross-valida-tion test either. In this test, two entries (Q13002, posicross-valida-tion 697 and P24385, position 197) had profile scores below zero. Therefore, we think that the learning set is still a little bit too small to stably determine the profile.
All of the seven entries that were predicted in the self-con-sistency test but not in the neighbor-jackknife test have only marginally negative scores between zero and -0.5. Only the three entries that had scores below zero in the self-consistency test also had an S < -0.5 in the neighbor-jackknife test (see Tables 1 and 2). We think that the score interval between 0.0 and -0.5 represents a twilight zone. Preference for positive charge at positions located N-terminally with regard to the phosphorylated site
Figure 4
Preference for positive charge at positions located N-terminally with regard to the phosphorylated site. The upper graph depicts the increased occurrence of positively charged residues (His, Lys, Arg) compared to the expected data-base occurrence of 13.6% (deduced from UNIREF). The lower part of the figure shows the correlation coefficients R between amino acid frequencies and ZIMJ680104 (isoelectric point) [87] property values. Both plots demonstrate that the preference for basic residues is highest at positions -3 and -2, but encompasses at least the entire region between amino acids -6 and -2.
-8
-6
-4
-2
0
2
0
0.2
0.4
0.6
0.8
1
Occurrence
Positive charge (H,K,R), dataset Positive charge (H,K,R), expected
-8
-6
-4
-2
0
2
Position
-0.2
0
0.2
0.4
0.6
0.8
R
Summary of the prediction performance and comparison to other tools
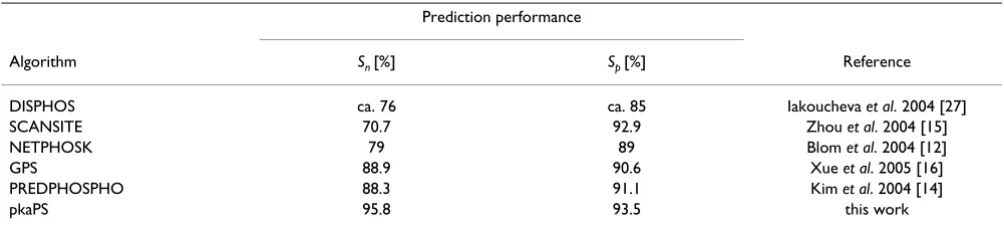
To conclude, the prediction performance of the pkaPS tool is considerable. Its sensitivity lies in the range of at least 95.8% as estimated from the neighbor jackknife test, and is as high as 98.7% in the self-consistency test. At the same time, a specificity of 93.5% could be achieved.
The pkaPS tool was compared to a set of currently availa-ble phosphorylation predictors (Taavaila-ble 3). Unfortunately, a comparison of these tools on the same test set was impossible due to the lack of publicly available untrained versions of the tools that could be used for cross-valida-tion tests. Hence, the comparisons were based on sensitiv-ity and specificsensitiv-ity values which were taken from the original papers. The performance values from older pub-lications do not straightforwardly compare with those in this work. In general, prediction methods can be expected to show decreased performance when tested on enlarged, more recent and diverse sequence sets. More importantly, the accuracy measured for a prediction tool is also influ-enced by the rigor of the cross-validation test. This type of test should determine how predictors perform on query
sequences that are dissimilar to the learning set examples. In our work, a strict method has been applied, the neigh-bor-jackknife test. In the leave-one-out procedure, we excluded not only the entry under consideration but also all sequentially similar examples.
As judged from the published predictor performance rat-ings, pkaPS provides a better specificity and sensitivity than all other currently available tools. Among these methods, only DISPHOS [27] is a predictor for "average phosphorylation" sites without considering kinase specif-icity. All other tools have implementations for specific kinases including PKA. The algorithms that come closest to the performance of pkaPS are PREDPHOSPHO, which uses a support vector machine based implementation [14], and GPS, which rests upon a group-based scoring method [15].
Prediction of PKA targets within the human proteome
In addition to thorough cross-validation tests, the per-formance of the pkaPS tool was studied by analyzing pre-dicted PKA-dependent phosphorylation sites in the human proteome. The human protein sequences were Structure of the inhibitor peptide PKI bound to the PKA enzyme: C-terminal region of the substrate
Figure 5
retrieved from the NCBI FTP-site (40877 sequences,
Sep-tember 14th 2006 at [40]). From a total of 2,485,866
ser-ines and threonser-ines, 258,271 (10.4%) were predicted as
putative phosphorylation sites with scores S > 0. In our
understanding, the list of predicted sites contains (a) true phosphorylation PKA sites, (b) sites that are phosphor-ylated in vitro by PKA but not in vivo due to the absence of biological context (see the comment on hidden signals in the discussion and in ref. [41]) and (c) real false-positive predictions of phosphorylated serines/threonines that are in sequence stretches without capability of productive interaction with the catalytic site of PKA. The considera-tion of addiconsidera-tional funcconsidera-tional sequence regions has a sig-nificant impact on the rate of predicted PKA-dependent phosphorylation sites. For example, there are 649979 ST-sites in 10195 proteins with predicted signal peptides (with any of the taxonomic versions of SIGNALP 3.0 [42]). pkaPS generates hits for 56970 sites (8.8%), a con-siderably lower value than that for the full proteome.
Proteins with many serines/threonines are likely to have multiple PKA-dependent phosphorylation site predic-tions. For the human proteome, we find that the more sites are predicted per proteins, the smaller the mean dis-tance between them (Figure 7). This confirms the trends
observed in Figure 2 that proteins with many phosphor-ylation sites tend to pack these closely together into uni-fied serine/threonine-rich regions.
The probability of wrongly predicting a site within a gen-erally non-phosphorylated protein appears to dramati-cally increase with the number of S/T sites in its sequence. Among the 40877 sequences that are included in the retrieved file, only 4860 entries (11.9%) do not have a sin-gle predicted site for PKA-dependent phosphorylation. This result strongly emphasizes the main difficulty of pre-dicting post-translational modifications that can occur in a query protein with multiple suitable serines/threonines. In such cases, a single false-positive site may be responsi-ble for an incorrect assignment of the entire protein.
An increase in prediction accuracy may be obtained by grouping predicted entries together to clusters of related sequences. Naturally, predictions for a single post-transla-tional modification can be considered more reliable if they are frequently observed in a protein family as opposed to a lone protein sequence [43] although this trend is not absolute even for closely related homologues [17,44]. To test the pkaPS tool on families of homologous sequences, the human proteome was clustered into 14674 Multiple alignment of the binding site regions across PKA orthologue sequences
Figure 6
Multiple alignment of the binding site regions across PKA orthologue sequences. Starting with the mouse sequence (accession NP_032880) of the protein in the crystal structure 1JLU [92], we searched for orthologues of the catalytic subunit of PKA with the ANNOTATOR suite [45]. In the alignment (generated with T-COFFEE [94]), we present 40 variants thereof ranging as far as from yeast to human (sequence position numbering is without leading methionines according to the 1.29 Å rule [56,57]). The figure focuses on the protein polypeptide stretch that encompasses the residues forming the surface of the binding site at substrate position from -3 to +1. Red triangles (at Glu127, Glu170 and Glu230 in the numbering of 1JLU without the leading methionine in NP_032880) mark positions that form the pocket for substrate residues -3 and -2. Blue triangles (at Leu198, Pro202 and Leu205) mark the hydrophobic pocket-forming positions that accept substrate residue +1 [4–7].
AAC04355 C. trifolii
BAD04044 C. lagenarium
AAD17221 M. anisopliae
EAA77849 G. zeae
AAG38600 C. albicans
CAG89783 D. hansenii
XP_446753 C. glabrata
XP_453207 K. lactis
AAX55640 T. gondii
BAA08284 P. yoelii
XP_744815 P. chabaudi
NP_704880 P. falciparum
XP_666287 C. hominis
BAA76665 E. gracilis
XP_827379 T. brucei
CAD45617 C. elegans
CAE72620 C. briggsae
AAD16002 A. americanum
CAG44453 A. hebraeum
BAE19914 H. elegans
BAA18952 H. pulcherrimus
CAC00652 A. mellifera
EAA01109 A. gambiae
AAY84715 L. stagnalis
CAA45015 A. californica
CAG01116 T. nigroviridis
AAH77281 X. laevis
NP_001016403X. tropicalis
XP_686379 D. rerio
AAM88381 C. familiaris
P36887 S. scrofa
CAA47627 B. taurus
NP_001009234O. aries
NP_002721 H. sapiens
AAK97389 O. cuniculus
CAA41052 R. rattus
NP_032880 M. musculus
P25321 C. griseus
XP_341662 R. norvegicus
P34099 D. discoideum
MDFVEGGELFSLLRKSGRFPNPVAKFYAAEVTLALEYLHSRDIIYRDLKPENLLLDRHGHLKITDFGFAKRVPDKTWTLCGTPDYLAPEVVSNKGYNKSVDWWSLGILIYEMLCGY MDFVEGGELFSLLRKSGRFPNPVAKFYAAEVTLALEYLHSRDIIYRDLKPENLLLDRHGHLKITDFGFAKRVPDKTWTLCGTPDYLAPEVVSNKGYNKSVDWWSLGILIYEMLCGY MDFVEGGELFSLLRKSGRFPNPVAKFYAAEATLALEYLHSKNIIYRDLKPENLLLDRHGHLKITDFGFAKRVPDKTWTLCGTPDYLAPEVVSNKGYNKSVDWWSLGILIYEMLCGY MDFVEGGELFSLLRKSGRFPNPVAKFYAAEVTLALEYLHSKNIIYRDLKPENLLLDRHGHLKITDFGFAKRVPDKTWTLCGTPDYLAPEVVSNKGYNKSVDWWSLGILIYEMLCGY MDYIEGGELFSLLRKSQRFPNPVAKFYAAEVTLALEYLHSHDIIYRDLKPENILLDRNGHIKITDFGFAKEVSTVTWTLCGTPDYIAPEVITTKPYNKSVDWWSLGVLIFEMLAGY MDYIEGGELFSLLRKSQRFPNPVAKFYAAEVTLAVEYLHSHDIIYRDLKPENILLDRNGHIKITDFGFAKEVSTVTWTLCGTPDYIAPEVITTKPYNKSVDWWSLGVLIFEMLAGY MDYIEGGELFTLLRKSQRFPNPVAKFYAAEVTLALEYLHFHNIIYRDLKPENILLDRNGHIKITDFGFAKEVETVTWTLCGTPDYIAPEVIATKPYNKSVDWWSLGVLIYEMLAGY MDYIEGGELFSLLRKSQRFPNPVAKFYAAEVTLALEYLHSHNIIYRDLKPENILLDRNGHIKITDFGFAKEVITVTWTLCGTPDYIAPEVITTKPYNKSVDWWSLGILIFEMLAGY MEYVIGGEFFTLLRKTRRFENDAARFYAAQVTLIFEYLHDRNIIYRDLKPENLLVDAEGYLKLTDFGFAKVIEYRTYTLCGTPEYIAPEVLLNKGHGKPVDWWTLEILIYEMILGY LEFVIGGEFFTFLRRNKRFPNDVGCFYAAQIVLIFEYLQSLNIVYRDLKPENLLLDKDGFIKMTDFGFAKVVNTRTYTLCGTPEYIAPEILLNAGHGKAVDWWTLGIFIYEILVGY LEFVIGGEFFTFLRRNKRFPNDVGCFYAAQIVLIFEYLQSLNIVYRDLKPENLLLDKDGFIKMTDFGFAKVVNTRTYTLCGTPEYIAPEILLNAGHGKAVDWWTLGIFIYEILVGY LEFVIGGEFFTFLRRNKRFPNDVGCFYAAQIVLIFEYLQSLNIVYRDLKPENLLLDKDGFIKMTDFGFAKIVETRTYTLCGTPEYIAPEILLNVGHGKAADWWTLGIFIYEILVGC MEFVIGGEFFTYLRRCRHFDNETSRFYAAQVVLMFEYLHGKNIIYRDLKPENILIDKDGYLKLTDFGFAKAIEYRTFTLCGTPEYIAPEVLLNKGHGKPVDWWTLGILIYEMVVGF LEYVVGGELFSHLRKAGKFPNDVAKFYAAEVILAFEYIHSMDILYRDLKPENLLLDVGGHIKITDFGFAKKVPERTFTLCGTPEYLAPEIIQSKGHGKAVDWWALGILTYEMLVGY LEFVVGGEVFTHLRSAGRFPNDVAKFYHAELVLAFEYLHSKDIIYRDLKPENLLLDGKGHVKVTDFGFAKKVTDRTYTLCGTPEYLAPEVIQSKGHGKAVDWWTMGVLLYEFIAGH LEFISGGEMFSHLRRIGRFSEPHSRFYAAQIVLAFEYLHSLDLIYRDLKPENLLIDSTGYLKITDFGFAKRVKGRTWTLCGTPEYLAPEIILSKGYNKAVDWWALGVLIYEMAAGY LEFISGGEMFSHLRRIGRFSEPHSRFYAAQIVLAFEYLHSLDLIYRDLKPENLLIDSTGYLKITDFGFAKRVKGRTWTLCGTPEYLAPEIILSKGYNKAVDWWALGVLIYEMAAGY LEYVLGGEMFSHLRKSGRFSEPHARFYGAQIVLAFQYLHSLDLIYRDLKPENLLIDHTGYIKVTDFGFAKRVRGRTWTLCGTPEYLAPEIILSKGYNKAVDWWALGVLVYEMAAGY LEYVLGGEMFSHLRKSGRFSEPHARFYGAQIVLAFQYLHSLNLIYRDLKPENLLIDHTGYIKVTDFGFAKRVRGRTWTLCGTPEYLAPEIILSKGYNKAVDWWALGVLVYEMAAGY LEFVTGGEMFSHLRRIGRFSEPHSRFYAAQIVLVLEYLHHLEIMYRDLKPENLLLDSAGFLKVTDFGFAKRVKGRTWTLCGTPEYLAPEINPSKGYNKAVDWWALGVLVYEMAAGY LDYIPGGEMFSHLRRIGRFSEPHSRFYAAQIVLAFEYLHHLDLIYRDLKPENILIQENGYIAVTDFGFAKRVKGRTWTLCGTPEYLAPEIILSKGYNKAVDWWALGVLIYEMAAGY LEYVPGGEMFSHLRKVGRFSEPHSRFYAAQIVLAFEYLHYLDLIYRDLKPENLLIDSQGYLKVTDFGFAKRVQGRTWTLCGTPEYLAPEIILSKGYNKAVDWWALGVLVYEMAAGY LEYVPGGEMFSHLRKVGRFSEPHSRFYAAQIVLAFEYLHYLDLIYRDLKPENLLIDSQGYLKVTDFGFAKRVKGRTWTLCGTPEYLAPEIILSKGYNKAVDWWALGVLVYEMAAGY LEFVTGGEMFSHLRRIGRFSEPHSRFYAAQIVLVLEYLHHLDIMYRDLKPENLLIDTYGYLKVPDFGFAKRVKGRTWTLCGTPEYLAPEIILSKGYNKAVDWWALGVLIYEMAAGY LEFVTGGEMFSHLRRIGRFSESHSRFYAAQIILSFEYLHYLDLVYRDLKPENLLIDPQGYCKVTDFGFAKRVKGRTWTLCGTPEYLAPEIILSKGYNKAVDWWALGVLIYEMAAGY MEYVPGGEMFSHLRRIGRFSEPHARFYAAQIVLTFEYLHSLDLIYRDLKPENLLIDQQGYIQVTDFGFAKRVKGRTWTLCGTPEYLAPEIILSKGYNKAVDWWALGVLIYEMAAGY MEYVAGGEMFSHLRRIGRFSEPHARFYASQIVLTFEYLHALDLIYRDLKPENLLIDQQGYIQVTDFGFAKRVKGRTWTLCGTPEYLAPEIILSKGYNKAVDWWALGVLIYEMAAGY MEYVAGGEMFSHLRRIGRFSEPHARFYASQIVLTFEYLHALDLIYRDLKPENLLIDQQGYIQVTDFGFAKRVKGRTWTLCGTPEYLAPEIILSKGYNKAVDWWALGVLIYEMAAGY MEYVPGGEMFSHLRRIGRFSEPHARFYAAQIVLTFEYLHSLDLIYRDLKPENLLIDQQGYIQVTDFGFAKRVKGRTWTLCGTPEYLAPEIILSKGYNKAVDWWALGVLIYEMAAGY MEYVPGGEMFSHLRRIGRFSEPHARFYAAQIVLTFEYLHSLDLIYRDLKPENLLIDQQGYIQVTDFGFAKRVKGRTWTLCGTPEYLAPEIILSKGYNKAVDWWALGVLIYEMAAGY MEYVPGGEMFSHLRRIGRFSEPHARFYAAQIVLTFEYLHSLDLIYRDLKPENLLIDQQGYIQVTDFGFAKRVKGRTWTLCGTPEYLAPEIILSKGYNKAVDWWALGVLIYEMAAGY MEYVPGGEMFSHLRRIGRFSEPHARFYAAQIVLTFEYLHSLDLIYRDLKPENLLIDQQGYIQVTDFGFAKRVKGRTWTLCGTPEYLAPEIILSKGYNKAVDWWALGVLIYEMAAGY MEYVPGGEMFSHLRRIGRFSEPHARFYAAQIVLTFEYLHSLDLIYRDLKPENLLIDQQGYIQVTDFGFAKRVKGRTWTLCGTPEYLAPEIILSKGYNKAVDWWALGVLIYEMAAGY MEYVPGGEMFSHLRRIGRFSEPHARFYAAQIVLTFEYLHSLDLIYRDLKPENLLIDQQGYIQVTDFGFAKRVKGRTWTLCGTPEYLAPEIILSKGYNKAVDWWALGVLIYEMAAGY MEYVPGGEMFSHLRRIGRFSEPHARFYAAQIVLTFEYLHSLDLIYRDLKPENLLIDQQGYIQQTDFGFAKRVKGRTWTLCGTPEYLAPEIILSKGYNKAVDWWALGVLIYEMAADY MEYVPGGEMFSHLRRIGRFSEPHARFYAAQIVLTFEYLHSLDLIYRDLKPENLLIDQQGYIQVTDFGFAKRVKGRTWTLCGTPEYLAPEIILSKGYNKAVDWWALGVLIYEMAAGY MEYVAGGEMFSHLRRIGRFSEPHARFYAAQIVLTFEYLHSLDLIYRDLKPENLLIDQQGYIQVTDFGFAKRVKGRTWTLCGTPEYLAPEIILSKGYNKAVDWWALGVLIYEMAAGY MEYVPGGEMFSHLRRIGRFSEPHARFYAAQIVLTFEYLHSLDLIYRDLKPENLLIDQQGYIQVTDFGFAKRVKGRTWTLCGTPEYLAPEIILSKGYNKAVDWWALGVLIYEMAAGY MEYVPGGEMFSHLRRIGRFSEPHARFYAAQIVLTFEYLHSLDLIYRDLKPENLLIDQQGYIQVTDFGFAKRVKGRTWTLCGTPEYLAPEIILSKGYNKAVDWWALGVLIYEMAAGY FEYVAGGEVFTHLRKSMKFSNSTAKFYAAEIVLALEFLHKQNIVYRDLKPENLLIDNQGHIKITDFGFAKRVEDRTFTLCGTPEYLAPEIIQSKGHGKAVDWWALGILIFEMLAGY 410 398 401 470 323 301 243 254 228 226 226 227 277 213 218 255 244 255 235 236 236 237 237 236 236 221 235 235 236 234 235 235 235 235 235 235 235 235 235 527 295 283 286 355 208 186 128 139 113 111 111 112 152 98 103 140 129 140 120 121 121 122 122 121 121 106 120 120 121 119 120 120 120 120 120 120 120 120 120 412
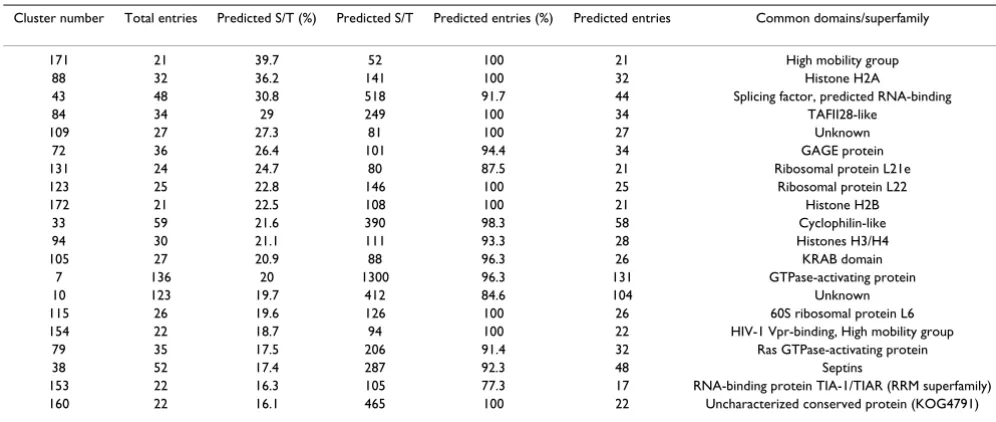
groups with the MCL algorithm [45] (as implemented within the ANNOTATOR suite [46]) and each group was analyzed with the predictor separately. Many of these clus-ters only contained a single or a few sequences. All groups with less than 20 entries were removed from further con-siderations. The remaining 182 clusters were sorted according to the ratio between predicted serines/thre-onines and the total number of these residues in the clus-ter. The 20 clusters with the highest ratio are listed in Table 4. The good performance of the predictor is sup-ported by the fact that families of proteins known to be good PKA targets occupy the top ranks in this listing. In addition to known phosphorylated sequence classes (e.g. histone H2A), there are also entirely uncharacterized groups of proteins that deserve experimental analysis. It is remarkable that this list does not contain any obviously false-positive sequence family.
The prediction of phosphorylation sites in ribosomal pro-teins such as L21e, L22 and L6 deserves special attention in context with the recent discovery of phosphorylation of some ribosomal proteins by specific kinases (such as the ribosomal protein S6 kinase (S6K)) and the important biological role of this phosphorylation [47,48].
Description of the associated WWW site
Supplementary data as well as the pkaPS WWW-server are available at the Mendel WWW-site [49]. The pkaPS server currently accepts up to 500 sequences in fasta-format
(with no more 10000 S/T residues). For analyzing larger sets, we recommend contacting the authors. In interpret-ing the results, we advise to consider scores above 0 as good predictions; the twilight zone limit is -0.5. The pre-dictor pkaPS analyzes the capability of the query sequence to productively interact with PKA. Additional information should be gathered from the literature or from predictors for other sequence properties to decide whether the pre-diction is not a hidden signal and makes sense in the bio-logical context of the query. Additionally, we provide (i) access to the learning set, (ii) detailed results of the self-consistency and the neighbor-jackknife tests, (iii) down-loads of the predictions for the human proteome both in plain and MCL-clustered forms [45].
Discussion
Despite considerable algorithmic advances in the field, none of the prediction tools for PKA-dependent phospho-rylation previously described in the literature achieves specificity and sensitivity rates both above 90%. In our view, several biological and computational aspects con-tribute to this development. Among them, there are sev-eral problems: (a) with the availability of experimental data, (b) with serine/threonine-rich regions, (c) with the incorporation of the available physico-chemical and bio-logical knowledge into the scoring function used to dis-criminate between productively interacting substrates from non-permissive sequence stretches, (d) with the issue of accessibility of the phosphorylation motif within
Table 2: Results of the neighbor-jackknife test
Score Profile Tj Access. Site Sequence Reference
-0.108 0.268 T7,T8 P02687 33 SASTMDHARHGFLPRHRDTGILDSLGRFFGSDRGAPKRGSGK Kishimoto et al. 1985 [37]
-0.158 0.733 T2,T4 P12336 489 VLVFTLFTFFKVPETKGKSFDEIAAEFRKKSGSAPPRKATVQ Thorens et al. 1996 [61]
-0.174 0.560 T4,T7 P24155 643 RFKQEGVLSPKVGMDYRTSILRPGGSEDASTMLKQFLGRDPK Tullai et al. 2000 [69]
-0.264 0.145 T2 P02643 19 GDEEKRNRAITARRQHLKSVMLQIAATELEKEEGRREAEKQN Huang et al. 1974 [82]
-0.367 0.113 T2,T10 Q07954 4517 PTNFTNPVYATLYMGGHGSRHSLASTDEKRELLGRGPEDEIG Li et al. 2001 [83]
-0.469 0.564 T4,T12 P25961 473 VAIIYCFCNGEVQAEIRKSWSRWTLALDFKRKARSGSSSYSY Blind et al. 1996 [62]
-0.469 -0.028 T2,T12 Q13002 697 KIEYGAVEDGATMTFFKKSKISTYDKMWAFMSSRRQSVLVKS Wang et al. 1993 [84]
-0.619 0.891 T1,T2 P02687 10 ---AAQKRPSQRSKYLASASTMDHARHGFLPRHRDT Kishimoto et al. 1985 [37]
-1.813 0.038 T1-T4 P19112 356 SRPSLPLPQSRARESPVHSICDELF--- Ekdahl 1987 [38]
-1.867 -0.409 many P24385 197 RKHAQTFVALCATDVKFISNPPSMVAAGSVVAAVQGLNLRSP Sewing & Müller 1994 [39]
Phosphorylated sites from the learning set that are not predicted by pkaPS in the neighbor-jackknife test. The three entries with the lowest scores are not predicted in the self-consistency test either (Table 1). The listed penalties Tj are the terms which make the highest contributions to the negative overall scores.
Table 1: Results of the self-consistency test
Score Profile Tj Access. Site Sequence Reference
-0.381 1.114 T1,T2 P02687 10 ---AAQKRPSQRSKYLASASTMDHARHGFLPRHRDT Kishimoto et al. 1985 [37]
-1.338 0.495 T1-T4 P19112 356 SRPSLPLPQSRARESPVHSICDELF--- Ekdahl 1987 [38]
-1.368 0.069 many P24385 197 RKHAQTFVALCATDVKFISNPPSMVAAGSVVAAVQGLNLRSP Sewing & Müller 1994 [39]
the protein's three-dimensional structure (intrinsically disordered regions surrounding the site) [27,50] and (e) with the issue of hidden signals (proteins that would be phosphorylated if they were in contact with PKA but which never have the appropriate biological context dur-ing their life cycle) [41].
With regard to point (a), little experimental data is availa-ble for most kinases with regard to the sequence variabil-ity of substrates, structural detail of kinase-substrate complexes, kinetic or energetic aspects of the interaction. Only a few kinases including PKA are reasonably well studied in this respect. For example, the number of sequentially dissimilar substrate sequences for the reliably parameterization of the profile term was estimated at least 200 in [50]. This number is reached for PKA even in the neighbor jackknife test (among the 239 sequence exam-ples, the number of excluded sequences has never been above 10) and the results of this test show that stable pro-file parameterization has almost been achieved.
The issue of many serines/threonines in the sequence (b) is especially challenging since ST-rich regions are com-mon in intra- and extracellular proteins. To detect phos-phorylated proteins on a large-scale basis, every single potential site in a sequence must be taken into
considera-tion. If Sp (measured as value between 0 and 1) is the rate
of correct rejection of a site and if there are n serine/thre-onine residues in a query sequence, the specificity of the task for classification of query proteins decreases
signifi-cantly (to << 1). Considering the difficulties
associ-ated with prediction of potentially multiple sites in ST-rich regions, it is clear that very high accuracies are needed
if such algorithms are to be applied routinely on a large-scale proteome basis.
The incorporation of the heterogeneous knowledge about the PKA-substrate protein relationship into the scoring function (issue c) is a non-trivial problem. Experimental reports usually do not provide the knowledge in the form that is necessary for formulating algorithms. There are two ways to deal with this problem – either to take the infor-mation as is and to hope that machine learning proce-dures filter the aspects of the data that are relevant for prediction, or to formulate a physically reasonable model of productive binding events with the kinase directly. Machine learning approaches have shown their usability in a variety of applications, especially in cases where lots of uniform data are available. The classical example is SIGNALP, for the derivation of which learning sets in the size of thousands of substrate proteins were collected [42].
In many other biological applications, the data situation is by far not that comfortable. In such circumstances, the usage of machine learning software packages as "black boxes" for autonomous extraction of score function parameters without human interference and without explicitly considering the physico-chemical and biological realities of the problem under study can become danger-ous. In their letter to the editors of the Biophysics Journal in 1994 [51], Frank Darius and Raul Rojas analyze the dif-ficulties arising from the discrepancy between the very high dimension of the parameter space in modern machine learning approaches and scarce data when exem-plarily criticizing an alternative signalpeptide predictor. To summarize, the problem is that the calculated parame-ters are not reliable and it is not clear whether the correla-tions found are numerical noise of the data or biologically
Spn
Table 3: Prediction performances of available algorithms compared to pkaPS.
Prediction performance
Algorithm Sn [%] Sp [%] Reference
DISPHOS ca. 76 ca. 85 Iakoucheva et al. 2004 [27]
SCANSITE 70.7 92.9 Zhou et al. 2004 [15]
NETPHOSK 79 89 Blom et al. 2004 [12]
GPS 88.9 90.6 Xue et al. 2005 [16]
PREDPHOSPHO 88.3 91.1 Kim et al. 2004 [14]
pkaPS 95.8 93.5 this work
The table shows the prediction performances of five other programs compared to the worst performance (Sn from neighbor jackknife-test) of the pkaPS predictor. All listed values except for those from DISPHOS refer to PKA-specific versions of the prediction tools. The pkaPS program outperforms all currently available methods that can be used to detect PKA-dependent phosphorylation. The sensitivities (Sn) and specificities (Sp) were directly taken from the original papers. Iakoucheva et al. [27] provide two possible values for the specificity as performance measure for the DISPHOS predictor, one that takes into account the possible occurrence of noise in the negative learning set (higher Sp) and one that does not (lower Sp). For DISPHOS, the Sn value of 76% for serine (none is mentioned for threonine) and the higher, estimated specificity value of 85% (for
meaningful. If the data are scarce and no one tells the "black box" how the substrate protein interacts with the receptor, then the box would indeed need to be a "magic box" to know about it in order to pick the correct signifi-cant parameters.
As a direct consequence, human involvement and addi-tional biological knowledge are indispensable for dimen-sionality reduction. In contrast to machine learning approaches, a physically justified model of productive binding with the kinase already provides a reasonable analytical form of scoring function terms. In this context, it is not so important whether this form can be further improved. We wish to emphasize that the number of parameters to be determined with the help of learning data is dramatically reduced.
In our approach, we consequently follow these considera-tions and try to incorporate all biologically relevant infor-mation into the analytical form of the prediction function. For example, it is utterly important that among all sequence positions, which carry relevant information, as many as possible are considered for the prediction pro-cedure. In the case of PKA, we found the region to occupy the segment -18...+23. Also, we have very few parameters: a profile term over 13 positions centered around the
puta-tive site and 14 physical property terms Tj (typically
involving 3 parameters: the mean and the standard devia-tion of an amino acid index averaged over some sequence region as well as a weight factor for the whole term). Espe-cially the latter set of parameters is determined with high significance given the 239 positive examples. We think that the simplicity of our algorithm is its big strength since the output of the decision function clearly indicates what kind of property supports or prevents the prediction of a query as PKA substrate. In the process of predictor devel-opment, human interference can assure that only the bio-logically meaningful among the significant correlations enter the decision function.
The influence of the structure of the protein on the acces-sibility of the phosphorylation motif to the kinase (issue d) is difficult to estimate at present. By demanding an excess of hydrophilic, small and flexible residues in the region -18...+23 with the physical property terms, it becomes quite unlikely that a sequence region hit by our predictor is actually part of a 3D structure but rather rep-resents an intrinsically disordered segment. Nevertheless, it cannot be excluded that sequence stretches that are not included in the motif definition might cause the entire protein to fold in such a way that the potential phospho-rylation site is not accessible to its modifying kinase.
Finally, the cellular context is important (issue e). In the case of some translocation signals, it has been
experimen-tally shown that even the presence of an in vivo functional
motif does not mean that the carrying protein is also imported into the corresponding subcellular compart-ment [41]. This discovery of hidden sequence signals highlights the significance of cellular hierarchies for small functional protein motifs. Hence, current phosphoryla-tion predictors including pkaPS do not really predict phosphorylation, but the potential of a sequence stretch to interact productively with the modifying kinase. This seemingly small detail may appear negligible but it is important to be considered in all predictions. E.g. a target-ing signal located far away from a functional phosphor-ylation site on the same protein may lead to a removal from the cellular compartment of the respective kinase, thereby overriding the phosphorylation motif. This means that the analyzed motif is not the sole sequence stretch on the protein which is responsible for the modi-fication.
These considerations mean that a phosphorylation pre-dictor is not the only source of information that must be consulted when evaluating the phosphorylation state of a protein. Moreover, the number of apparently wrong pre-dictions (if only the physiologically relevant cases are counted) of an algorithm is not only determined by the imperfection of its design since the predictor focuses on the query sequence stretch. Hence, even if all permissive amino acid permutations of the substrate motif are known, the theoretical accuracy of any post-translational modification predictor will have an upper limit clearly below 100%.
Conclusion
The refinement of the PKA phosphporylation motif showed that approximately 20 sequence positions flank-ing the phosphorylated residue on both sides are restricted in their sequence variability. The conserved physical pattern can be rationalized in terms of a qualita-tive binding model with the catalytic cleft of the protein kinase A. The pkaPS predictor based on this motif descrip-tion confidently discriminates PKA phosphoryladescrip-tion sites from serines/threonines with non-permissive sequence environments (sensitivity of ~96% at a specificity of ~94%).
Methods
Learning set construction
calculations. The original sequences of the substrate pro-teins were obtained from the UNIPROT database [56]. Initiator methionines were removed according to the 1.29Å rule [57,58].
Previous analyses of typical annotation errors in databases [17,20,22,42] emphasized the importance of learning set curation. As expected, a couple of entries were inaccurate or had unclear verifications. Therefore, the following modifications were introduced (protein sequences are indicated by UNIPROT accession numbers):
• The first phosphorylation site of P02646 is actually a double site that lies at positions 22/23 instead of position 20 [59,60].
• Position 137 of the Casein-B precursor sequence (P02666) contains arginine, not serine. According to the paper where the experimental verification is reported [61], phosphorylation occurs in a "variant B" which contains this mutation.
• The experimental verification in the paper cited for the entry P11168 was actually performed for the rat (RINm5F cell line), not the human protein [62]. As a consequence, the entry was replaced by the corresponding rat sequence P12336, with the reported phosphorylation sites located at positions 489, 501, 503 and 510.
• The exact localization of the PKA-dependent phosphor-ylation sites in the PTH/PTHrP type I receptor (P25107) was performed using the rat protein, not the one from opossum [63]. Therefore, P25107 was replaced by P25961 (positions 491, 473 and 475).
• Phosphorylation of the sites in P00698 appears to occur only in the denaturized protein [64]. As the experimental verification status of the entry is not entirely clear, it was excluded from the dataset.
• Entry P13280 is removed from the dataset because the experimental verification for this extremely unusual motif is unclear [65].
• Serine 259 from P04049 is phosphorylated [66] but not listed in Phosph.ELM and was, therefore, added subse-quently.
• According to the corresponding paper [67] and the UNI-PROT entry, the phosphorylated residue of P20020 lies at position 1216 and not 1178.
• Phosphorylation of γ-aminobutyric-acid receptor β1 is
originally reported for the mouse protein instead of the
human counterpart [68]. As a consequence, entry P18505 was replaced by P50571.
• The reported phosphorylation sites for P32245 are only proposed to be potential sites for PKA and GRK. They actually lack any direct experimental verification [69] for PKA-dependent phosphorylation. The corresponding entries were removed from the learning set as a conse-quence.
• Phosphorylation of the metallopeptidase EP24.15 is reported for the rat instead of the human protein [70]. Entry P52888 was, therefore, replaced by P24155 includ-ing the correct location of the phosphorylated serine.
• The phosphorylated serine in P07101 is located at posi-tion 71, not 40. Although the original paper reports Ser40 as site [71], the PKA-motif is shifted in direction of the C-terminus in the UNIPROT entry as a result of additional N-terminal regions from splice variants. Moreover, the experimental verification was performed using the rat pro-tein, and the phosphorylated serine is annotated as "by similarity" in the UNIPROT sequence. Hence, the entry was removed from the learning set.
• P01233 can theoretically be phosphorylated at three sites. However, the post-translational modification states
depend on whether the implicated β-subunit is free and in
its native form [72]. Therefore, the corresponding entry was removed from the learning set.
To generate a set of negative examples, the references of a set of learning set sequences were screened. If it could be deduced that the phosphorylated S/T-sites reported in a publication were the sole amino acids that are modified by PKA, then all remaining S/T-sites were added to the set of negative examples.
The final learning sets consist of 143 sequences with 239 phosphorylated sites and 28 sequences with 1026 non-phosphorylated serines and threonines. Although the set of positive examples contains entries from various taxo-nomical groups, it is mostly centered on mammalian spe-cies. Around one half of the 239 sites originate from H. sapiens (120 sites). Together with the other mammalian entries (93 sites), they make up 89% of the learning set. From the remaining entries, 21 originate from other meta-zoan species, and only 5 are from yeast and viridiplantae.
resi-due. As a consequence, two thirds of the phosphorylated sites in the learning set originate from proteins with mul-tiple modifications. The corresponding distribution of the numbers of phosphorylation sites per protein (shown in Table 5) seems to fall exponentially.
Sequence analysis part 1. Redundancy removal
The phosphorylated serines/threonines of a learning set together with their flanking sequences are represented in
a gapless multiple alignment of npos = 81 positions. The
nseq = 239 phosphorylated sites occupy a single column
that acts as reference location with an assigned position number of 0. Sequence positions further N-terminally have negative values, positions further C-terminally have positive values.
To remove redundancy from over-represented sequence sets in the learning alignment [73], we used a technique similar to the "sum of mismatches"-method from Vingron and Argos [74,75]. The central consideration is that the higher the similarity of a sequence is to all remaining sequences in the alignment, the lower its weight w should be. Here, the number of identical residues between two
sequences k and i is chosen as a distance measure. For
each sequence k, the weight wk is calculated using
Kro-necker's delta according to equation 1. The value γ is
obtained from the normalization to ∑wk = nseq. The use of a modified version of the original Vingron and Argos method is due to the disproportionally high weights that the original method assigns to sequences with many non-amino acid positions such as ones which are outside of the sequence for sites close to either the N- or C-termini.
Sequence analysis part 2. Derivation of physical property characteristics
To assess physical and chemical requirements at specific motif positions, we make use of 20-dimensional property
vectors v which assign characteristic values va to each
amino acid a. These values have been measured in various
experimental setups and quantify amino acid properties such as e.g. hydrophobicity, volume or charge. We used a pre-compiled property database [23,28] for the motif analysis. Here, single property vectors are typically speci-fied by short identifiers such as EISD840101. We use only properties which have defined values for all 20 amino acids.
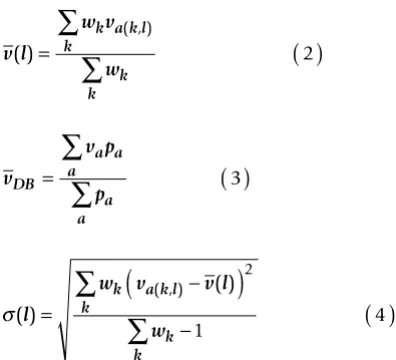
One means of detecting amino acid requirements for a sequence position l is to compare property mean values
(l) with expected mean values DB from biological
databases. Significances can be assessed using Student's t
-distribution with the help of the property value dispersion
σ(l). The values pa represent the database occurrences of amino acid type a calculated on the basis of UNIREF.
w n
a k l a i l k
pos
i n
l
npos seq
=
( )
=
=
∑
∑
γ
δ( ( , ), ( , ))
1 1
1
v v
Table 4: Prediction of the clustered human proteome.
Cluster number Total entries Predicted S/T (%) Predicted S/T Predicted entries (%) Predicted entries Common domains/superfamily
171 21 39.7 52 100 21 High mobility group
88 32 36.2 141 100 32 Histone H2A
43 48 30.8 518 91.7 44 Splicing factor, predicted RNA-binding
84 34 29 249 100 34 TAFII28-like
109 27 27.3 81 100 27 Unknown
72 36 26.4 101 94.4 34 GAGE protein
131 24 24.7 80 87.5 21 Ribosomal protein L21e
123 25 22.8 146 100 25 Ribosomal protein L22
172 21 22.5 108 100 21 Histone H2B
33 59 21.6 390 98.3 58 Cyclophilin-like
94 30 21.1 111 93.3 28 Histones H3/H4
105 27 20.9 88 96.3 26 KRAB domain
7 136 20 1300 96.3 131 GTPase-activating protein
10 123 19.7 412 84.6 104 Unknown
115 26 19.6 126 100 26 60S ribosomal protein L6
154 22 18.7 94 100 22 HIV-1 Vpr-binding, High mobility group
79 35 17.5 206 91.4 32 Ras GTPase-activating protein
38 52 17.4 287 92.3 48 Septins
153 22 16.3 105 77.3 17 RNA-binding protein TIA-1/TIAR (RRM superfamily) 160 22 16.1 465 100 22 Uncharacterized conserved protein (KOG4791)
A more sensitive method involves the calculation of the correlation coefficient R(l) between the property values va
and the observed amino acid counts c(a, l) at an
align-ment position l. The underlying consideration is that
amino acids with high values va of a required property
should occur more frequently than residues with hinder-ing, low property values (or vice versa).
The statistical significance of R (l) can be calculated using the decision criterion [76]:
tαis the argument of the Student's distribution function
for a one-sided criterion with the confidence level α, and
3 stands for the number of conditions (two for the linear
regression and one for the sum of all residue type frequen-cies being unity).
We employ Fisher's test for the detection of inter-posi-tional correlations. Here, the sum of the squared variances
s(li) for all npos isolated positions li is compared to the squared variance σ(l1,l2,...,lnpos) of the combined positions
[20-24,26]:
The obtained F-value follows an F-distribution with nseq –
1 degrees of freedom [76]. For weighted sequences, nseq
needs to be replaced by the sum of the weights of all
sequences that are included in F-value calculation.
Mean values and standard deviations (equations 2, 3 and 4) as well as property correlations (equations 5 and 6) and F-tests (equation 7) have been routinely used in the deri-vation of the physical property pattern surrounding the phosphorylation sites (see first three sections of Results).
In the Results, we often write , σ, R and F without
posi-tional arguments when we describe the positions in the text.
Details of the prediction methodology
Each prediction produces a score S that is composed of a
profile term Sprofile and a physico-chemical penalty value
Sppt.
S = Sprofile + Sppt (8)
The query sequence is predicted if the score is ≥ than a
pre-defined threshold b. We chose a threshold of b = 0 for the
v l
w v
w k a k l k k k ( ) ( , ) =
∑
( )
∑
2 v v p p DB a a a a a =∑
( )
∑
3 σ( ) ( ) ( , ) lw v v l
w
k a k l
k k k = −
(
)
−( )
∑
∑
2 1 4 R lv c a l v c a l
v v a a a a a a a a a ( ) ( , ) ( , ) = − −⎛ ⎝ ⎜⎜ ⎞ ⎠ ⎟⎟ ⎛ ⎝ ⎜ ⎜⎜ ⎞ ⎠ ∑ ∑ ∑ ∑ ∑ 20 20 2 2 ⎟⎟ ⎟⎟ − ⎛ ⎝ ⎜⎜ ⎞ ⎠ ⎟⎟ ⎛ ⎝ ⎜ ⎜⎜ ⎞ ⎠ ⎟ ⎟⎟ ( ) ∑ ∑ 20 5 2 2
c a l c a l
a a
( , ) ( , )
t R n
R v α = − −
( )
3 1 6 2F l l l
l
l l l
n i i n n pos ops pos 1 2 2 1 1 2 2 7 , ,..., , ,...,
(
)
=( )
(
=)
( )
∑
σ σ vTable 5: Distribution of the number of phosphorylated sites per sequence in the learning set.
Sites per sequence Nsequences % % (cum.) Nsites % % (cum.)
1 88 61.5 61.5 88 36.8 36.8
2 30 21.0 82.5 60 25.1 61.9
3 15 10.5 93.0 45 18.8 80.7
4 7 4.9 97.9 28 11.7 92.4
5 1 0.7 98.6 5 2.1 94.5
6 1 0.7 99.3 6 2.5 97.0
7 1 0.7 100.0 7 3.0 100.0
Total 143 100.0 100.0 239 100.0 100.0
prediction of PKAdependent phosphorylation and b = -0.5 for the twilight zone (see Results). The profile term is calculated using the PSIC algorithm [77], a method that provides sequence- and alignment position-specific weights, to remove redundancy from homologous sequences that originate from over-represented protein families. Note that the redundancy removal for the physi-cal property physi-calculation was carried out differently with a modification of the Vingron and Argos procedure [74,75] (see Sequence analysis part 1 in Methods). As different motif positions generally have different importance for substrate binding efficiency, the profile value contribu-tions Sj(a(lj)) of amino acids a at positions lj are weighted using factors αprofile, j For a profile that consists of npos posi-tions, the term Sprofile can be expressed as:
The total penalty Sppt is simply the sum of all npenalties pen-alty terms Tj, where each Tj reflects a piece of the acquired knowledge about substrate binding requirements in the motif region. The height of the penalty can be adjusted using the corresponding weight factor αppt, j.
Each term Tj has an associated property vj that represents the type of physico-chemical requirement, e.g.
hydropho-bicity or size. Its mean value in the query sequence over a set of npos motif positions li, together with the respective mean value over the learning set , the learning set dispersion
and a freely selectable parameter tj are
used as a basis for calculation of Tj.
We use two different types of penalties: (i) fixed ones and (ii) gauss-type penalties. Fixed penalties are simple penal-ties that are applied if the property mean value in the query sequence exceeds the
prede-fined threshold tj, without taking the learning set into
account. Tj is then either 0 or -1.
Whereas fixed Tj only penalize the mere occurrence of
potentially hindering amino acids, Gaussian-type penal-ties also take into account the level of deviation from property preferences at motif positions. To exclude sequences that strongly deviate from the derived consen-sus, the value of Tj increases with the square of the
differ-ence between and the learning set mean
value:
The criterion Φj in equation 11 determines whether a
pen-alty is applied or not. Depending on whether small or
great property values should be penalized, Φj can be
expressed using the two equations below. Here, the
poten-tially freely selectable parameter tj ≥ 0 can be used to
change the stringency of the threshold.
In our concept, the value tj is not thought to be an
adjust-able parameter depending on the learning set. Generally, the value tj is set equal to zero for all Gaussian-type terms but needs to be determined for the fixed penalties to define the level of the threshold (see Table 6). We see the
introduction of tj as a way to achieve equal formal
nota-tion of Gaussian terms and fixed penalties.
Sprofile profile jS a l
j n
j j
pos
=
(
( )
)
( )
=
∑
α ,1
9
Sppt ppt jT
j n
j
penalties
=
( )
=
∑
α ,1
10
v lj ln
pos
( ,...,1 )
vj l ln
LS( ,...,1 pos)
σjLS( ,...,l1 lnpos)
v lj ln
pos
( ,...,1 )
v lj ln
pos
( ,...,1 )
T
v l l v l l
l l
j
j n j n
j n
pos LS pos
LS p
= −Φ
(
(
1)
−(
1)
)
2
1 2
,..., ,...,
,...,
σ
(
oos)
2( )
11
Φj
j n j n j j n
if v l l v l l t l l
pos LS pos pos
= 1
(
1,...,)
<(
1,...,)
− σ((
1,...,)
(
)
≥(
)
−0 if vj l1,...,lnpos vjLS l1,...,lnpos tjσj
((
l1,...,lnpos)
( )
⎧ ⎨ ⎪ ⎩
⎪ 12
Φj
j n j n j j n
if v l l > v l l t l l
pos LS pos pos
= 1
(
1,...,)
(
1,...,)
+ σ((
1,...,)
(
)
≤(
)
+0 if vj l1,...,lnpos vjLS l1,...,lnpos tjσj
((
l1,...,l