Open Access
Research
CD44 expression positively correlates with Foxp3 expression and
suppressive function of CD4
+
T
reg
cells
Tie Liu
†1, Lynn Soong
†1, Gang Liu
2, Rolf König
1and Ashok K Chopra*
1Address: 1Department of Microbiology and Immunology, University of Texas Medical Branch, Galveston, TX, USA and 2Department of Medicine, Feinberg School of Medicine, Northwestern University, Chicago, IL, USA
Email: Tie Liu - [email protected]; Lynn Soong - [email protected]; Gang Liu - [email protected]; Rolf König - [email protected]; Ashok K Chopra* - [email protected]
* Corresponding author †Equal contributors
Abstract
Background: CD4+CD25+ regulatory T (T
reg) cells develop in the thymus and can suppress T cell
proliferation, modulated by Foxp3 and cytokines; however, the relevance of CD44 in Treg cell development is less clear. To address this issue, we analyzed Foxp3 expression in CD44+ T
reg cells
by using multiple parameters, measured the levels of the immunoregulatory cytokine interleukin (IL)-10 in various thymocyte subsets, and determined the suppressor activity in different splenic Treg cell populations.
Results: Within mouse thymocytes, we detected Treg cells with two novel phenotypes, namely the
CD4+CD8-CD25+CD44+ and CD4+CD8-CD25+CD44- staining features. Additional
multi-parameter analyses at the single-cell and molecular levels suggested to us that CD44 expression positively correlated with Foxp3 expression in thymocytes, the production of IL-10, and Treg
activity in splenic CD4+CD25+ T cells. This suppressive effect of T
reg cells on T cell proliferation
could be blocked by using anti-IL-10 neutralizing antibodies. In addition, CD4+CD25+CD44+ T reg
cells expressed higher levels of IL-10 and were more potent in suppressing effector T cell proliferation than were CD4+CD25+CD44- cells.
Conclusion: This study indicates the presence of two novel phenotypes of Treg cells in the thymus, the functional relevance of CD44 in defining Treg cell subsets, and the role of both IL-10 and Foxp3 in modulating the function of Treg cells.
Reviewers: This article was reviewed by Dr. M. Lenardo, Dr. L. Klein & G. Wirnsberger (nominated by Dr. JC Zungia-Pfluker), and Dr. E.M. Shevach.
Background
Treg cells are important in the control of self-reactive T
cells, contributing to the maintenance of immunological self-tolerance [1]. Treg cells develop in the thymus through a process involving the recognition of self-peptides pre-sented by major histocompatibility complex (MHC) mol-ecules and driven by high-affinity interactions between
the T cell receptor (TCR) on developing thymocytes and self peptide-MHC complexes on thymic epithelial cells [2-5]. Forkhead box P3 (Foxp3), an X-chromosome-linked
factor that controls Treg cell development and function, is
generally thought to also control positively the functions of Treg cells in a binary fashion, as Foxp3 expression is suf-ficient to specify immune-suppressive activities in
con-Published: 23 October 2009
Biology Direct 2009, 4:40 doi:10.1186/1745-6150-4-40
Received: 8 April 2009 Accepted: 23 October 2009
This article is available from: http://www.biology-direct.com/content/4/1/40
© 2009 Liu et al; licensee BioMed Central Ltd.
ventional T cells [6]. Although Foxp3 is considered as a specific marker for the Treg cell lineage [7,8], its expression pattern during thymocyte development remains less clear.
Treg-mediated suppression is cell contact dependent [9],
but the immunosuppressive cytokines transforming
growth factor (TGF)-β and IL-10 also play an important
role [10-12]. The collective activity of TGF-β and IL-10
ensures a controlled inflammatory response specifically targeting pathogens without evoking excessive immun-opathology to self-tissues [13]. IL-10 is a cytokine which is an essential molecule in the mechanism underlying
suppression mediated by Treg cells. It has
anti-inflamma-tory activity and indirectly suppresses cytokine
produc-tion and proliferaproduc-tion of antigen-specific CD4+ T effector
cells. IL-10 is produced by subsets of CD4+ cells with
reg-ulatory function [14]. More specifically, it has been shown that IL-10 produced by Treg cells is essential for in vivo sup-pression, as IL-10-deficient Treg cells can not regulate T cell
induced colitis [15,16]. TGF-β and IL-10 are potent
medi-ators of immune suppression, and Treg cells can not only
use TGF-β and IL-10 to perform their
immunosuppres-sion function, but also to educate other CD4+CD25-cells
to become Treg cells [12].
The adhesion molecule CD44 (synonymous with Pgp1, HUTCH-1, or ECM-III) is the principal receptor for hyaluronic acid. Multiple functions and cellular responses have been attributed to the activation of CD44, including the induction of cell motility, activation of cell survival responses, and promotion of cell adhesion [17]. Although CD44 has a wide tissue distribution, its expression during a particular stage or in a subset of thymocyte progenitors suggests a functional involvement of CD44 in homing and thymic colonization of precursor cells [18]. Although differential expression levels of CD44 among different subsets of thymocytes have been reported [19], its biolog-ical relevance in T cell differentiation is unclear.
In this study, we used naïve C57BL/6 mice and performed six-color flow cytometry and real-time reverse tran-scriptase (RT)-polymerase chain reaction (PCR) analyses,
as well as in vitro T cell suppression assays. We present
herein the following key findings: 1) the surface expres-sion of CD44 in mouse thymocytes positively correlated
with that of Foxp3; 2) CD4+CD25+CD44+ T
reg cells
expressed higher levels of IL-10 and were more potent in suppressing effector T cell proliferation than were
CD4+CD25+CD44- cells; and 3) blocking IL-10
aboro-gated suppressive mechanisms of CD4 Treg cells. Our data
suggest that Treg cells could be further divided into three
subsets based on CD44 expression levels, with CD4+CD25+CD44high cells displaying the highest levels of
IL-10 production and having regulatory functions.
Methods
Mice
Female C57BL/6 mice (Taconic Farms, Germantown, NY) were maintained under specific pathogen-free conditions, and used for experimentation at 4 to 6 weeks of age, according to protocols approved by the UTMB Institu-tional Animal Care and Use Committee and NIH guide-lines.
Flow cytometric analysis
Thymocytes and splenocytes were obtained from naïve mice and suspended in phosphate-buffered saline (PBS) and 1% fetal calf serum (FCS). To avert non-specific
bind-ing to mouse Fcγ receptors, cells were blocked with mouse
CD16/CD32 mAb (0.25 μg/100 μl) (BD Biosciences,
Franklin Lakes, NJ) for 15 min. After washing, cells were stained for the expression of CD4 (PE-Cy7, clone RM 4-5),
CD8α (FITC, clone 53-6.7), CD44 (PE, clone 1M7), CD25
(APC-Alexa Fluor755, clone PC-61.5), or TCR-β (PerCp,
clone H57-597) at 4°C for 60 min. In some cases, the sur-face-stained cells were fixed/permeabilized with a Cytofix/Cytoperm kit (BD Biosciences) and then stained with Foxp3 (PE-Cy5, clone FJK-16s) or IL-10 (PerCP, clone JESS-16E3) at 4°C for 45 min. The corresponding isotype controls (rat IgG1, IgG2a, and IgG2b) were pur-chased from eBioscience (San Diego, CA) and BD Bio-science, respectively. Cells were analyzed using a FACScan (BD Biosciences) and BD FACSDiva software (BD Bio-sciences).
Isolation of CD4+ T subsets
Splenocytes were collected from C57BL/6 mice, treated with RBC lysis buffer (Sigma, St. Louis, MO), and T cells were enriched by passage through nylon-wool columns
and subsequently purified. Briefly, splenocytes (108) were
incubated in the column at 37°C in the presence of 5%
CO2 for 1 h before eluting the cells with RPMI medium.
Cells were then stained for the surface expression of CD4, CD8, CD44, and CD25 by incubating with the appropri-ate antibodies at 4°C for 60 min. After washing, the
fol-lowing subsets of CD4+ T cells were isolated by using a
FACSAria (BD Biosciences): CD4+CD25+CD44+,
CD4+CD25+CD44-, CD4+CD25+CD44high,
CD4+CD25+CD44med, and CD4+CD25+CD44low cells.
Purified T cell subsets were immediately used for subse-quent analyses.
RT-PCR and real-time RT-PCR
Total RNA was extracted from purified T cell subsets. The
first-strand cDNA was synthesized from 2 μg of RNA using
reverse transcriptase (SuperScript III, Invitrogen). An
aliq-uot of first-strand cDNA was amplified by Ampli-Taq
(Per-kin-Elmer Cetus, Norwalk, CT) in a total volume of 50 μl
reaction buffer consisting of 10 mM Tris-HCl (pH 8.3), 50
deoxynucleoside triphosphate. The primers for RT-PCR were: IL-10 forward
5'-CAGACTCTTAAACACCGAGCCG-3', reverse 5'-GACTTAGCAAGACACGATGCGA-3'; and β
-actin forward 5'-TGGAATCCTGTGGCATCCATGAAAC-3', reverse 5'-TAAAACGCAGCTCAGTAACAGTCCG-3'. The PCR reaction included one cycle of initial amplification (at 94°C for 5 min, 56°C for 3 min, 72°C for 2 min), fol-lowed by 22 to 32 cycles at 94°C for 1 min, annealing at 56°C for 1 min, and extension at 72°C for 0.5 min. The final extension reaction was prolonged to 10 min at 72°C. After amplification, PCR products were separated by elec-trophoresis through 1-2% agarose gels.
Quantitative RT-PCR was performed at the Real-Time PCR Core Facility, Sealy Center for Cancer Cell Biology, UTMB. We used Applied Biosystems (Foster City, CA) assay-by-design and assay-on-demand 20× assay mixes of primers and TaqMan MGB probes (FAM™ dye-labeled) for our tar-get genes (IL-10) and a pre-developed 18S rRNA
(VIC™-dye labled probe) TaqMan® assay reagent for an
endog-enous control. Real-time RT-PCR was performed with 40 ng cDNA, using a universal PCR master mix reagent kit (Applied Biosystems) and the following cycling parame-ters: Uracil-N-glycosylase (UNG) activation at 50°C for 2 min, AmpliTaq activation at 95°C for 10 min, denatura-tion at 95°C for 15 sec and annealing/extension at 60°C
for 1 min (repeat 40 times) on ABI7000. Duplicate CT
val-ues were analyzed via an in Microsoft Excel program using
the comparative CT (ΔΔCT) method, as described by the
manufacturer (Applied Biosystems). The amount of target
(2-ΔΔCT) was obtained and normalized to the endogenous
reference (18s) and relative to a calibrator (one of the experimental samples).
In vitro T cell suppression assay
Splenic T cells were prepared by passing splenocytes
through nylon-wool columns (108 splenocytes were
incu-bated in the column at 37°C in the presence of 5% CO2
for 1 h before eluting the cells with RPMI medium). Effec-tor T cells were pre-cultured with Concanavalin A (Con A,
20 μg/ml) for 2 h, washed, and then seeded in 96-well
U-bottom microtiter plates (2 × 10⁵/well), to which T
reg cells
were added at Treg-to-effector cells in a ratio of 1:2. After
cultivation in the presence of Con A (2 μg/ml) for 72 h,
cells were pulsed with [3H]-thymidine for the last 10 h,
and incorporation of radioactivity was measured by liquid scintillation counting in triplicate. Data were expressed as the arithmetic means ± standard deviation (S.D.).
To assess the involvement of IL-10 in reversing T cell
sup-pression, we sorted CD4+ CD25- and CD4+ CD25+ CD44+
(or CD4+CD25+ CD44-) cells via FACS. T cells (in RPMI
medium) were incubated alone or co-cultured with Treg
cells at a 2:1 ratio with 1 μg/ml plate-bound anti-CD3
(145.2C11, BD Bioscience) in 96-well U-bottom plates. In
some cases, blocking anti IL-10 antibodies (1B1.3a, 100 ng/ml, BD Bioscience) or rat IgG1 isotype control (R3-34, 100 ng/ml, BD Bioscience) were added, and the above mixture of cells were incubated at 37°C in the presence of
5% CO2 for 72 h. Subsequently, cells were pulsed with
[3H]-thymidine for the last 10 h, and incorporation of
radioactivity was measured by liquid scintillation count-ing in triplicate. Data were expressed as the arithmetic means ± S.D.
Statistical analysis
At least three independent experiments were performed, and the difference between two groups was determined
using Student's t-test. One- or two-way ANOVA was used
for multiple group comparisons (GraphPad Software v 4.0, San Diego, CA). Statistically significant values were referred to as follows: *, p < 0.05; **, p < 0.01; ***, p < 0.001.
Results
Detection of CD4+CD8-CD25+CD44- and CD4+CD8 -CD25+CD44+ T cells in the thymus
CD4+CD25+ cells are members of a unique lineage of T
cells that are selected during the process of T cell develop-ment in the thymus; however, the location and sequence
of Treg cell development remain unclear [20-22]. To
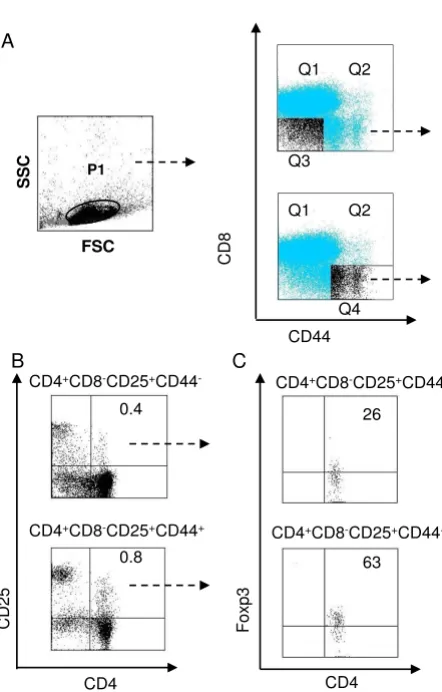
address this issue, we first examined the profile of thymo-cytes in naïve mice using multi-color flow cytometry for the simultaneous detection of CD4, CD8, CD25, and CD44 cells. As shwon in Figure 1A, live thymocytes were gated as P1, and these thymocytes were subsequently divided into four populations based on CD44 and CD8 expression (identified by quadrants Q1-Q4), yielding the
CD4+CD8-CD25+CD44- population from Q3 and the
CD4+CD8-CD25+CD44+ population from Q4. These
pop-ulations of CD4+CD8-CD25+CD44- and CD4+CD8
-CD25+CD44+ single positive (SP) cells were comprised of
only 0.4% and 0.8% of total thymocytes, respectively (Fig-ure 1B). Furthermore, Foxp3 expression was detacted in
63% of CD4+CD8-CD25+CD44+ cells and 26% of
CD4+CD8-CD25+CD44- cells (Figure 1C). These staining
and gating approaches allowed us to detect 16 distinct subsets of cells.
TCR-β expression in subsets of Treg cells in the thymus
Since a productive TCR-β gene rearrangement is a critical
event in thymocyte development and proliferation
[23,24], we then examined TCR-β expression in different
subsets of thymocytes. For Figure 2A, total live thymocytes (P1) were gated, as described for Figure 1. Based on expression of CD4 and CD8, we defined subpopulations of CD4-CD8- as P4, CD4+CD8+ as P3, and CD4+CD8- cells
meas-ured TCR-β expression. We observed that CD4+CD8
-CD25+CD44+ cells contained a higher percentage of
TCR-β+ cells than did CD4+CD8-CD25+CD44- cells (Figure 2B).
To further define the role of CD44 expression in the
devel-opment of CD4+CD25+ cells, we subdivided CD4+CD8
-CD25+CD44+ SP cells into CD4+CD8-CD25+CD44low,
CD4+CD8-CD25+CD44med, and CD4+CD8
-CD25+CD44high cells (Figure 2A). We then analyzed the
percentage of TCR-β-expressing cells in each
subpopula-tion (Figure 2C). Among CD4+CD8-CD25+cells, the
CD44high subpopulation expressed TCR-β at the highest
frequency and intensity, whereas the CD44low
subpopula-tion displayed the lowest expression levels of TCR-β. Thus,
the surface expression of CD44 was positively correlated
with TCR-β expression, suggesting that the CD4+CD25+
CD44high cells represent a more mature subset of T cells.
Foxp3 and CD44 expression in mouse thymocytes and splenocytes
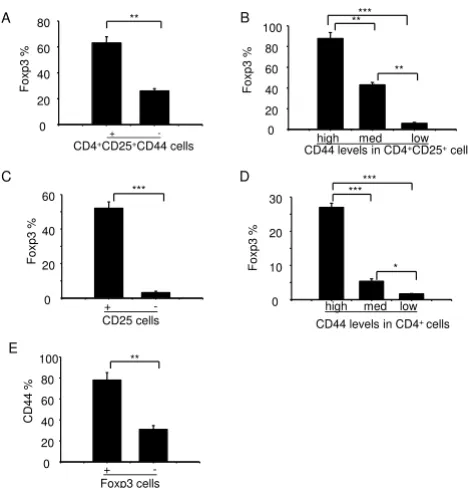
To test whether there are functional differences between different subsets of CD44-expressing cells, we examined the expression profile of Foxp3. Thymocytes derived from naïve mice were stained with antibodies against CD4, CD8, CD25, CD44, and Foxp3 (Figure 3). In three inde-pendently performed experiments, we consistently found that a significantly higher proportion of
CD4+CD25+CD44+ cells expressed Foxp3 as compared to
CD4+CD25+CD44- cells (63% vs. 26%, p < 0.01, Figure
3A). We also observed a positive correlation between
TCR-β expression on CD4+ CD8- CD25+ CD44+ T
reg cells in
mouse thymus Figure 2
TCR-β expression on CD4+ CD8- CD25+ CD44+ T reg cells in mouse thymus. Thymocytes were collected from naïve mice, stained with antibodies against CD4 (PE-Cy7), CD8 (FITC), CD44 (PE), CD25 (APC-Alexa Fluor755), and TCR-β(PerCp), and analyzed by flow cytometry. (A) CD4
-CD8- (P4), CD4+CD8+ (P3), and CD4+CD8- cells (P5) were
gated from total, live thymocytes (P1). Cells from each of the quadrants (designated as P3-P5) were subgated into
CD25+CD44- and CD25+CD44+ (In Figure 2A, - and + mean
CD25+CD44- and CD25+CD44+ cells [analysis described in
panel B]). In addition, CD4+CD8- SP cells were subgated into
CD25+CD44low, CD25+CD44med, and CD25+CD44high cells
(analysis described in panel C). (B) The percentages of TCR-β cells in CD4+CD8- SP cells (mean ± S.D., n = 3). (C) The
percentages of TCR-β cells among CD4+CD25+CD44low,
CD4+CD25+CD44med, and CD4+CD25+CD44high cells.
Sta-tistical significance in panels B and C is indicated by * p < 0.05 and ** p < 0.01.
CD4
CD8
P1
CD44
CD25
low med high
A - +
B
TC
R
-p
ositive cells
(%
)
C
0 20 40 60 80 100
CD44 levels in CD4+CD25+cells
Low med high
** * *
FSC
SSC
TC
R
-p
ositive cells
(%
)
0 20 40 60 80 100
**
P3 P2
P4 P5
- +
CD4+CD25+CD44 cells
Detection of CD4+ CD8- CD25+ CD44+ and CD4 + CD8-
CD25+ CD44- T
reg cells in the thymus
Figure 1
Detection of CD4+ CD8- CD25+ CD44+ and CD4 + CD8- CD25+ CD44- T
reg cells in the thymus. (A) Cell
gating strategy and staining patterns. Thymocytes were obtained from naïve C57BL/6 mice and stained with specific antibodies against CD4 (Cy7-PE), CD8 (FITC), CD44 (PE), and CD25 (APC-Alexa Fluor755). Cells in P1 were gated as live thymocytes. (B) Based on CD44 and CD8 expression, CD4+CD8-CD25+CD44+ and CD4+CD8-CD25+CD44- cells
were defined. (C) Foxp3 expression in CD4+CD8
-CD25+CD44+ and CD4+CD8-CD25+CD44- cells. The data
are shown as the percentage of total, live thymocytes (popu-lation P1) in each cell subset, and are presented as mean ± S.D. from four independent experiments.
0.8 0.4
P1
CD44
CD4
CD8
CD25
CD4+CD8-CD25+CD44+
CD4+CD8-CD25+CD44
-Q1
Q1 Q2
Q3
Q2
Q4
CD4
Foxp3
CD4+CD8-CD25+CD44+
CD4+CD8-CD25+CD44
-63 26
A
B C
FSC
CD44 and Foxp3 expression among CD4+CD25+ cells.
Foxp3 was detected in 87% of the CD4+CD25+CD44high
cells, 41% of the CD4+CD25+CD44med cells, and 5.9% of
the CD4+CD25+CD44low cells (Figure 3B). Consistent
with another report [2], a higher proportion of
CD4+CD25+cells expressed Foxp3 compared to
CD4+CD25- cells (52% vs. 3.2%, p < 0.01, Figure 3C).
Again, the CD4+CD44high population contained the
high-est proportion of Foxp3-expressing cells (Figure 3D). Most
of the CD4+Foxp3+cells also expressed CD44 (78%),
whereas 31% of CD4+Foxp3- cells expressed CD44 (Figure
3E). Thus, we found a positive correlation between Foxp3 and CD44 expression, suggesting that CD44 may be an additional marker for the maturation of regulatory thy-mocytes.
To validate these findings, we also stained splenocytes with antibodies against CD4, CD8, CD25, CD44, and Foxp3. We found a significantly higher proportion of
CD4+CD25+ CD44+ cells expressed Foxp3 than that of
CD4+CD25+CD44- cells (61% vs. 25%, Figure 4A),
sug-gesting a positive correlation between CD44 and Foxp3
expression among CD4+CD25+ cells. Foxp3 was detected
in 72% of the CD4+CD25+CD44high cells, 42% of the
CD4+CD25+CD44med cells, and 13% of the
CD4+CD25+CD44low cells (Figure 4B).
Foxp3 expression in different subsets of splenocytes Figure 4
Foxp3 expression in different subsets of splenocytes. Splenocytes were stained with antibodies against CD4 (PE-Cy7), CD8 (FITC), CD44 (PE), CD25 (APC-Alexa Fluor755), Foxp3 (PE-Cy5) and analyzed by flow cytometry. (A) Foxp3 expression (%) in CD4+CD25+ cells that was either positive
or negative for CD44. (B) Foxp3 expression (%) in
CD4+CD25+ cells that expressed high, medium, or low levels
of CD44. Shown are representative results with mean ± S.D. from three independent experiments (** p < 0.01, *** p < 0.001).
0 20 40 60 80 100
0 10 20 30 40 50 60 70
Foxp3
%
A
+
-CD44 levels in CD4+CD25+ cells
Foxp3
%
**
***
** **
B
CD44 levels in CD4+CD25+ cells high med low
Foxp3 expression in different subsets of thymocytes Figure 3
Foxp3 expression in different subsets of thymocytes. Thymocytes were stained with antibodies against CD4 (PE-Cy7), CD8 (FITC), CD44 (PE), CD25 (APC-Alexa Fluor755), and Foxp3 (PE-Cy5). CD4-CD8- DN, CD4+CD8- SP, CD4
-CD8+ SP, and CD4+CD8+ DP thymocytes were gated for
subsequent analyses. (A) Foxp3 expression (%) in CD4+CD25+ cells that was either positive or negative for
CD44. (B) Foxp3 expression (%) in CD4+CD25+ cells that
expressed high, medium, or low levels of CD44. (C) Foxp3 expression (%) in CD4+ cells that was either positive or
neg-ative for CD25. (D) Foxp3 expression (%) in CD4+ cells that
expressed high, medium, or low levels of CD44. (E) CD44 expression (%) in CD4+ cells that was either positive or
neg-ative for Foxp3. Panels A to E show representneg-ative results with mean ± S.D. from three independent experiments (* p < 0.05, ** p < 0.01, *** p < 0.001).
high med low
Fox
p3 %
0 20 40 60 80 100
0 10 20 30
0 20 40 60
B
0 20 40 60 80 100
CD44 %
E
+ -Foxp3 cells
** 0
20 40 60 80
A
+
-CD4+CD25+CD44 cells
Foxp3
%
**
Foxp3
%
C
***
+ -CD25 cells
Foxp3
%
D
* *** ***
CD44 levels in CD4+ cells
***
high med low
CD44 levels in CD4+CD25+cells
Functional assessment of Treg cell subsets in the thymus and spleen
To examine whether CD4+CD25+CD44+ and
CD4+CD25+CD44- cells differ in their ability to suppress
effector T cells, we sorted CD4+CD25+CD44+ and
CD4+CD25+CD44- cells from the spleen by FACS. Isolated
cell populations were then co-cultured with naïve T cells pre-activated with Con A for 2 h. After co-culture of effec-tor T cells (2 × 10⁵/well) with T
reg cells in the presence of
Con A (2 μg/ml) for 72 h, T cell proliferation was
meas-ured. As shown in Figure 5A, although CD4+CD25+CD44+
and CD4+CD25+CD44- cells were capable of suppressing
T cell proliferation, CD4+CD25+CD44+ cells were
signifi-cantly more potent suppressors than were
CD4+CD25+CD44- cells. Because the expression of IL-10
is a hallmark of Treg cells [12,16], we examined via RT-PCR
the levels of IL-10 mRNA in purified CD4+CD25+CD44+
and CD4+CD25+CD44- cells. The levels of IL-10 were 2 to
2.4-fold higher in CD4+CD25+CD44+ cells than in
CD4+CD25+CD44- cells, as determined by densitometry
scanning of the gels (Figure 5B and 5C) and the data were pooled from three independent experiments and shown in a plot (Figure 5D). To confirm these findings, we sorted
CD4+CD25+CD44high, CD4+CD25+CD44med, and
CD4+CD25+CD44low cells from the spleens and measured
the levels of IL-10 mRNA by real-time RT-PCR. As shown
in Figure 5E, CD4+CD25+ CD44high T
reg cells expressed
5-fold higher levels of IL-10 than did CD4+CD25+CD44low
cells. Thus, the CD44 expression levels and Treg function
were positively correlated. To further examine the
intrath-ymic development of Treg cells, we sorted CD4+CD8
-CD25+CD44+, CD4+CD8-CD25+CD44-, CD4+CD8-CD25
-CD44+, and CD4+CD8-CD25-CD44- cells from the
thy-mus and measured the levels of IL-10 by real-time RT-PCR. It was noted in Figure 5F that among these four
CD4+ cell subsets, CD25+CD44+ cells expressed the
high-est levels of IL-10 mRNA, and therefore represented the
Treg cell population with the highest suppressive activity.
There were no major differences with regard to IL-10
expression for CD25+CD44- and CD25-CD44+ cells. Thus,
CD4+CD25+CD44+ and CD4+CD25+CD44- cells both
dis-played regulatory functions, but the former disdis-played more potent Treg activity than the latter.
CD44 Treg cells produce IL-10 that suppresses T cell proliferation
To determine that IL-10 was produced by Foxp3+ T cells
but not by other cells, we isolated thymocytes and splen-ocytes from naïve mice and stained them with antibodies against CD4, CD8, CD25, CD44, IL-10. As shown in Fig-ure 6A and 6C, we found that a significantly higher
pro-portion of CD4+CD25+CD44+ cells produced IL-10 in the
splenocytes and thymocytes (6.0% and 3.2%,
respec-tively) as compared to CD4+CD25+CD44- cells in
spleno-cytes and thymospleno-cytes (0.6% and 0.4%, respectively, p <
Regulatory function of CD4+ CD25+ CD44+ and CD4+
CD25+ CD44- splenocytes
Figure 5
Regulatory function of CD4+ CD25+ CD44+ and CD4+ CD25+ CD44- splenocytes. (A) CD4+CD25+CD44+ and
CD4+CD25+CD44-cells were sorted from the splenocytes of
C57BL/6 mice, and these cells (1 × 10⁵/well) were
co-cul-tured with naïve T cells (2 × 10⁵/well) in the presence of Con
A for 72 h. T cell proliferation was measured by incorpora-tion of [3H]-thymidine. Data are presented as counts per
min, and shown are the mean ± S.D. from three independent experiments. (B) Total RNA was extracted from purified CD4+CD25+CD44+ and CD4+CD25+CD44- cells for
RT-PCR analysis of IL-10 expression. (C) The integrated density values (IDV) for the IL-10 transcripts were quantitated and normalized to those of β-actin. Shown are representative results from one of three independent experiments. (D) The data were pooled from three independent experiments and shown in the plot. (E) The levels of IL-10 mRNA among dif-ferent subsets of CD44+ expressing cells.
CD4+CD25+CD44high, CD4+CD25+CD44med and
CD4+CD25+CD44low cells were sorted from the spleens of
naïve mice. (F) CD4+CD8-CD25+CD44+, CD4+CD8
-CD25+CD44-, CD4+CD8-CD25-CD44+, and CD4+CD8
-CD25+CD44- cells were sorted from the thymus of naive
0.01). Likewise, the percentages of IL-10+ cells in
CD4+CD25+CD44+ Foxp3+ T cells derived from the spleen
and thymus (27% and 31%, respectively) were signfic-natly higher than those in CD4+CD25+CD44- Foxp3+ cells
(18% and 15%, respectively, Figure 6B and 6D).
IL-10 plays a pivotal role in maintaining homestasis via
direct or indirect control of activation, proliferation, but
also via its effects on regulatory T cells [25]. To further
confirm whether blocking IL-10 aborogated suppressive
mechanisms of CD4 Treg cells, CD4+CD25- and
CD4+CD25+CD44+(or CD4+CD25+CD44-) cells were
sorted by FACSAria and were incubated alone or
co-cul-tured (CD4+CD25-: CD4+ CD25+) at a 2:1 ratio in the
presence of anti-CD3 antibody. In some experiments, blocking antibodies to IL-10 or isotype rat IgG1 control were also used, and after 72 h of incubation,
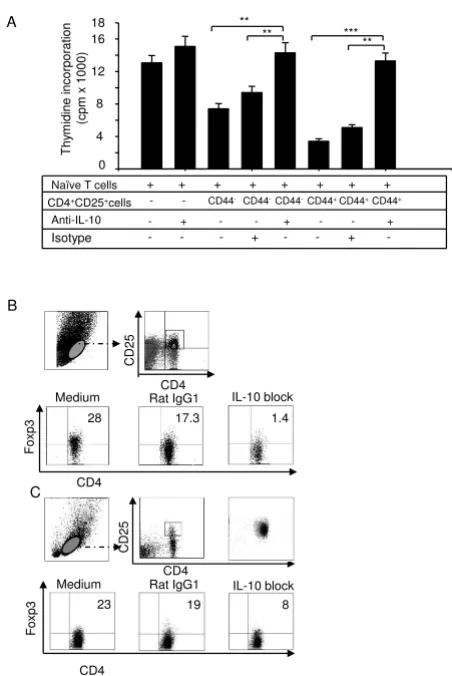
incorpora-tion of radioactivity was measured by liquid scintillaincorpora-tion counting in triplicate. As shown in Figure 7A, the
suppres-sive activity of Treg cells was aborated when an anti-IL-10
antibody was used.
It is known that Foxp3 controls Treg cell development and
function. To validate the contribution of IL-10 in regulat-ing T cell development and function, we obtained spleno-cytes from naïve mice and treated them with an IL-10 neutralizing antibody or an isotype control (rat IgG1) in
the presence or absence of Con A (5 μg/ml) for 24 h, with
GolgiPlug in the medium for the last 3 h. Cells were stained with antibodies against CD4, CD8, CD25, CD44, and Foxp3 and analyzed by FACS. As shown in Figure 7B, Foxp3 expression levels were much lower (1.4%) in
CD4+CD25+cells treated with anti-IL-10 antibody than
those treated with an isotype control (17.3%) or without antibody (28%).
Next, we sorted CD4+CD25high cells and incubated them
alone or togather with IL-10 blocking antibody or isotype control. After 24 h of incubation, the cells were harvested and anayzed. As shown in Figure 7C, Foxp3 expression were signficnatly decreased by the addition of anti-IL-10
in the CD4+CD25+ population of the cells (8%) than
those treated with an isotype control (19%) or without antibody (23%). These data suggested an invovlment of
IL-10 in suppressive mechanisms of Treg cells.
Discussion
In this study, we have provided evidnece that
CD4+CD25+CD44+T
reg cells expressed high levels of
Foxp3, IL-10, and displayed a potent suppressive function
in vitro. Our results are consistant with those reported by Bookimin et al. [26] and Bollyky et al. [27], suggesting that CD4+CD25+CD44high cells display more potent T
reg
func-tions than do CD4+CD25+CD44low cells. As expected,
these Treg cells suppress effector T cell proliferation via the production of IL-10. The significance of this study is that it highlights the functional relevence of CD44 in defining
Treg cell subsets and may explain the unique
developmen-tal pathway of CD4+T
reg cells in the mouse thymus and the
subtle differences between various Treg cell subsets.
The use of better markers or marker combinations in multi-color flow cytometry has made it possible to resolve and define many very small populations of lymphoid
pro-genitors and mature cells. For example, Seddiki et al. used
38 surface markers and revealed the persistence of naïve
CD45RA+ T
reg cells in infant thymus, cord or adult
periph-eral blood, lymph nodes, and spleen [28]. In this study, the simultaneous use of mAbs specific for CD4, CD8, CD25 and CD44 allowed us to detect 16 subtypes of
thy-mocytes, with 80% of the thymocytes as being CD4+CD8+
cells (data no shown). Of note, CD4+CD8-CD25+CD44+
Intracelluler IL-10 levels in Treg cells of thymocytes and
splen-ocytes Figure 6
Intracelluler IL-10 levels in Treg cells of thymocytes and splenocytes. Splenocytes (A and B) and thymocytes
(C and D) were obtained from naïve C57BL/6 mice, stained with mAbs against CD4 (PE-Cy7), CD8 (FITC), CD44 (PE), CD25 (APC-Alexa Fluor755), Foxp3 (APC) and IL-10 (PerCP), and analyzed by flow cytometry. (A and C) The percentages of IL-10+ cells in CD4+CD25+CD44- and
CD4+CD25+CD44+ cells. (B and D) The percentages of
IL-10+ cells in CD4+CD25+CD44-FoxP3+ and
CD4+CD25+CD44+ FoxP3+ cells. Shown are representative
results from one of four independent experiments. Data in B and D are presented as mean ± S.D.
CD8
IL-1
0
6.0
CD4
CD8
CD4
CD8
CD8
IL-1
0
3.2 0.6
0.4
CD4+CD25+
CD44- CD44+
CD4+CD25+
CD44- CD44+ CD44
CD44
CD25
CD25
A
C
spleen
thymus
0 10 20 30
IL-10+ cells
*
0 15 25 35
IL-10+ cells
CD44+ CD44
-CD4+CD25+Foxp3+
**
B
D
CD44+ CD44
-CD4+CD25+Foxp3+
and CD4+CD8-CD25+CD44- T
reg cells in the thymus
con-stituted only 0.4% and 0.8%, respectively, of the total
thy-mocytes (Figure 1B). While 72% of CD4+CD8
-CD25+CD44+ cells expressed Foxp3, only 28% of
CD4+CD8-CD25+CD44- cells expressed Foxp3 (Figure
1C).
The TCR-β locus plays an important role in the
develop-ment of T cells [23,24]. Although in TCR transgenic mice, exposure of the developing T cells to the cognate peptide
in the thymus causes an increase in the CD4+CD25+ T
reg
cell population [3,29], it is unclear how the TCRβ-chain
regulates Treg cells. We examined TCR-β expression in
thymic Treg cell development. Cells in these transition
stages begin to express TCR genes. We found that
CD4+CD8-CD25+CD44+ cells expressed higher levels of
TCR-β than did CD4+CD8-CD25+CD44- cells (Figure 2B),
and that CD44high T
reg cells from the thymus displayed
higher levels of TCR-β than did CD44med or CD44low cells.
Almost 100% of CD44high T
reg cells expressed the TCR-β
-chain, whereas the frequency of TCR-β-expressing cells
was significantly lower in Treg cells with reduced CD44
expression (Figure 2C). Thus, our data suggest that the
lev-els of TCR-β expression indicate the maturation status of
Treg cells and correlate with the suppressive function of Treg cells. It is possible that CD4+CD25+ T cells require
activa-tion via their TCR to differentiate into suppressive cells
[30]. Here, it should be mentioned that at the CD4 SP stage, thymocytes have already passed positive selection by virtue of TCR mediated signaling events. Nevertheless,
our data implies that ~60% of CD4 SP CD25+CD44- cells
do not express a TCR-β chain. It is not clear whether
TCR-β- cells might reflect a "spillover" from the double
nega-tive (DN) compartment and this possibility will be exam-ined in the future.
It is known that Foxp3 is a conserved transcription factor that programs the development and the suppressive
func-tion of CD4+CD25+ T
reg cells. However, less is known
about the Foxp3 expression pattern during thymocyte development. To address this issue, we examined the inter-relationship among the expression profiles of CD25, Foxp3, and CD44 and found several trends (Figure 3). Since CD4+CD8-CD44+ SP or CD4+CD8-CD44high SP cells
expressed high levels of Foxp3, our data suggest a positive correlation between Foxp3 expression and expression of
CD44 and the TCR-β-chain. Additional precursor progeny
studies are needed to further test/validate this hypothesis.
Because functional assays are critical parameters for
assessing Treg cell function, we used CD4, CD8, CD25, and
CD44 markers and the FACSAria sorter to carefully isolate T cell subsets from the spleens of naïve mice. In vitro T cell co-culture and RT-PCR assays indicated stronger suppres-sive function and higher mRNA levels of IL-10 in
CD4+CD8-CD25+CD44+ cells than in CD4+CD8
-CD25+CD44- cells (Figure 5). Because CD4+CD8
-CD25+CD44high cells displayed the highest suppressive
IL-10 neutralizing antibody reversed suppressive activities of
Treg cells
Figure 7
IL-10 neutralizing antibody reversed suppressive activities of Treg cells. (A) CD4+CD8-CD25+CD44+ and
CD4+CD8- CD25+CD44- cells were sorted from splenocytes
from C57BL/6 mice and cultured with naïve CD4+CD25- T
cells in the presence of anti-CD3/anti-CD28 for 72 h. In some cases, anti-IL-10 or isotype control Ab was added. Cell proliferation was measured by [3H]-thymidine incorporation.
Data are presented as counts for min, and shown are the mean ± S.D. from three independent experiments (** p < 0.01, *** p < 0.001). (B) Splenocytes from naïve mice were treated with either the IL-10 neutralizing antibodies or an isotype control (rat IgG1) in the presence or absence of Con A (5 μg/ml) for 24 h. Cells were stained with antibodies against CD4, CD8, CD25, CD44, and Foxp3 and analyzed by flow cytometry. (C) CD4+CD25high cells were sorted from
splenocytes of C57BL/6 mice and cultured with anti-IL-10 or isotype control Abs for 24 h. Cells were stained with anti-bodies against Foxp3 and CD4 and analyzed by flow cytome-try. Data are presented as the percentage of total
splenocytes and shown are representative results of one of four independent experiments.
Naïve T cells CD4+CD25+cells
Anti-IL-10
- - CD44-CD44-CD44-CD44+ CD44+CD44+
- + - - + - - +
Isotype - - - + - - + -+ -+ -+ -+ -+ -+ -+ -+
T
h
ym
idi
n
e i
n
corporati
on
(cpm
x 1000)
**
** ***
**
0 4 8 12 16 18
A
Foxp3
IL-10 block Medium
CD25
CD4
C
Rat IgG1
23 19 8
CD4
Foxp3
IL-10 block Medium
CD25
CD4
B
1.4
28 17.3
Rat IgG1
function and the highest mRNA levels of IL-10 (Figure 5E), we suggest that CD44 can be considered a
comple-mentary marker for the functional potential of Treg cells.
To further support this conclusion, we isolated four
sub-sets of CD4+ thymocytes and examined their IL-10 mRNA
levels via real-time RT-PCR analysis. We provided two
lines of evidence indicating the role of IL-10 in Treg
cell-mediated suppression. First, CD4+CD25+CD44+
Foxp3+cells expressed much higher levels of intracellular
IL-10 than did CD4+CD25+CD44- Foxp3+ cells (Figure 6).
Second, the addition of an IL-10 neutralizing antibody reversed this suppression (Figure 7A), and affected Foxp3 expression in the splenocytes (Figures 7B and 7C). Whether, IL-10 neutralizing antibody reversed this sup-pression through regulating Foxp3 exsup-pression is currently not known and will be explored in the future. One possi-bility exists that our cell population might contain IL-10 producing non-Foxp3+ T cells, so called Tr1-like cells, that
could cause reduction in Treg cell suppressive effect using
anti-IL-10 antibodies; however, this possibility seemed highly unlikely but will be examined in our future studies.
Our results suggest that the regulatory/suppressive poten-tial of these cells can be ranked in the following order: CD4+CD8-CD25+CD44+ cells > CD4+CD8-CD25+CD44
-cells > CD4+CD8-CD25-CD44+ cells. Thus, one would
pre-dict that naïve CD4+ T cells may have a higher possibility
to convert into Treg cells in the periphery than do their
counterparts. Additional experiments are warranted to test this possibility, because a better understanding of Treg cell conversion and acquisition has potential therapeutic util-ity for autoimmunutil-ity and transplantation.
In summary, we found two novel phenotypes of Treg cells
in the thymus. While both CD4+CD25+CD44+ and
CD4+CD25+CD44- cells display suppressive activities,
CD4+CD25+CD44high cells are the most potent T reg cells.
The expression levels of CD44 positively correlate with the expression of IL-10 and Foxp3, as well as with the reg-ulatory potential of Treg cells which suppresses T cell pro-liferation function by producing IL-10.
Competing interests
The authors declare that they have no competing interests.
Authors' contributions
TL and LS contributed equally to the design of the study and writing of the manuscript; TL performed the experi-ments and analyzed data; GL and RK participated in experimental design, data analysis, and manuscript prep-aration; AKC provided support for this research, contrib-uted in designing the study and manuscript writing and revisions, as well as in responding to reviewers' com-ments. All authors substantially contributed to the
redac-tion of the manuscript and have given final approval on the version to be published.
Reviewer's Comments
Reviewers' report 1 Dr. Lenardo
Liu et al., demonstrate CD44 as a new marker for Tregs in their manuscript entitled "The development of
CD4+CD25+CD44+ regulatory T cells in mouse thymus".
The authors have clearly shown that Foxp3 expression and enhanced suppressive activity of Tregs are associated with CD44 molecule. The authors have presented a concise report of their findings in a well-written manuscript and clearly presented data. They have also speculated that Tregs may develop from DN2 or DN3 stage T cells sepa-rately before development of naïve cells.
Authors' response: We were very pleased to read your supporting comments on our study and felt that your suggestions were very helpful in assisting us to improve the quality of the revised man-uscript. Based upon your suggestions, we have performed new experiments and presented these data in new Figures 6and 7.
In addition, we have addressed your specific comments point-by-point.
1) The authors have not shown any evidence with regards
to the Treg development other than CD25 and CD44 staining. Therefore, the title is misleading and changes the focus of the actual content of the paper i.e., CD44
corre-lates with Foxp3+ expression. There is no scientific
evi-dence presented in the paper, showing that Treg cells actually arise from DN3 or 2/DN3 cell stage cells. The pos-sibility that Treg cells could develop from DN4 cell stage cells by reacquiring CD44 and CD25 during negative selection and maturation processes has not been formally excluded. There is a school of thought that Treg cells escape negative selection even-though they have high affinity self-ligands. The authors should therefore address these points if they want to discuss about developmental aspects of Tregs in this paper. Otherwise, the authors should change the title of the manuscript and speculate the developmental aspects of Tregs only in the "discus-sion" section.
Authors' response: To address question 1, we have changed the title to "CD44 expression positively correlates with Foxp3 expression and suppressive function of CD4+T
reg cells", as sug-gested by the reviewer. We have also removed the original Fig-ure Seven from the revised manuscript and provided a brief discussion on the development of Treg cells in the revised discus-sion of the manuscript.
2) It is interesting that CD44 expression is coupled to the
previously that TGF-β and IL-10 are not necessary for in
vitro suppression. Therefore, if authors claim CD44
expression positively correlates with higher suppression and these suppressive cytokines, the authors should dem-onstrate if CD44 high subset of Tregs suppress predomi-nantly by these suppressive cytokines. It would be interesting to test whether the suppressive activity of
CD44+ subset is blocked by neutralizing these cytokines. It
is possible that CD44- subset and CD44+ subset of CD25+
Tregs suppress in different manner, which is why one
can-not abrogate suppression by neutralizing TGF-β and IL-10
in cultures with both the subsets so far.
Authors' response: To address question 2, our new data showed that suppressive function of CD4 Treg cells on T cell proliferation could be reversed by neutralizing anti-IL-10 antibodies (Figure
7A). Further, our data provided evidence that IL-10 might reg-ulate suppression of T cell proliferation function by modulating Foxp3 (Figure 7B).
Reviewers' report 2
Dr Klein & Dr Wirnsberger (nominated by Dr JC Zungia-Pfluker)
The manuscript "CD44 expression positively correlates
with Foxp3 expression and suppressive function of CD4+
Treg cells" by Liu et al. proposes a subdivision of thymic and splenic Treg into populations characterized by differ-ent levels of CD44 expression. Although the revised ms deals with the functional properties of these subpopula-tions rather than focusing on developmental aspects of Treg cell biology, several major concerns remain as to the characterization of these cells and the interpretation of the reported experiments. Because the focus of the ms has profoundly changed, we have looked at it as if it were a first submission.
1) Introduction: "...the surface expression of CD44 in mouse thymocytes preceded that of Foxp3" - this statement implies a direct precursor/progeny relationship between the described subpopulations and "mature" Treg that is not experimentally addressed at all in this manuscript.
Authors' response: Since our data indicated that CD44 expres-sion positively correlated with Foxp3 expresexpres-sion, we have revised this line in the introduction to correctly reflect our data.
2) Figure 1: The authors claim that "...location and sequence of Treg development remain unclear." Significant progress has been made in terms of a delineation of critical events during the earliest phase(s) of Treg differentiation and also in terms of the localization of their differentiation, which are not referenced here (Lio et al., 2008, Lee et al., 2009, Fontenot et al., 2005).
The following characterization of thymocyte subpopula-tions is based upon CD4/8/25/44 staining. Although the authors avoid calling these populations Treg at that point, the subsequent experiments are done using this staining scheme and cells are referred to as "thymic Treg cells" later on. The only specific Treg marker to date is Foxp3, hence - especially given the already reported heterogeneity of
CD4 SP CD25+ cells - Foxp3 staining would be essential
for these types of analyses.
Authors' response: As suggested by the reviewer, we have added the following references: Lio et al., 2008, Lee et al., 2009, Fon-tenot et al., 2005 in the revised manuscript. In addition, we have performed new experiments and added data showing
"Foxp3 expression in CD4+CD8-CD25+CD44+and
CD4+CD8-CD25+CD44-cells (see new Figure 1C).
3) Figure 2: At the CD4 SP stage, thymocytes have already
passed positive selection by virtue of TCR mediated sign-aling events. Additionally, as stated in the introduction, Treg differentiation is thought to rely on thymic antigen encounter/TCR signaling. Nevertheless, Figure 2 implies that ~60% of CD4 SP CD25+CD44- ("Treg") cells do not
express a TCR-β chain. This discrepancy is not discussed in
the manuscript at all and might reflect a "spillover" from the DN compartment.
Authors' response: We agree with the reviewer that our original Figure 2was not very clear and that it may cause some confu-sion. The revised Figure 2now only focuses on TCR-β expression among CD4+CD25+CD44-and CD4+CD25+CD44+SP cells.
We have expanded the discussion section and included reviewer's point in this section.
4) Figure 3: The authors also claim to detect both different
percentages of TCR-β+ cells and different levels of TCR-β
expression among the described populations. Staining
showing different levels of TCR-β expression among the
described subsets are not provided, however. The sugges-tion that "...CD4+CD25+CD44+cells represent a more mature
subset of Treg cells..." based upon the presented staining (lacking Foxp3 staining) and lacking any experiments pro-viding evidence for a precursor/progeny relationship is daring.
Authors' response: We think that the reviewer meant Figure
2and not Figure 3. We found that CD4+CD25+CD44+cells
expressed the highest level TCR-β in thymocytes. So we believe that CD4+CD25+CD44+cells were more mature T cells. We
meant mature T cells and not Treg cells.
5) Data in Figure 3 show that essentially all Foxp3+ cells
are also CD44+/high, but that only a "small" fraction of
CD4+CD25+CD44+ cells - as classified by the authors - are
of the results and interpretation of Figure 1 and 2. The results presented also argue for a relatively low percentage
of CD25+/high cells being Foxp3+, which is not consistent
with the literature on Foxp3+ cells in the (adult) thymus
(Fontenot et al., 2005).
Authors' response: We appreciate for reviewer's insightful com-ments. In more than 10 independent repeats, we sometimes detected higher frequencies and sometimes lower frequencies of Foxp3+cells. To confirm the trends, we carefully performed
additional experiments. After careful reviewing all of our data, especially the new data, we decided to present a revised Figure
3, showing our new data. This is not to say that the old data were wrong, since it is a cellular staining, Foxp3 expression var-ied in different samples. Importantly, however, the rate of Foxp3 expression in CD44+and CD44-subset was similar in all
of the data analyzed.
6) Figure 4: The authors claim to have done a "functional assessment of Treg cell subsets in mouse thymus and spleen."
The data presented only show the suppressive activity of splenocytes. (For thymocytes: only Real Time PCR data are provided). The differences in suppressive potency (Fig-ure 4A) are very modest. Additionally the authors show, that the described populations differ in their TGF-beta and IL-10 mRNA expression levels. The differences are modest and probably not too informative, however.
Authors' response: The only ways to show "functional assess-ment of Treg cell subsets in mouse thymus and spleen" are by RT-PCR, real Time RT-PCR and intercellular staining, and we obtained similar results with these different assays. Our exper-iments were limited by cell sorting conditions, as we could not sort enough of CD44 Treg cells, which influenced our results. However, we have provided new data in which Treg: effector cells were used in a ratio of 1:2, and the suppressive potency was impressive (new Figure 5A).
7) Figures 4 and 5 are redundant. It might not be
neces-sary to show Figure 4 at all. RT PCR (Figure 5) and Real-time data (Figure 6A) are redundant. Assessing cytokine mRNA expression levels does not allow any statements on the suppressive potential of thymocyte populations (6B).
Authors' response: We agree that the original Figures 4and
5are redundant and have deleted Figure 5. We feel that Figure
6Bcan help readers understand cytokine expression of Treg cells in the thymus, and have decided to have new Figures 5Eand
5F.
8) Figure 7: The authors claim that "CD44 Treg cells pro-duce IL-10 and TGF-beta cytokines that suppress T cell prolif-eration". The expression of TGF-beta by the described populations is not shown, however. Data on a role for
TGF-beta in in vitro suppression assays is also not
pro-vided.
Authors' response: We could not detect TGF-beta expression in both CD44+and CD44- cells with flow cytometry assay and the
beta mRNA data were modest. We decided to delete TGF-beta data and to focus on IL-10 in Treg cells in later experi-ments.
9) Figure 8B: involvement of IL-10 in direct regulation of
Foxp3 expression seems to be problematic. Studies on a role of IL-10 and TGF-beta in Treg cell induction/homeos-tasis and suppressor function (Li and Flavell 2008, amongst many others) and a possible role for CD44 and Foxp3+ cells can - via intracellular staining - be visualized
as a distinct population among CD4+ cells. The CD4/
Foxp3 plots in Figure 8B do not really allow for gating on
Foxp3+ cells. Due to the experimental setup and the lack
of "resolution" provided by the Foxp3 staining shown an interpretation suggesting an low/high molecular weight hyaluronic-acid in Treg function (Bollyky et al., 2007) have been reported elsewhere and are not sufficiently ref-erenced in this section.
In aggregate, this manuscript provides some insights into how Treg can be subdivided into subpopulations differing in their suppressive potency based upon the expression of the hyaluronic-acid receptor CD44. However, the con-cerns mentioned above should be addressed in order to clarify the validity of the given interpretations and conclu-sions. We hope that these comments are helpful to improve the quality of this manuscript.
Authors' response: In this study, we have used IL-10 anti-body to block IL-10 in splenocytes, and we found that IL-10 induced Foxp3 expression was decreased. Furthermore, we sorted CD4CD25highcells from spleen of C57BL/6 mice,
cul-tured themwith anti-IL-10 or rat IgG1 antibody for 24 hours, and analyzed data by Flow cytometry (revised Figure 7C). We found IL-10 induced Foxp3 expression was decreased in CD4CD25highcells after blocking this cytokine with IL-10
neu-tralizing antibody. These results suggest that Treg cell suppres-sive effect on T cell proliferation could be reversed by IL-10 blocking antibody through regulation of the Foxp3 expression.
Finally, we have added Li, Ming O and Richard A Flavell 2008 reference and that of Bollyky et al. 2007 in the revised manu-script
Reviewers' report 3 Dr Shevach
numerous issues remain to be resolved with this manu-script:
1) The authors now accept that Foxp3 is the marker for
Treg in the mouse, yet the data presented in figures 1, 2, 3 add absolutely nothing to our understanding of the
devel-opment of Foxp3+ T cells in the thymus. Although they
appear to perform competent staining, the level of Foxp3
expressing cells even in the CD44high pool is only 20%. It
is not clear what new information is conveyed in these fig-ures.
Authors' response: Although much is known about T cell devel-opment in the thymus, there is limited information on Treg cell
markers in the thymus. Figure 1showsCD4+CD8
-CD25+CD44+and CD4+CD8-CD25+CD44-cells in thymus,
and Foxp3 expression in CD4+CD8-CD25+CD44+and
CD4+CD8-CD25+CD44-cells. Figure 2shows that TCR-β locus
plays an important role in the development of T cells. We com-pared the expression of TCR-β in both CD4+CD25+CD44+and
CD4+CD25+CD44- cells, and found that
CD4+CD25+CD44+cells are mature cells. Our data in Figure
3show that Foxp3 is positively correlated with CD44. Based on our new data, we have revised Figure 3.
2) The authors need to quantitate by intracellular staining
the percentage of Foxp3 expressing cells in each of their so-called Treg populations in figure 4. As pointed out in my previous review, the magnitude of suppression in this figure is not great (compared to other published studies)
and the differences between the CD44+ and the CD44
-populations could easily be accounted by minor
differ-ences in percentage of Foxp3+ T cells. The same criticism
applies to the data in figure 5.
Authors' response: We have quantitated by intracellular stain-ing, the percentage of Foxp3 expressing cells in splenocytes (Fig-ure 4). Our experiments were limited by cell sorting conditions, as we could not get sufficient numbers of CD44 Treg cells. How-ever, we have provided new data in which Treg: effector cells were used in a ratio of 1:2, and the suppressive potency was impressive (new Figure 5A).
3) The authors rely heavily on PCR data in figure 6. As
suppression requires TCR activation, they need to stimu-late the populations to determine how much of these cytokines they are capable of producing. Elisa assays and intracellular staining are needed. MOST IMPORTANTLY, they need to do simultaneous staining for IL-10 and Foxp3. We agree that this it is difficult to analyze TGF-beta by IC staining.
Authors' response: We have performed this study in Figure 6.
The most critical step for detection of intracellular accumula-tion of cytokines by intracellular staining is activaaccumula-tion of a cell
population to induce production of cytokines of interest. We used Con A as an activator to co-culture with GolgiPlug in the medium. There was no IL-10 expression in control cells which were not activated by Con A.
4) The same criticism holds for the data in figure 7. Are the
cells that stain for IL-10 Foxp3+? CD44 and CD25 are
sur-rogate markers that mean little.
Authors' response: Yes, we have added data on IL-10 levels in
CD4+CD8-CD25+CD44+Foxp3+and CD4+CD8
-CD25+CD44-Foxp3+cells in the revised Figures 6Band 6D.
5) The suppression data in figure 8 lacks an important
control. The authors need to add the anti-IL-10 to the naïve T cells alone. Anti-IL-10 will frequently increase the response of this population as well. In general, anti-CD28 reverses suppression in the mouse model and it is very dif-ficult to suppress mouse T cell activation in the presence of anti-CD28 (the authors might review some of the papers published years ago which address this point). It is unclear why the authors see a reversal of suppression with
anti-IL-10 as other groups using highly purified Foxp3+ T
cells have not seen this. There seems to be no difference in the susceptibility of the high versus the low population to anti-IL-10 reversal, so one would assume that their data should not differ from the published data using Tregs that are not fractionated based on CD44 expression. One pos-sibility is that the cell populations contain IL-10 produc-ing non-Foxp3+ T cells, so called Tr1-like cells.
Authors' response: Anti-IL-10 with naïve T cell data have been added (only anti-CD3 and not anti-CD28 in the medium) as a control. We have sorted CD4CD25highcells from spleen of
C57BL/6 mice and cultured them with anti-IL-10 or Rat IgG1 for 24 hours, and analyzed by Flow cytometry (revised Figure
7C). Our data clearly and very reproducibly indicated that
anti-IL-10 antibodies reversed the suppressive ability of Treg cells. Therefore, we are convinced that our data is accurate. However, it is possible that the Foxp3+cells isolated from
trans-genic mice might behave differently compared to Foxp3+ cells
from normal mice. The reviewer brought up an interesting point regarding Tr1-like cells. We have added this statement in the revised manuscript to cover all points.
6) a) Panel B of figure 8 is simply fantasy. I see no
physi-ologic relevance to studying an unseparated population of thymocytes and splenocytes. b) Why do the authors add Con A? IL-10 deficient mice have normal numbers of
Foxp3+ T cells. c) Why is there a difference between the
medium control and the control IgG? d) This study needs
to be performed with purified Foxp3+ cells from thymus