R E S E A R C H
Open Access
Correlation between reduction of superior
interventricular groove epicardial fat thickness
and improvement of insulin resistance after
weight loss in obese men
Kae-Woei Liang
1,2,3,4*, I-Chen Tsai
2,5,6,7, Wen-Jane Lee
8,9, Shih-Yi Lin
2,10, Wen-Lieng Lee
1,2, I-Te Lee
2,3,10,
Chia-Po Fu
2,3,10, Jun-Sing Wang
2,10and Wayne H-H Sheu
2,3,10,11,12*Abstract
Background:It has been recognized that reduction of abdominal visceral fat and subcutaneous fat are associated with improvement in insulin-resistance (IR) after weight loss. However, few studies have investigated the correlation of reduction in epicardial adipose tissue (EAT) with improvement of IR index after weight loss in obese non-diabetic men with metabolic syndrome (MetS).
Methods and results:We prospectively enrolled 32 non-diabetic men with MetS for a 3-month weight reduction program mainly by diet control and exercise. Magnetic resonance imaging (MRI) examinations were used to measure EAT, subcutaneous fat, and abdominal visceral fat. Anthropometric parameters, oral glucose tolerance test (OGTT), and serum adipokines were assessed before and after the weight loss program. After a 3-month weight loss program, 27 obese MetS men had significant weight loss >5% (97 ± 14 to 87 ± 14 kg, with a 10.7 % decrease, p < 0.001). Multivariate analysis revealed that the decrement ratio of superior interventricular groove (SIVG) EAT thickness (r= 0.322, p = 0.044) and serum leptin (r= 0.626, p < 0.001) significantly correlated with the percentage improvements of fasting HOMA-IR index. Furthermore, the decrement ratio of SIVG EAT thickness (r=−0.370, p = 0.017) and decrement ratio of subcutaneous fat area (r=−0.673, p = 0.006) were significantly correlated with improvement of OGTT-derived Matsuda insulin-sensitivity index.
Conclusions: The decrement ratio of SIVG EAT correlated with improvement of both HOMA-IR and OGTT-derived Matsuda insulin-sensitivity indexes after weight loss in obese non-diabetic men with MetS.
Clinical trial registration:(Multi-faceted Evaluations Following Weight Reduction in Subjects with Metabolic Syndrome NCT 01065753 on Feb 8, 2010).
Keywords:Epicardial adipose tissue, Insulin resistance, Leptin, Matsuda index, Metabolic syndrome, Obesity
Introduction
The core pathogenesis of metabolic syndrome (MetS) is related to obesity and insulin resistance (IR) [1]. MetS is associated with a higher incidence of cardiovascular dis-eases and events, and increased cardiovascular mortality
[2-5]. We and others have demonstrated that victims of MetS manifest a pro-thrombotic and pro-inflammatory state [6-8]. Even in subjects without type 2 diabetes mel-litus, MetS alone still carries a 1.6-fold increased risk of myocardial infarction and a 1.8-fold increased risk of cardiovascular mortality [5].
Epicardial adipose tissue (EAT) is a part of visceral fat deposited around the heart between the pericardium and myocardium [9]. The distribution of EAT is asymmetric and mostly localizes at perivascular, interventricular, and atrioventricular grooves [10,11]. Animal study showed * Correspondence:[email protected];[email protected]
1Cardiovascular Center, Taichung Veterans General Hospital, No.1650
Section 4, Taiwan Boulevard, Taichung 40705, Taiwan
2Cardiovascular Research Center, Department of Radiology and Department
of Medicine, National Yang Ming University School of Medicine, Taipei, Taiwan
Full list of author information is available at the end of the article
that the rate of insulin induced lipogenesis was signifi-cantly higher in EAT compared with other fat depots [12]. In addition to storing lipids, it also produces inflammatory cytokines and adipokines [9,13,14]. Measurements of EAT by computed tomography (CT) or echocardiogram have been used for predicting components of MetS or coronary atherosclerosis severity [15-18]. Some studies have ad-dressed the possible mechanism of EAT in coronary ath-erosclerosis, such as an increase of local EAT leptin [19] and inflammatory cytokine secretion [13], or a decrease of adiponectin production [14], which might directly be dif-fused into adjacent coronary circulation and influence ath-erosclerosis [10]. In fact, it has been shown that leptin expression was higher in EAT obtained from subjects with MetS or coronary heart disease [19,20]. However, whether total EAT volume [16,21], average EAT thickness [22] or regional EAT thickness [15,18] better predicts coronary atherosclerosis or MetS is still under debate and whether there is a regional specific EAT difference in atherogenesis is still inconclusive [10]. Recently, we reported that differ-ences in right atrio-ventricular groove EAT thickness can help differentiate the inflammatory status of obese non-diabetic men with MetS [23].
Weight loss improves IR, decreases circulating leptin and increases adiponectin in obesity or MetS [24-26]. There have been inconsistent reports whether reduction of abdominal visceral fat or subcutaneous fat is better correlated with the improvement of IR after weight loss [27-31]. In addition, few studies have investigated the correlations of reductions of regional EAT with improve-ment of IR after weight loss in obesity or MetS. More-over, alterations of circulating adipokine change and improvement of IR following weight loss in obese non-diabetic men with MetS was largely unexplored. The aims of this study were to elucidate the correlations of regional EAT thickness changes by magnetic resonance imaging (MRI) with improvement of IR and changes in adipokines after weight loss in obese non-diabetic men with MetS.
Methods
Study subjects
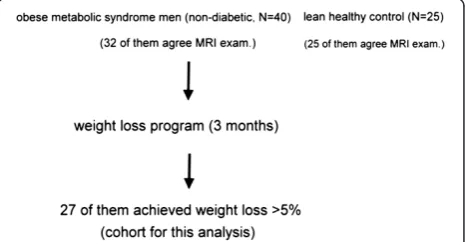
We prospectively enrolled 40 men in total, who were di-agnosed with MetS using the ATP-III criteria, from out-patient clinics at Taichung Veterans General Hospital (Taichung, Taiwan) in April to September 2008 (Figure 1). Parts of the results have been published previously [23,25,26]. In brief, the study enrollment criteria included central obesity, which was defined as waist
circumfer-ence ≥90 cm, in addition to at least two other ATP-III
MetS criteria [32]. Patients with diabetes mellitus requir-ing oral anti-diabetic agents or insulin shots were ex-cluded from the study. The patients undertook a 3-month weight reduction program. The dietitian instructed the
study subjects to consume a 1200 Kcal diet per day comprising 55% carbohydrate, 30% fat, and 15% protein. Patients were educated how to estimate the calories and nutritional components per unit amount of food [25,33,34]. They all received an instruction brochure, which stated all the nutritional facts and calories per unit amount of food for instant check. The patients were asked to keep a very detailed record of each meal. A dietitian would estimate the calories based on the record in order to keep the daily requirement of 1200Kcal per day. In addition, the dietitian closely followed them with phone-call consultations. We encouraged peer competition for weight loss and showed weight and waist circumfer-ence changes in bar graphs at each gathering, which was held once every week in the first month, then bi-weekly in the 2nd and 3rd month. The patients were encouraged to have at least two to three light physical exercise periods per week. We provided a 60-minute fitness program with a physical trainer at the biweekly gatherings. The study subjects underwent anthropo-metric data check and blood sampling again at the 3rd, 12th and 18th month after the beginning of weight loss program and then every 24 months thereafter if they are compliant with our recalls. Thirty-two of the obese non-diabetic men with MetS agreed undergoing MRI examination for measurement of subcutaneous fat, abdominal visceral fat, and EAT before and after weight loss (Figure 1). All subjects provided written informed consent. The authors confirm that all ongoing and re-lated trials for this study/intervention are registered. The study protocol was approved by the Human Research Ethics Review Committee of Taichung Veterans General Hospital (Taichung, Taiwan). The protocol and case enrollment were conducted after getting the ethics committee approval; however, the registration at www. clinicaltrials.gov (Multi-faceted Evaluations Following Weight Reduction in Subjects with Metabolic Syndrome NCT 01065753) was delayed till Feb 8, 2010 because clin-ical trial registration was not compulsory in our country back then.
Biochemical analysis
All obese MetS subjects underwent blood tests and oral glucose tolerance test (OGTT) after an overnight fast to ex-clude those with unknown diabetes. After a fasting blood sample was collected, glucose load of 75 g was ingested over 5 minutes. Blood samples were collected at 30 minutes, 60 minutes, 90 minutes, and 120 minutes after the test load. Blood glucose and insulin concentrations were mea-sured in each sample. Serum insulin was determined by a commercially available assay kit (IMMULITE, I-2000, EURO/Diagnostic Products Corporation, Gwynedd, UK). The inter- and intra-assay coefficients of variation for
insulin (range 10.7 to 439 μU/ml) were 4.3% and 5.4%,
respectively. Insulin-resistance was estimated using the homeostasis model assessment of IR (HOMA-IR), defined
as fasting glucose mg/dl × fasting insulin μU/mL/405
[35,36]. OGTT-derived Matsuda insulin-sensitivity index (ISI) was defined as 10,000/sqrt [fasting glucose (mM) ×
fasting insulin (μU/mL) × mean glucose during OGTT
(mM) × mean insulin during OGTT (μU/mL)] [37].
OGTT glucose and insulin areas under the curve (AUC) were defined as areas under the curve for glucose and in-sulin vs. time during the OGTT, respectively [8]. Serum hs-CRP was determined by particle-enhanced immuno-turbidimetry (Latex microparticles sensitized with duck anti-CRP IgY kit, provided by Good Biotech Corp., Taichung, Taiwan). The intra- and inter-assay coefficients of variance were 1.4% and 1.42%, respectively [8]. Serum monocyte chemotactic protein (MCP)-1 was determined by enzyme-linked immunosorbent assays (R&D Systems, Inc., Minneapolis, MN, USA) [38,39]. The intra- and inter-assay coefficients of variation for MCP-1 were 5.80% and 5.70%, respectively, with a minimum detectable con-centration of <5.0 pg/mL.
Measurement of circulating adipokines
Serum adiponectin, leptin, and plasma plasminogen activa-tor inhibiactiva-tor (PAI)-1 concentrations were determined by enzyme-linked immunosorbent assays (R&D Systems, Inc., Minneapolis, MN, USA). The intra-assay and inter-assay coefficients of variation of PAI-1 were 6.73% and 7.33%, re-spectively, with a minimum detectable concentration of 0.014-0.142 ng/mL. The intra- and inter-assay coefficients of variation for adiponectin were 3.53% and 6.50%, respect-ively, with a minimum detectable concentration of 0.079-0.891 ng/mL. The intra- and inter-assay coefficients of variation for leptin were 3.17% and 4.37%, respectively, with a minimum detectable concentration of <7.8 pg/mL.
MRI examination for subcutaneous fat, abdominal visceral fat, and EAT
Subcutaneous fat and abdominal visceral fat areas were quantified using MRI. Data were acquired using a 1.5 T whole body Siemens Sonata system (Siemens Medical
Systems, Erlangen, Germany) using the body coil. For the quantification of abdominal fat, one axial slice of the abdomen was obtained at the level of umbilicus. The scan parameters used were TR =209 ms, TE =4.1 ms, slice thickness =10 mm, and flip angle =70°. The field of view was 400 mm with an in-plane image resolution of 2.4 mm × 1.6 mm [40]. Areas of abdominal visceral fat and subcuta-neous fat (millimeters squared) were measured on the computer screen using a track-ball [41]. All measurements were analyzed by a single radiologist who was blinded to the metabolic status of the study subjects.
For EAT measurement, electrocardiogram-gated cine im-ages were acquired with a dedicated 4-element, phased array cardiac coil, using a segmented steady-state free precession [fast imaging with steady-state precession (TrueFISP)] sequence (time to echo/time of repetition 1.6/3.2 ms, temporal resolution 35 ms, in-plane spatial resolution 1.4*1.8 mm, slice thickness 5 mm, inter-slice gap 5 mm). The measurements were done in end-diastolic phase on horizontal long-axis plane and basal short-axis plane (at the level of the end of papillary muscles). Fat thickness in right atrioventricular groove, left atrioventricular groove, and anterior interventricular groove were measured on horizontal long-axis plane; fat thickness in superior inter-ventricular groove, inferior interinter-ventricular groove and right ventricular free wall were measured on basal short-axis plane, as described in our previous studies and by other investigators [15,23,26,42].
Statistical analysis
Continuous variables are expressed as mean ± S.D. Dif-ferences in continuous variables before and after weight loss in obese MetS subjects were compared by the paired Student’s t test. Univariate correlation analysis between percentage changes of HOMA-IR or ISI-Matsuda after weight loss vs. percentage changes of obesity-associated inflammatory markers, adipokines, and MRI-measured fat index in obese MetS were analyzed using Pearson correlation analysis. Multivariate linear regression analysis was performed to investigate the independent variables correlated with percentage changes of HOMA-IR or ISI-Matsuda after weight loss. The SPSS 17.0 statistical soft-ware package (SPSS, Inc., Chicago, IL, USA) was used for all calculations. A two-tailed p value less than 0.05 was considered statistically significant.
Results
Changes in anthropometric, serum or plasma biochemical data, and adipokines after weight loss
glucose or insulin AUC changed significantly after weight loss (Table 1). Lipid profiles improved and inflammatory markers such as MCP-1 declined after weight loss (Table 1). In terms of circulating adipokines, the obese non-diabetic men had significantly lower values of PAI-1 after weight loss. There were non-significant changes of adiponectin and leptin levels after weight loss (Table 1).
Changes of MRI measured subcutaneous fat, abdominal visceral fat, and regional thickness of EAT in obese non-diabetic men with MetS after weight loss
Significant reductions of subcutaneous fat and abdom-inal visceral fat areas as well as decreases of regional EAT thickness were detected in the 27 obese men who achieved significant weight loss (all p < 0.001) (Table 2).
Univariate correlation analysis of percentage changes in HOMA-IR index with obesity-associated inflammatory markers, adipokines, and MRI-measured fat index after weight loss
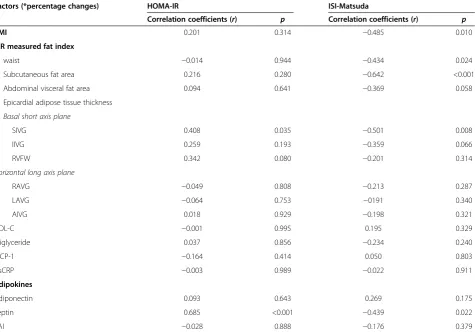
The percentage improvements in HOMA- IR index after weight loss were significantly correlated with the
MRI-measured decrement ratio of superior interventricular
groove (SIVG) EAT thickness (r =0.408, p = 0.035), but
not with the subcutaneous fat or abdominal visceral fat changes (Table 3). Moreover, the percentage improvement of HOMA-IR index was also significantly correlated with decrement ratio of secretory leptin after weight loss (r= 0.685, p < 0.001) (Table 3).
Univariate correlation analysis of percentage changes in OGTT-derived Matsuda insulin-sensitivity index with obesity-associated inflammatory markers, adipokines, and MRI-measured fat index after weight loss
The percentage improvements of OGTT-derived Matsuda ISI were significantly correlated with MRI-measured decre-ment ratio of SIVG EAT thickness (r=−0.501, p = 0.008) as well as with the subcutaneous fat (r=−0.642, p < 0.001), but not with abdominal visceral fat changes after weight loss (Table 3). Moreover, the percentage improvement of OGTT-derived Matsuda ISI was also significantly corre-lated with decrement ratio of secretory leptin after weight loss (r=−0.439, p = 0.022) (Table 3). In a separate analysis, the decrement ratio of SIVG EAT also correlated well with
Table 1 Changes of anthropometric, serum or plasma biochemical data and adipokines in obese non-diabetic men with metabolic syndrome with weight loss >5% (N = 27) by diet and exercise program
Before (N = 27) After (N = 27) *Percentage of changes P value
Body weight (kg) 97 ± 14 87 ± 14 −10.7% <0.001
BMI (kg/m2) 33.5 ± 4.1 29.9 ± 4.2 −10.6% <0.001
Fasting glucose (mg/dl) 103 ± 15 97 ± 10 −5.7% 0.002
Fasting insulin (μIU/ml) 18.6 ± 12.1 13.0 ± 7.3 −25.8% 0.005
HOMA-IR (mg/dl ×μIU/ml) 4.8 ± 3.2 3.1 ± 1.7 −29.5% 0.003
OGTT glucose AUC (mg/dl × h) 367 ± 79 324 ± 55 −9.8% <0.001
OGTT insulin AUC (μIU/ml × h) 200 ± 99 148 ± 75 −21.1% 0.002
OGTT derived insulin-sensitivity index, Matsuda (mM ×μIU/ml)−1 40.6 ± 16.6 64.6 ± 31.2 69.7% <0.001
Total cholesterol (mg/dl) 204 ± 51 187 ± 35 −7.2% 0.011
HDL-C (mg/dl) 40 ± 9 44 ± 10 11.2% 0.021
Triglyceride (mg/dl) 295 ± 515 174 ± 294 −36.6% 0.012
MCP-1 (pg/ml) 277 ± 88 215 ± 66 −19.5% <0.001
Hs-CRP (mg/dL) 0.29 ± 0.41 0.14 ± 0.11 −19.3% 0.061
Adipokines
Adiponectin (ng/ml) 3197 ± 1803 3377 ± 2140 35.5% 0.431
Leptin (pg/ml) 16034 ± 9932 11673 ± 11362 −21.2% 0.067
PAI-1 (ng/ml) 18.4 ± 8.2 9.7 ± 4.9 −37.0% <0.001
BMI (kg/m2
): body mass index = body weight (kg)/height2
(m). HDL-C: high-density-lipoprotein cholesterol.
HOMA-IR: homeostasis model assessment (HOMA) index of insulin resistance = (fasting glucose mg/dl × fasting insulinμU/mL)/405. MCP-1: monocyte chemotactic protein-1.
MetS: metabolic syndrome.
OGTT glucose AUC: oral glucose tolerance test, area under the curve for glucose. OGTT insulin AUC: oral glucose tolerance test, area under the curve for insulin.
OGTT insulin-sensitivity index (Matsuda): 10,000⁄sqrt (FBG × FPI × G × I) where FPG is fasting glucose (mM), FPI is fasting insulin (μIU/ml), G is mean glucose (mM), I is mean insulin (μIU/ml) during the OGTT.
PAI-1: plasminogen activator inhibitor-1.
the decrement ratio of OGTT glucose AUC (r=0.520, p = 0.005). The correlation between decrement ratio of SIVG EAT and the decrement ratio of OGTT insulin AUC was fair but not reaching statistical significance
(r =0.327, p = 0.095). Moreover, there was no
correl-ation between absolute difference of MR measured left
ventricular ejection fraction vs. HOMA-IR (r=−0.035,
p = 0.863) or OGTT-derived Matsuda ISI (r =0.067, p =
0.742) changes after weight loss.
Multivariate linear regression analysis of independent variables correlated with percentage changes of HOMA-IR index in obese non-diabetic men with MetS after weight loss
In a multivariate linear regression analysis, the decrement ratio of circulating leptin and SIVG EAT were independ-ent variables correlated with improvemindepend-ents of HOMA-IR index after weight loss, while changes in subcutaneous or abdominal visceral fat were not (Table 4).
Multivariate linear regression analysis of independent variables correlated with percentage changes of Matsuda insulin-sensitivity index in obese non-diabetic men with MetS after weight loss
In a multivariate linear regression analysis, the decrement ratio of SIVG EAT thickness (r=−0.370, p = 0.017) and subcutaneous fat area (r=−0.673, p = 0.006) were inde-pendent variables correlated with the increment ratio of OGTT-derived Matsuda ISI after weight loss (Table 5).
Discussion
The results of this study demonstrated that the decre-ment ratio of SIVG EAT correlated with improvedecre-ment of
both HOMA-IR and OGTT-derived Matsuda insulin-sensitivity indexes after weight loss in obese non-diabetic men with MetS. In this study, we applied a weight loss intervention to investigate its impact on changes of insulresistance in non-diabetic obese men and extended the in-vestigation parameters beyond subcutaneous or abdominal visceral fat to regional EAT changes.
A previous report by Iacobellis et al. [43] showed that EAT thickness measured by echocardiogram over the right ventricle free wall was significantly correlated with IR index in obese subjects. Manco et al. [44] reported that MRI-measured EAT volume was a useful predictor for HOMA-IR in obese children. Our study further corrobo-rated the association of EAT with IR, and revealed a novel finding showing that MRI-measured regional SIVG EAT thickness change was independently associated with im-provement of IR after weight loss in obese non-diabetic men with MetS. Moreover, we used multiple IR indexes, including the HOMA-IR and Matsuda ISI to validate the association between SIVG EAT and IR changes.
EAT is metabolically active visceral fat that produces inflammatory cytokines and adipokines, including leptin [13,14,19]. Some studies have addressed the possible role of EAT in coronary atherosclerosis, such as an increase of local EAT leptin [19,20], and inflammatory cytokine secretion [13], or a decrease of adiponectin production [14], which might directly be diffused into adjacent cor-onary circulation and influence atherosclerosis. Subjects with MetS or coronary heart disease have been reported to have higher leptin expression in EAT [19,20]. Beyond the local production of leptin in EAT, there was also in-creased circulating leptin levels in obesity, metabolic syndrome, and IR state [25,45]. Weight loss decreased
Table 2 Changes of MRI measured subcutaneous fat, abdominal visceral fat, and regional thickness of epicardial adipose tissue in obese non-diabetic men with metabolic syndrome with weight loss >5% (N = 27)
Before (N = 27) After (N = 27) *Percentage of changes P value
Waist (cm) 122.6 ± 10.0 112.8 ± 11.4 −8% <0.001
Subcutaneous fat area (mm2) 34825 ± 10493 25005 ± 9146 −28% <0.001
Abdominal visceral fat area (mm2) 47469 ± 6344 41413 ± 7751 −13% <0.001
Epicardial adipose tissue thickness (mm)
Basal short axis plane
SIVG 10.0 ± 3.4 6.4 ± 2.2 −34% <0.001
IIVG 10.5 ± 4.7 6.3 ± 2.3 −31% <0.001
RVFW 6.8 ± 1.9 4.4 ± 1.3 −33% <0.001
Horizontal long axis plane
RAVG 16.7 ± 3.5 13.2 ± 2.3 −18% <0.001
LAVG 15.5 ± 3.8 10.3 ± 3.1 −32% <0.001
AIVG 9.2 ± 2.4 6.6 ± 1.5 −24% <0.001
AIVG: anterior interventricular groove; IIVG: inferior interventricular groove; LAVG: left atrioventricular groove; RAVG: right atrioventricular groove; RVFW: right ventricular free wall; SIVG: superior interventricular groove.
Table 3 Univariate correlation analysis of *percentage changes of fasting HOMA-IR and OGTT-derived insulin-sensitivity index (Matsuda) with *percentage changes of obesity-associated inflammatory markers, adipokines and MRI measured fat index (study subjects: 27 obese non-diabetic men with metabolic syndrome, with weight loss >5%)
Factors (*percentage changes) HOMA-IR ISI-Matsuda
Correlation coefficients (r) p Correlation coefficients (r) p
BMI 0.201 0.314 −0.485 0.010
MR measured fat index
waist −0.014 0.944 −0.434 0.024
Subcutaneous fat area 0.216 0.280 −0.642 <0.001
Abdominal visceral fat area 0.094 0.641 −0.369 0.058
Epicardial adipose tissue thickness
Basal short axis plane
SIVG 0.408 0.035 −0.501 0.008
IIVG 0.259 0.193 −0.359 0.066
RVFW 0.342 0.080 −0.201 0.314
Horizontal long axis plane
RAVG −0.049 0.808 −0.213 0.287
LAVG −0.064 0.753 −0191 0.340
AIVG 0.018 0.929 −0.198 0.321
HDL-C −0.001 0.995 0.195 0.329
Triglyceride 0.037 0.856 −0.234 0.240
MCP-1 −0.164 0.414 0.050 0.803
HsCRP −0.003 0.989 −0.022 0.911
Adipokines
Adiponectin 0.093 0.643 0.269 0.175
Leptin 0.685 <0.001 −0.439 0.022
PAI −0.028 0.888 −0.176 0.379
AIVG: anterior interventricular groove; BMI (kg/m2
): body mass index = body weight (kg)/height2
(m); HDL-C: high-density lipoprotein cholesterol; HOMA-IR: homeostasis model assessment of insulin resistance, defined as glucose mg/dl × insulinμU/mL/405; Hs-CRP: high sensitivity C-reactive protein; IIVG: inferior interventricular groove; LAVG: left atrioventricular groove; MCP-1: monocyte chemotactic protein-1; Oral glucose tolerance test (OGTT)-derived insulin-sensitivity index (ISI), Matsuda: 10,000/sqrt (FBG × FPI × G × I), where FPG is fasting glucose (mM), FPI is fasting insulin (μIU/ml), G is mean glucose (mM), I is mean insulin (μIU/ml) during the OGTT; PAI-1: plasminogen activator protein-1; RAVG: right atrioventricular groove; RVFW: right ventricular free wall; SIVG: superior interventricular groove.
*Percentage of changes = (after - before)/before weight loss.
Table 4 Multivariate linear regression analysis of variables related with percentage of changes of HOMA-IR index in obese non-diabetic men with metabolic syndrome after weight loss >5% (N = 27)
Predictor (*percentage of changes) Standardized
coefficientβ p
Subcutaneous fat area 0.090 0.609
Abdominal visceral fat area −0.148 0.408
SIVG EAT thickness 0.322 0.044
Leptin 0.626 <0.001
Dependent variable: percentage changes of HOMA-IR. EAT: epicardial adipose tissue.
SIVG: superior interventricular groove.
HOMA-IR: homeostasis model assessment (HOMA) of insulin resistance = (fasting glucose mg/dl × fasting insulinμU/mL)/405.
*Percentage of changes = (after - before)/before weight loss.
Table 5 Multivariate linear regression analysis of variables related with percentage of changes of OGTT-derived insulin-sensitivity Matsuda index, in obese non-diabetic men with metabolic syndrome with weight loss >5% (N = 27)
Predictor (*percentage of changes) Standardized coefficientβ
p
Body mass index 0.194 0.458
Subcutaneous fat area −0.673 0.006
Abdominal visceral fat area 0.030 0.877
SIVG EAT thickness −0.370 0.017
Leptin −0.269 0.065
Dependent variable: percentage changes of Matsuda index. EAT: epicardial adipose tissue.
SIVG: superior interventricular groove.
OGTT-derived insulin-sensitivity index (Matsuda): 10,000⁄sqrt (FBG × FPI × G × I) where FPG is fasting glucose (mM), FPI is fasting insulin (μIU/ml), G is mean glucose (mM), I is mean insulin (μIU/ml) during the OGTT.
circulating leptin and the changes of HOMA-IR related with changes of leptin after weight reduction in obese children [45-47]. Our study further confirmed that the decrement ratio of secretory leptin was independently associated with improvement of HOMA-IR after weight loss in obese non-diabetic men with MetS. In contrast, other adipokines such as, adiponectin or PAI-1 changes did not correlate well with improvement of HOMA-IR.
EAT surrounding the thin-walled coronary veins may exert greater systemic effects by diffusion of its small metabolically active molecules into the circulation [10,18]. The great cardiac vein traverses the anterior inter-ventricular groove and is embedded by a substantial amount of EAT. Given the amount of fat around and the presence of a lar-ger drainage territories of the anterior wall of the heart into the great cardiac vein, this may partly explain why only changes of EAT thickness in the SIVG was associated with the IR changes after weight loss in obese men with MetS [10,18].
In our study, the decrement ratio of subcutaneous fat rather than abdominal visceral fat correlated with im-provement of Matsuda ISI after weight loss in obese non-diabetic men with MetS. The decrement ratio of ab-dominal visceral fat was neither correlated with changes of HOMA-IR or ISI-Matusda after weight loss in this study. A previous report by Klein et al. [27] showed that liposuction of subcutaneous fat did not alter the insulin-sensitivity, or circulating hs-CRP or adiponectin in obese women. However, Kremen et al. [48] found that both sub-cutaneous and EAT were sources of pro-inflammatory cy-tokines in cardiac surgery patients and may contribute to the development of postoperative insulin resistance. An-other report analyzing local fat sample from subjects undergoing coronary bypass surgery showed that EAT produced more inflammatory molecules than subcutane-ous adipose tissue [13]. In addition, studies by Grundy et al. also showed that subcutaneous truncal fat played a major role in obesity-related insulin resistance in men, whereas intraperitoneal fat and retroperitoneal fat had a lesser role [30,31]. Kaess et al. [49] proposed visceral fat vs. subcutaneous fat ratio as a better correlate of cardio-metabolic risk, above and beyond BMI and visceral fat alone. These discrepancies may be caused by different eth-nic groups, gender, and the methods employed. Certainly, further studies are required to investigate the changes in subcutaneous or abdominal visceral fat with improvement of IR after weight reduction.
Whether different regional EAT or changes of EAT thickness participate in mechanisms leading to different inflammatory or metabolic risks requires further in vitro and in vivo investigations [18,19,23]. This study only ob-served a useful surrogate EAT parameter (SIVG thickness) change for indicating the improvement of insulin-resistance after weight loss in obese men with MetS. However, the
pathogenesis underlying the close correlations between changes of regional EAT and circulating leptin with the improvement of IR after weight loss in obese MetS de-mands further in vivo animal studies and in vitro cell sig-naling pathway investigations [19]. This study recruited obese men only and the results might not be applicable to women. The major limitation of the study was small sample size and the results were mainly from clinical data analysis without mechanism investigations. Moreover, this result was a post-hoc subgroup analysis of an original 40 men who participated in a weight loss study by diet and exercise. Among them, only 32 agreed MRI exam. And of whom, a subgroup who had achieved weight loss >5% was entered into analysis for correlation between regional fat change and IR. The potential bias resulted from post hoc subgroup analysis could not be neglected.
In conclusion, the decrement ratio of SIVG EAT thick-ness was independently associated with improvement of IR index after weight loss in obese non-diabetic men with MetS. The underlying mechanisms linking change in SIVG EAT thickness and improvement of systemic IR require further study.
Competing interests
The authors declare that they have no competing interests.
Authors’contributions
Regarding the contribution of each author, WHS designed the study and in charge of the whole program. KWL analyzed and interpreted the data and wrote the manuscript. ICT and WJL performed the laboratory work. WLL, SYL, ITL, JSW and CPF recruited the patients, and critically reviewed the manuscript for important intellectual content. All authors read and approved the final manuscript.
Acknowledgements
This study was supported in part by grants from the Taichung Veterans General Hospital, Taiwan (TCVGH-1003101B, 1007307C, 1013103B, 1013108D, TCVGH-FCU-1018201) and the National Science Council, Taiwan (NSC 101-2314-B-075A-006-MY3). The authors would like to thank the Biostatistics Taskforce of Taichung Veterans General Hospital for its assistance with the statistical analyses.
Author details
1Cardiovascular Center, Taichung Veterans General Hospital, No.1650
Section 4, Taiwan Boulevard, Taichung 40705, Taiwan.2Cardiovascular Research Center, Department of Radiology and Department of Medicine, National Yang Ming University School of Medicine, Taipei, Taiwan. 3Department of Medicine, Chung Shan Medical University, Taichung, Taiwan. 4
Department of Medicine, China Medical University, Taichung, Taiwan. 5Department of Radiology, Taichung Veterans General Hospital, Taichung,
Taiwan.6Department of Medical Imaging, Show Chwan Memorial Hospital, Changhua, Taiwan.7Department of Medical Imaging, Chang Bing Show Chwan Memorial Hospital, Changhua, Taiwan.8Department of Medical Research, Taichung Veterans General Hospital, Taichung, Taiwan.9Tung-Hai University, Taichung, Taiwan.10Division of Endocrinology and Metabolism, Department of Medicine, Taichung Veterans General Hospital, Taichung, Taiwan.11Institute of Biomedical Sciences, National Chung Hsing University, Taichung, Taiwan.12Taichung Veterans General Hospital, No.1650 Section 4, Taiwan Boulevard, Taichung 40705, Taiwan.
References
1. Grundy SM, Hansen B, Smith SC Jr, Cleeman JI, Kahn RA:Clinical management of metabolic syndrome: report of the American Heart Association/National Heart, Lung, and Blood Institute/American Diabetes Association conference on scientific issues related to management. Circulation2004,109(4):551–556.
2. Malik S, Wong ND, Franklin SS, Kamath TV, L’Italien GJ, Pio JR, Williams GR:
Impact of the metabolic syndrome on mortality from coronary heart disease, cardiovascular disease, and all causes in United States adults. Circulation2004,110(10):1245–1250.
3. Marroquin OC, Kip KE, Kelley DE, Johnson BD, Shaw LJ, Bairey Merz CN, Sharaf BL, Pepine CJ, Sopko G, Reis SE:Metabolic syndrome modifies the cardiovascular risk associated with angiographic coronary artery disease in women: a report from the Women’s Ischemia Syndrome Evaluation. Circulation2004,109(6):714–721.
4. Malik S, Wong ND, Franklin S, Pio J, Fairchild C, Chen R:Cardiovascular Disease in U.S. Patients With Metabolic Syndrome, Diabetes, and Elevated C-Reactive Protein.Diabetes Care2005,28(3):690–693. 5. Mottillo S, Filion KB, Genest J, Joseph L, Pilote L, Poirier P, Rinfret S,
Schiffrin EL, Eisenberg MJ:The metabolic syndrome and cardiovascular risk a systematic review and meta-analysis.J Am Coll Cardiol2010,
56(14):1113–1132.
6. Rutter MK, Meigs JB, Sullivan LM, D’Agostino RB Sr, Wilson PWF:C-Reactive Protein, the Metabolic Syndrome, and Prediction of Cardiovascular Events in the Framingham Offspring Study.Circulation2004,
110(4):380–385.
7. Koh KK, Han SH, Quon MJ:Inflammatory markers and the metabolic syndrome: insights from therapeutic interventions.J Am Coll Cardiol2005,
46(11):1978–1985.
8. Liang KW, Lee WJ, Lee WL, Chen YT, Ting CT, Sheu WH:Diabetes exacerbates angiographic coronary lesion progression in subjects with metabolic syndrome independent of CRP levels.Clin Chim Acta
2008,388(1–2):41–45.
9. Iacobellis G, Corradi D, Sharma AM:Epicardial adipose tissue: anatomic, biomolecular and clinical relationships with the heart.Nat Clin Pract Cardiovasc Med2005,2(10):536–543.
10. Verhagen SN, Visseren FL:Perivascular adipose tissue as a cause of atherosclerosis.Atherosclerosis2011,214(1):3–10.
11. Iozzo P:Myocardial, perivascular, and epicardial fat.Diabetes Care2011,
34(Suppl 2):S371–S379.
12. Marchington JM, Pond CM:Site-specific properties of pericardial and epicardial adipose tissue: the effects of insulin and high-fat feeding on lipogenesis and the incorporation of fatty acids in vitro.Int J Obes1990,
14(12):1013–1022.
13. Mazurek T, Zhang L, Zalewski A, Mannion JD, Diehl JT, Arafat H, Sarov-Blat L, O’Brien S, Keiper EA, Johnson AG, Martin J, Goldstein BJ, Shi Y:Human epicardial adipose tissue is a source of inflammatory mediators. Circulation2003,108(20):2460–2466.
14. Iacobellis G, Pistilli D, Gucciardo M, Leonetti F, Miraldi F, Brancaccio G, Gallo P, di Gioia CR:Adiponectin expression in human epicardial adipose tissue in vivo is lower in patients with coronary artery disease.Cytokine2005,
29(6):251–255.
15. Wang TD, Lee WJ, Shih FY, Huang CH, Chang YC, Chen WJ, Lee YT, Chen MF:Relations of epicardial adipose tissue measured by multidetector computed tomography to components of the metabolic syndrome are region-specific and independent of anthropometric indexes and intraabdominal visceral fat.J Clin Endocrinol Metab2009,94(2):662–669. 16. Wang CP, Hsu HL, Hung WC, Yu TH, Chen YH, Chiu CA, Lu LF, Chung FM, Shin SJ, Lee YJ:Increased epicardial adipose tissue (EAT) volume in type 2 diabetes mellitus and association with metabolic syndrome and severity of coronary atherosclerosis.Clin Endocrinol (Oxf )2009,
70(6):876–882.
17. Iacobellis G, Ribaudo MC, Assael F, Vecci E, Tiberti C, Zappaterreno A, Di Mario U, Leonetti F:Echocardiographic epicardial adipose tissue is related to anthropometric and clinical parameters of metabolic syndrome: a new indicator of cardiovascular risk.J Clin Endocrinol Metab2003,
88(11):5163–5168.
18. Wang TD, Lee WJ, Shih FY, Huang CH, Chen WJ, Lee YT, Shih TT, Chen MF:
Association of epicardial adipose tissue with coronary atherosclerosis is region-specific and independent of conventional risk factors and intra-abdominal adiposity.Atherosclerosis2010,213(1):279–287.
19. Payne GA, Borbouse L, Kumar S, Neeb Z, Alloosh M, Sturek M, Tune JD:
Epicardial perivascular adipose-derived leptin exacerbates coronary endothelial dysfunction in metabolic syndrome via a protein kinase C-beta pathway.Arterioscler Thromb Vasc Biol2010,30(9):1711–1717. 20. Cheng KH, Chu CS, Lee KT, Lin TH, Hsieh CC, Chiu CC, Voon WC, Sheu SH,
Lai WT:Adipocytokines and proinflammatory mediators from abdominal and epicardial adipose tissue in patients with coronary artery disease.Int J Obes (Lond)2008,32(2):268–274.
21. Alexopoulos N, McLean DS, Janik M, Arepalli CD, Stillman AE, Raggi P:
Epicardial adipose tissue and coronary artery plaque characteristics. Atherosclerosis2010,210(1):150–154.
22. de Vos AM, Prokop M, Roos CJ, Meijs MF, van der Schouw YT, Rutten A, Gorter PM, Cramer MJ, Doevendans PA, Rensing BJ, Bartelink ML, Velthuis BK, Mosterd A, Bots ML:Peri-coronary epicardial adipose tissue is related to cardiovascular risk factors and coronary artery calcification in post-menopausal women.Eur Heart J2008,29(6):777–783. 23. Liang KW, Tsai IC, Lee WJ, Lee IT, Lee WL, Lin SY, Wan CJ, Fu CP, Ting CT,
Sheu WH:MRI measured epicardial adipose tissue thickness at the right AV groove differentiates inflammatory status in obese men with metabolic syndrome.Obesity (Silver Spring)2012,20(3):525–532. 24. Dengel DR, Kelly AS, Olson TP, Kaiser DR, Dengel JL, Bank AJ:Effects of
weight loss on insulin sensitivity and arterial stiffness in overweight adults.Metabolism2006,55(7):907–911.
25. Liang KW, Lee WJ, Lee IT, Lee WL, Lin SY, Hsu SL, Wan CJ, Yu CY, Tsai IC, Fu CP, Ting CT, Sheu WH:Persistent elevation of paraoxonase-1 specific enzyme activity after weight reduction in obese non-diabetic men with metabolic syndrome.Clin Chim Acta2011,412(19–20):1835–1841. 26. Fu CP, Sheu WH, Lee IT, Tsai IC, Lee WJ, Liang KW, Lee WL, Lin SY:Effects of
weight loss on epicardial adipose tissue thickness and its relationship between serum soluble CD40 ligand levels in obese men.Clin Chim Acta
2013,421C:98–103.
27. Klein S, Fontana L, Young VL, Coggan AR, Kilo C, Patterson BW, Mohammed BS:Absence of an effect of liposuction on insulin action and risk factors for coronary heart disease.N Engl J Med2004,350(25):2549–2557. 28. Thorne A, Lonnqvist F, Apelman J, Hellers G, Arner P:A pilot study of
long-term effects of a novel obesity treatment: omentectomy in connection with adjustable gastric banding.Int J Obes Relat Metab Disord2002,26(2):193–199.
29. Gabriely I, Ma XH, Yang XM, Atzmon G, Rajala MW, Berg AH, Scherer P, Rossetti L, Barzilai N:Removal of visceral fat prevents insulin resistance and glucose intolerance of aging: an adipokine-mediated process? Diabetes2002,51(10):2951–2958.
30. Abate N, Garg A, Peshock RM, Stray-Gundersen J, Adams-Huet B, Grundy SM:
Relationship of generalized and regional adiposity to insulin sensitivity in men with NIDDM.Diabetes1996,45(12):1684–1693.
31. Abate N, Garg A, Peshock RM, Stray-Gundersen J, Grundy SM:Relationships of generalized and regional adiposity to insulin sensitivity in men.J Clin Invest1995,96(1):88–98.
32. Third Report of the National Cholesterol Education Program (NCEP):Expert Panel on Detection, Evaluation, and Treatment of High Blood Cholesterol in Adults (Adult Treatment Panel III) final report.Circulation2002,
106(25):3143–3421.
33. Sheu WH, Chang TM, Lee WJ, Ou HC, Wu CM, Tseng LN, Lang HF, Wu CS, Wan CJ, Lee IT:Effect of weight loss on proinflammatory state of mononuclear cells in obese women.Obesity (Silver Spring)2008,16(5):1033–1038. 34. Sheu WH, Chin HM, Lee WJ, Wan CJ, Su HY, Lang HF:Prospective
evaluation of folic acid supplementation on plasma homocysteine concentrations during weight reduction: a randomized, double-blinded, placebo-controlled study in obese women.Life Sci2005,76(18):2137–2145. 35. Reilly MP, Wolfe ML, Rhodes T, Girman C, Mehta N, Rader DJ:Measures of
insulin resistance add incremental value to the clinical diagnosis of metabolic syndrome in association with coronary atherosclerosis. Circulation2004,110(7):803–809.
36. Soyama A, Nishikawa T, Ishizuka T, Ito H, Saito J, Yagi K, Saito Y:Clinical usefulness of the thickness of preperitoneal and subcutaneous fat layer in the abdomen estimated by ultrasonography for diagnosing abdominal obesity in each type of impaired glucose tolerance in man.Endocr J2005,
52(2):229–236.
38. Liang KW, Sheu WH, Lee WL, Liu TJ, Ting CT, Hsieh YC, Wang KY, Chen YT, Lee WJ:Decreased circulating protective adiponectin level is associated with angiographic coronary disease progression in patients with angina pectoris.Int J Cardiol2008,129(1):76–80.
39. Liang KW, Lee WJ, Lee WL, Ting CT, Sheu WH:Decreased ratio of high-molecular-weight to total adiponectin is associated with angiographic coronary atherosclerosis severity but not restenosis. Clin Chim Acta2009,405(1–2):114–118.
40. Bashir A, Laciny E, Lassa-Claxton S, Yarasheski KE:Magnetic resonance imaging for quantifying regional adipose tissue in human immunodeficiency virus-infected persons with the cardiometabolic syndrome.J Cardiometab Syndr2008,3(2):115–118.
41. Goel K, Misra A, Vikram NK, Poddar P, Gupta N:Subcutaneous abdominal adipose tissue is associated with the metabolic syndrome in Asian Indians independent of intra-abdominal and total body fat.Heart2010,
96(8):579–583.
42. Fluchter S, Haghi D, Dinter D, Heberlein W, Kuhl HP, Neff W, Sueselbeck T, Borggrefe M, Papavassiliu T:Volumetric assessment of epicardial adipose tissue with cardiovascular magnetic resonance imaging.Obesity (Silver Spring)2007,15(4):870–878.
43. Iacobellis G, Leonetti F:Epicardial adipose tissue and insulin resistance in obese subjects.J Clin Endocrinol Metab2005,90(11):6300–6302. 44. Manco M, Morandi A, Marigliano M, Rigotti F, Manfredi R, Maffeis C:
Epicardial fat, abdominal adiposity and insulin resistance in obese pre-pubertal and early pubertal children.Atherosclerosis2013,
226(2):490–495.
45. Reinehr T, Kratzsch J, Kiess W, Andler W:Circulating soluble leptin receptor, leptin, and insulin resistance before and after weight loss in obese children.Int J Obes (Lond)2005,29(10):1230–1235.
46. Reinehr T, Roth CL:A new link between skeleton, obesity and insulin resistance: relationships between osteocalcin, leptin and insulin resistance in obese children before and after weight loss.Int J Obes (Lond)2010,34(5):852–858.
47. Bluher M, Rudich A, Kloting N, Golan R, Henkin Y, Rubin E, Schwarzfuchs D, Gepner Y, Stampfer MJ, Fiedler M, Thiery J, Stumvoll M, Shai I:Two patterns of adipokine and other biomarker dynamics in a long-term weight loss intervention.Diabetes Care2012,35(2):342–349.
48. Kremen J, Dolinkova M, Krajickova J, Blaha J, Anderlova K, Lacinova Z, Haluzikova D, Bosanska L, Vokurka M, Svacina S, Haluzik M:Increased subcutaneous and epicardial adipose tissue production of proinflammatory cytokines in cardiac surgery patients: possible role in postoperative insulin resistance.J Clin Endocrinol Metab2006,91(11):4620–4627.
49. Kaess BM, Pedley A, Massaro JM, Murabito J, Hoffmann U, Fox CS:
The ratio of visceral to subcutaneous fat, a metric of body fat distribution, is a unique correlate of cardiometabolic risk. Diabetologia2012,55(10):2622–2630.
doi:10.1186/1758-5996-6-115
Cite this article as:Lianget al.:Correlation between reduction of superior interventricular groove epicardial fat thickness and improvement of insulin resistance after weight loss in obese men.Diabetology & Metabolic Syndrome20146:115.
Submit your next manuscript to BioMed Central and take full advantage of:
• Convenient online submission
• Thorough peer review
• No space constraints or color figure charges
• Immediate publication on acceptance
• Inclusion in PubMed, CAS, Scopus and Google Scholar
• Research which is freely available for redistribution