R E S E A R C H
Open Access
Construct validation and correlates of
preoperative expectations of postsurgical
recovery in persons undergoing knee
replacement: baseline findings from a
randomized clinical trial
Daniel L. Riddle
1*, James Slover
2, Dennis Ang
3, Robert A. Perera
4and Levent Dumenci
5Abstract
Background:A patient’s recovery expectations prior to knee arthroplasty influence postsurgical outcome and satisfaction but a unidimensional measure of expectation has not been reported in the literature. Our primary purpose was to determine the extent to which a patient expectations scale reflects a unidimensional construct. Our second purpose was to identify pre-operative variables associated with patients’expectations. We hypothesized that previously identified predictors of the latent expectation scale score would be associated with expectations and that previously unexplored variables of pain catastrophizing, depressive and anxiety symptoms, self-efficacy and number of painful body regions would also associate with pre-operative expectations.
Methods:Our randomized clinical trial had 384 patients assessed prior to knee replacement surgery. The expectations scale along with several predictor variables including WOMAC, psychological distress, and sociodemographic variables were obtained. Confirmatory factor analysis tested the unidimensionality of the measure and structural equation modeling identified predictors of the latent expectations measure.
Results:The expectations scale was found to be unidimensional with superior model fit (χ2 = 1.481; df = 2;p= 0.224; RMSEA = 0.035; 90% CI = [0–0.146]; CFI = 0.999; TLI = 0.993). The only variable significantly associated with expectations in the multivariate model was self-efficacy.
Conclusions:The expectations scale used in our study demonstrated unidimensionality and has strong potential for clinical application. Poor self-efficacy is a potential target for intervention given its independent association with expectation. Addressing expectations directly and indirectly through self-efficacy assessment may assist in better aligning patient’s expectations with likely outcome.
Trial registration:ClinicalTrials.gov NCT01620983.
Keywords:Knee, Arthroplasty, Expectations, Outcome
* Correspondence:[email protected]
1Departments of Physical Therapy, Orthopaedic Surgery and Rheumatology,
Virginia Commonwealth University, Richmond, Virginia 23298, USA Full list of author information is available at the end of the article
Background
Patients’expectations of post-surgical recovery, assessed prior to knee replacement surgery have been extensively studied [1]. Because preoperative expectations have been associated with patient satisfaction following surgery [2, 3], there is strong interest in assessing patients’ expecta-tions and potentially modifying unrealistic expectaexpecta-tions to improve patient satisfaction [4]. However, the meas-urement of expectations can be complex as patients may have vastly different ideas of what they expect to be able to do and how they expect to feel after surgical recovery [1]. Additionally, other studies have shown no relation-ship between pre-operative expectations and satisfaction with surgery [5, 6] which have led some to speculate that variation in the association between preoperative expect-ation and satisfaction is complicated by the lack of psy-chometrically sound expectation instruments [1, 7].
As a construct, expectation may be conceptualized as a latent variable. As such, it can only be indirectly measured via the use of indicator variables. For example, the extent of pain relief and functional improvement a patient might expect following surgery are commonly used indicator variables in expectation scales developed for knee replace-ment surgery [2, 4, 8–14]. As of October, 2012 an esti-mated 25 expectation instruments for knee replacement had been described and most of these had no evidence of psychometric development or validation [1].
The most extensively developed and commonly refer-enced preoperative expectation scale for knee arthroplasty (KA) recovery is the Hospital for Special Surgery Knee Re-placement Expectations Survey (HHSKR) [4, 11]. The ori-ginal HHSKR contained 17 questions for patients to rate the importance (from“very important”to“I do not expect this”) of each scale item (e.g., straighten knee, being employed, improved psychological well-being) [11]. A later version changed the responses from an emphasis on importance to an emphasis on expectation of extent of re-covery (from“complete improvement”to“not applicable”) for each scale item [4]. Scores for each item are summed to create a total score. The investigators reported on the development and reliability of the original scale [11] but did not determine if the expectation scale reflected only one dimension or multiple dimensions. None of the in-struments we found examined dimensionality of the con-struct of patient expectation of recovery and whether it reflected a single or multiple dimensions. One could im-agine that the HHSKR, for example, may actually reflect multiple dimensions related to expectation, the main con-struct of interest. For example, items dealing with stair-climbing, kneeling, and squatting may reflect one dimension while other items like employment and inter-acting with others may reflect another dimension. If mul-tiple dimensions were found for the HHSKR, this would have important implications for scale score interpretation
and would indicate the need for a sub-score for each dimension to fully interpret the scores. Because of the length of the HHSKR (17 items) which impacts clinical feasibility and because of the lack of evidence regarding dimensionality, we elected to use a shorter and more focused scale in the current study.
We recently recruited a multi-site sample of 384 persons with moderate to high levels of pain catastrophizing, an indicator of poor pain coping [15], for a randomized clinical trial of a pain coping skills intervention [16]. As part of preoperative data collection, patients completed an expectations scale [10]. Much like all other expectation scales that we found [2, 4, 8–14], the scale we used [10] had not been studied to test the measurement structure of the instrument.
One purpose of our study was to determine the extent to which the patient expectations scale reflects a unidi-mensional construct. We hypothesized that the scale would reflect a single construct. Our second purpose was to identify pre-operative variables associated with expectations of postsurgical recovery. We hypothesized that previously identified evidence-based predictors of preoperative expectations scale score [10, 17] (i.e., higher (worse) pre-operative Western Ontario and McMaster Universities Arthritis Index (WOMAC) Pain scores, greater comorbidity, not having assistance at home and African American race) would be associated with higher (worse) expectations in our sample. We further hypothe-sized that scores for previously unexplored variables of pain catastrophizing, depressive and anxiety symptoms and number of painful body regions would positively associate with KA recovery expectations (i.e., higher scores would associate with higher (worse) expectations) while self-efficacy scores would be negatively associated with expectations (i.e. higher self-efficacy scores would associate with lower (better) expectation scores). The association between pain catastrophizing and preopera-tive expectations was examined in one study though the expectation measure reflected a 1-month postsurgical outcome (versus outcome expectation following surgical recovery as was measured in the current study) and pain catastrophizing associated only with 2 of 4 items in the expectation scale [18].
Methods
Study design and setting
study was cross-sectional. Only the pre-operative base-line data were used to test the study hypotheses.
Participants
Patients were considered eligible for consenting to the study if they: (1) were aged 45 years or older; (2) had a diagnosis of knee osteoarthritis; (3) had KA surgery sched-uled within 8 weeks following consent; (4) scored a 16 or greater on the Pain Catastrophizing Scale a score that was found to associate with poor WOMAC Pain outcome [19], and (5) were able to read and speak English. Patients were excluded if they: (1) were scheduled for knee revision sur-gery; (2) underwent another arthroplasty surgery within 6 months of the surgery of interest; (3) had a diagnosis of inflammatory arthritis (e.g. rheumatoid arthritis, psoriatic arthritis); (4) were scheduled for bilateral KA; (5) planned to undergo hip or knee arthroplasty within 6 months after current knee arthroplasty; (6) scored a 20 or greater on the depression screener [20]; and (7) scored a 2 or less on the cognitive screener [21]. A total of 4043 subjects were screened for admission to the study and 402 were enrolled. A total ofn= 3641 were excluded, withn= 1694 not meet-ing inclusion criteria,n= 748 declined participation andn = 1199 excluded for a variety of other reasons. A total of 18 subjects who consented to participate had their surger-ies cancelled for medical reasons after consent, leaving 384 subjects who underwent KA surgery subsequent to study admission.
Data collection procedures
Patients were approached by a site coordinator within eight weeks prior to surgery and were informed about the purpose of the clinical trial. If patients expressed a willingness to participate, they read and signed an Insti-tutional Review Board (IRB) approved consent form and then completed all required baseline data collection via an in-person interview. All patients underwent either total knee arthroplasty (n= 367) or partial knee arthro-plasty (n= 17). A total of 32 surgeons performed KA surgeries across the 5 sites and the total number of pa-tients seen by each surgeon ranged from 1 to 54.
Outcome measure of interest
The self-reported outcome of interest was the four-item patient expectation measure [10]. This is one of the first expectation scales reported in the literature. Little infor-mation was provided on the development of the scale though the foci of the 4 items was on pain and func-tional improvement expectations, overall surgical suc-cess and likely complication risk. Expectations of pain, functional status and complications following KA have been incorporated in most expectation scales developed following the publication by Mohammed and colleagues [1]. The 1st item (i.e.,“How painful do you expect your
knee to be in one year?”) and the 2nd item (i.e., “How limited do you expect to be in your usual activities in one year?”) were each scored on a 4 point scale from not at all painful (or not limited) to very painful (or very lim-ited). The 3rd item (“How likely will your surgery be a complete success?”) and the 4th item (“How likely will you have a knee joint complication?”) are each scored on a 0 to 10 scale. For the 3rd item, 0 equates to not at all likely while 10 indicates the patient is very likely to have a completely successful outcome. For the 4th item, 0 in-dicates the patient is not at all likely while a score of 10 indicates the person is very likely to have a complication. In summary, items #1, 2 and 4 are scored such that higher scores equate to worse outcomes while for item #3, higher scores indicate a better outcome. For the pri-mary analyses, we kept the scoring as originally de-scribed. Developers of the scale did not provide a rationale for the different scaling for the four items. To provide a straightforward method for describing raw scores for the patient expectation scale, we transformed scores for item #3 so that higher scores equated to worse outcomes, much like the other items. In addition, we converted the four-point scale scores for items #1 and 2 to an 11-point score by multiplying each score by 11/4 so that each item of the scale ranged from 0 to 10. These transformed scores are summarized in Table 1. Validity has been demonstrated to the extent that higher expec-tations was associated with better pain and function out-come following arthroplasty [10].
Predictors in construct validity analysis
[28]. Scores for the ASES range from 8 (lowest self- effi-cacy to 80 (highest effieffi-cacy). Persons with higher self-efficacy were expected to have higher expectations of outcome.
Race was dichotomized to African American subjects or all other subjects. African Americans are less likely to undergo KA and are less trusting of healthcare recom-mendations regarding KA surgery [29]. We used the val-idated modified Charlson comorbidity index to quantify extent of comorbidity [30]. We suspected that patients with a greater morbidity burden would have lower ex-pectations than persons with less comorbidity. The pre-viously validated Patient Health Questionnaire (PHQ-8)
[20] and the Generalized Anxiety Scale (GAD-7) [31, 32] were used to quantify extent of depressive and anxiety symptoms, respectively. The PHQ-8 is scored from 0 to 24 and the GAD-7 is scored from 0 to 21 with higher scores indicating more severe depressive or anxiety symp-toms. Because both anxiety and depressive symptoms are negatively associated with a person’s level of optimism [33], we suspected that higher levels of either depressive symptoms or anxiety would negatively associate with ex-pectation. Number of bodily pain sites (e.g., low back, neck, right shoulder), ranging from 1 to 16 sites were de-termined [34]. Because we were interested in musculo-skeletal widespread pain and not fibromyalgia per se, we did not include the jaw and abdomen items from the ori-ginal scale. We suspected that persons with greater num-bers of bodily pain sites would have lower expectations because the KA surgery would very likely have no effect on pain from these other sites. Finally, based on prior evi-dence [17] we suspected that not having assistance at home would associate with worse expectations.
Covariates
To account for other variables that may be associated with both expectation and our predictors or interest, we also adjusted for patient age, sex, opioid use (yes or no), and education (less than high school, high school gradu-ate, some college, college degree).
Data analysis
Confirmatory factor analysis was used to test the measure-ment structure and baseline variables associated with the expectancy scale. We tested two measurement models: a one-factor model with and without the method factor and compared them during the model selection process. The best fitting model was subsequently used in the validation of the instrument using structural equation modeling. The measurement model specification with and without the method factor was motivated by the difference in item stems (“how likely” versus “how painful/limited”) as well as the response format difference between two sets of items (0–3 versus 0–10) that might potentially yield larger covariances between items with the same item character-istics. We used the M-1 method factor specification with unit factor loadings as suggested by Eid [35]. Trait and method factors were orthogonal in the measurement model with the method effect.
To account for clustered sampling design (patients nested within surgeons), we used the random intercept model to account for correlated data. Items with a 0 to 3 scoring format (later transformed to a 0 to 10 scale) were fitted as ordinal categories in all models because categorical outcome variables (factor indicators) violate the multivariate normality assumption.
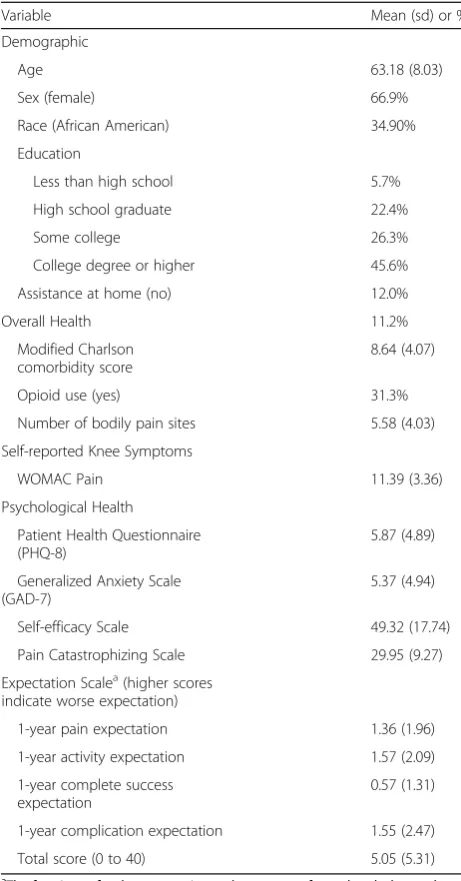
Table 1Characteristics of the Sample (n= 384)
Variable Mean (sd) or %
Demographic
Age 63.18 (8.03)
Sex (female) 66.9%
Race (African American) 34.90%
Education
Less than high school 5.7%
High school graduate 22.4%
Some college 26.3%
College degree or higher 45.6%
Assistance at home (no) 12.0%
Overall Health 11.2%
Modified Charlson comorbidity score
8.64 (4.07)
Opioid use (yes) 31.3%
Number of bodily pain sites 5.58 (4.03)
Self-reported Knee Symptoms
WOMAC Pain 11.39 (3.36)
Psychological Health
Patient Health Questionnaire (PHQ-8)
5.87 (4.89)
Generalized Anxiety Scale (GAD-7)
5.37 (4.94)
Self-efficacy Scale 49.32 (17.74)
Pain Catastrophizing Scale 29.95 (9.27)
Expectation Scalea(higher scores indicate worse expectation)
1-year pain expectation 1.36 (1.96)
1-year activity expectation 1.57 (2.09)
1-year complete success expectation
0.57 (1.31)
1-year complication expectation 1.55 (2.47)
Total score (0 to 40) 5.05 (5.31)
a
Using the appropriate measurement model selected using confirmatory factor analysis, a measurement in-variance test was conducted between the gender groups followed by a structural model to identify predictors of the latent expectation construct. Potential predictors in-cluded demographic characteristics, preoperative pain, assistance at home, pain catastrophizing, depressive symptoms, anxiety, and number of pain sites, self-efficacy, and opioid use. Each predictor was testing using an alpha level of 0.05. Mplus software (version 7.4) was used in model fitting.
Results
We consented a total of 384 patients who underwent KA surgery. The average age of the sample was 63.18 (standard deviation/sd = 8.03) years, 34.9% were African American and 66.9% were female. The average pain cata-strophizing score was 29.95 (sd = 9.27) and is indicative of persons with moderate to high levels of pain catastro-phizing [15]. The characteristics of the sample are re-ported in Table 1.
Dimensionality of the expectation scale
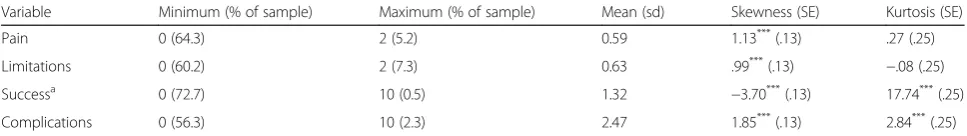
Descriptive statistics along with skewness and kurtosis estimates for the four items of the expectations scale ap-pear in Table 2. The unidimensional latent variable model without a method factor was inconsistent with the data (χ2= 24.962; df = 2; p< 0.001; RMSEA = 0.173; 90% CI = [0.116–0.236]; CFI = 0.942; TLI = 0.826). A method factor had a superior model fit (χ2= 1.481; df = 2; p= 0.224; RMSEA = 0.035; 90% CI = [0–0.146]; CFI = 0.999; TLI = 0.993). The statistical difference between the two models was significant (Δχ2 = 28.11; df = 1; p < .001) indicating that the unidimensional expectation scale with a method factor was the best fitting model. Incorporating the method factor assures that the unidi-mensional Expectancy factor is not confounded with this source of systematic error (bias).
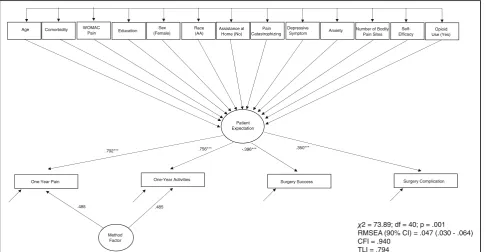
The graphical representation of the measurement model with standardized factor loadings appear in Fig. 1. Method factor loadings are set equal for the purpose of model identification. The coefficients, as expected, reflected positive associations between the latent con-struct of Patient Expectation and the indicator variables
of one-year pain, one-year limitation and surgery com-plication expectations. The Surgery Success indicator variable, as expected, was negatively associated with the latent construct because of the reverse coding of this item in the original scale.
Construct validity evidence
Measurement invariance for sex based differences was assessed. The model with scalar invariance restriction (equality of factor loadings and item thresholds between the groups) fit the model as well as the configural invari-ance model (factor loadings are freely estimated in both groups): χ2 = 7.29; df = 7; p= .399; RMSEA (90% CI): .015 (0–.091); CFI = .999; TLI = .998. Based on the rule of parsimony, the results support the measurement in-variance between males and females.
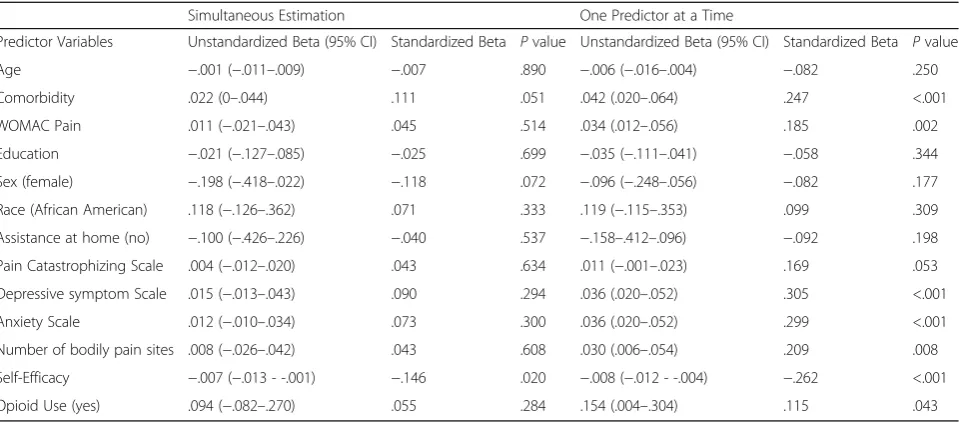
Structural equation modeling was used to predict the latent expectation variable using all predictor and covari-ate variables (see Fig. 2). Standardized and unstandard-ized regression coefficients for each variable in both the univariate and multivariate models appear in Table 3. For the univariate analyses, comorbidity, WOMAC Pain, depressive and anxiety symptoms, number of bodily pain sites were positively associated (p< 0.01) with expecta-tions such that higher (worse) scores in each of these predictors were associated with higher (worse) expecta-tions. Opioid use was the only covariate associated with expectations (p= 0.043). Self-efficacy was negatively as-sociated (p< 0.001) with expectations such that higher self-efficacy scores were associated with lower (better) expectations. Only one variable, self-efficacy, was associ-ated with expectation after adjustment for all other vari-ables in the model. Persons who scored higher on self-efficacy tended to score lower (better) on the Patient Ex-pectation latent construct, as hypothesized. No other variable was associated with the latent construct of ex-pectation after adjusting for all other variables in the model. A correlation matrix of all 13 predictors of the expectation latent variable appears in Table 4.
Discussion
Expectations of postsurgical recovery, assessed preopera-tively, are considered by orthopaedic surgeons to be an important and commonly used prognostic indicator of
Table 2Score distributions, skewness, kurtosis and of the four items in the expectations scale
Variable Minimum (% of sample) Maximum (% of sample) Mean (sd) Skewness (SE) Kurtosis (SE)
Pain 0 (64.3) 2 (5.2) 0.59 1.13***(.13) .27 (.25)
Limitations 0 (60.2) 2 (7.3) 0.63 .99***(.13) −.08 (.25)
Successa 0 (72.7) 10 (0.5) 1.32 −3.70***(.13) 17.74***(.25)
Complications 0 (56.3) 10 (2.3) 2.47 1.85***(.13) 2.84***(.25)
a
This item has been reverse coded such that that higher scores equated to worse outcomes, much like the other items in the scale
***
patient outcome and patient satisfaction after KA [1, 3, 6]. If a patient’s expectations are too high (e.g. if a pa-tient expected to participate in recreational running for moderate to long distances after surgery) surgeons would typically intervene to enhance chances of
long-term implant survival. If the patient’s expectations are too low (e.g., if a patient expected at least moderate pain after the surgery) the surgeon could provide information on the most likely pain level following surgery. Despite a clear rationale and need for assessments of patients’
Fig. 1The latent construct, Patient Expectation, is connected via arrows to four indicator variables that comprise the latent construct. These indicator variables are the individual items of the expectation measure (i.e., One-year pain, One-year function, Surgical success and Surgical Complication expectations). Each arrow also is labeled with a coefficient that describes the strength of association between the latent construct of Patient Expectation and the observed variable. The One-year pain and One-year function variables are connected via arrows from a Method factor
Patient Expectation
2 = 73.89; df = 40; p = .001 RMSEA (90% CI) = .047 (.030 - .064) CFI = .940
TLI = .794
Method Factor
One-Year Pain One-Year Activities Surgery Success Surgery Complication
Age Comorbidity WOMAC
Pain Education
Sex (Female)
Race (AA)
Assistance at Home (No)
Pain Catastrophizing
Depressive
Symptom Anxiety
Number of Bodily Pain Sites
Self-Efficacy
Opioid Use (Yes)
.792*** .756*** -.396*** .350***
.485 .485
preoperative expectations, psychometrically sound in-struments for measuring patient expectations are lacking [1, 7].
We evaluated the measurement structure of the ex-pectation scale [10] collected from a large prospective sample of patients with moderate to high levels of pain catastrophizing, a characteristic associated with poor outcome [19, 26, 36]. We found that the scale reflected a unidimensional construct suggesting that clinicians can be confident that a single score reflects the entire scale. To our knowledge, our study is the first to provide con-firmatory factor analysis evidence of unidimensionality for a KA expectations scale.
Our findings related to correlates of expectations were unexpected. Only self-efficacy associated with expectation
scale scores in our multivariate model. Several other base-line variables shown to associate with expectations in other studies (i.e., pre-operative WOMAC Pain scores, comorbid-ity) were associated with expectations in our study but not when adjusted for other variables in the model. Addition-ally, we hypothesized that pain catastrophizing, depressive symptoms and number of painful body regions would be positively associated with expectations in our sample, and all were associated but only in univariate analyses. We sus-pect the truncated range of scores for the PCS may have limited our ability to detect an association between pain catastrophizing and expectations. We specifically recruited persons with moderate to high catastrophizing and ex-cluded persons with either a score of 0 or only mild catastrophizing.
Table 4Relationship between the predictors of the latent Patient Expectation variable
1 2 3 4 5 6 7 8 9 10 11 12 13
1. Age 1
2. Comorbidity −.006 1
3. Womac Pain −.176** .283*** 1
4. Education .137* −.136** −.229*** 1
5. Sex (Female) .034 .055 .102* −.024 1
6. Race (AA) −.223*** .165** .219** −.281*** .039 1
7. Assistance at Home (No) .023 −.003 .014 −.008 −.021 .052 1
8. Pain Catastrophizing −.191** .182*** .427*** −.269*** −.017 .208*** .017 1
9. Depressive Symptom −.197*** .350*** .291*** −.145** .093* .064 −.047 .260*** 1
10. Anxiety −.224*** .308*** .258*** −.141** .121*** .080 −.079 .309*** .703*** 1
11. Number of Bodily Pain Sites −.059 .407*** .339*** −.153*** .146* .183*** .014 .159*** .331*** .336*** 1
12. Self-Efficacy .228*** −.234*** −.252*** −.032 .002 −.042 .087 −.206*** −.368*** −.337*** −.215*** 1
13. Opioid Use (Yes) −.198*** .295*** .206*** −.167*** .032 .237*** −.010 .084 .183*** .176*** .210*** −.035 1
Note. Entries are correlation coefficients estimated from the model presented in Fig.2. *p< .05; **p< .01; ***p < .001
Table 3Structural Equation Modeling results for associations between preoperative expectation score and covariates
Simultaneous Estimation One Predictor at a Time
Predictor Variables Unstandardized Beta (95% CI) Standardized Beta Pvalue Unstandardized Beta (95% CI) Standardized Beta Pvalue
Age −.001 (−.011–.009) −.007 .890 −.006 (−.016–.004) −.082 .250
Comorbidity .022 (0–.044) .111 .051 .042 (.020–.064) .247 <.001
WOMAC Pain .011 (−.021–.043) .045 .514 .034 (.012–.056) .185 .002
Education −.021 (−.127–.085) −.025 .699 −.035 (−.111–.041) −.058 .344
Sex (female) −.198 (−.418–.022) −.118 .072 −.096 (−.248–.056) −.082 .177
Race (African American) .118 (−.126–.362) .071 .333 .119 (−.115–.353) .099 .309
Assistance at home (no) −.100 (−.426–.226) −.040 .537 −.158–.412–.096) −.092 .198
Pain Catastrophizing Scale .004 (−.012–.020) .043 .634 .011 (−.001–.023) .169 .053
Depressive symptom Scale .015 (−.013–.043) .090 .294 .036 (.020–.052) .305 <.001
Anxiety Scale .012 (−.010–.034) .073 .300 .036 (.020–.052) .299 <.001
Number of bodily pain sites .008 (−.026–.042) .043 .608 .030 (.006–.054) .209 .008
Self-Efficacy −.007 (−.013 - -.001) −.146 .020 −.008 (−.012 - -.004) −.262 <.001
Prior work [10, 17] only identified univariate associa-tions between predictors and latent variable expectaassocia-tions score for some of the variables we studied. Ours was only the second study, [17] that we found to generate a multivariate model of correlates of expectations. Hepin-stall and colleagues [17] examined 1943 patients prepar-ing for KA and found that age, assistance at home, history of prior joint arthroplasty, SF-36 General Health, KOOS Quality-of-Life scores associated with expecta-tions in a multivariate model. We did not find that ei-ther age or assistance at home was associated with expectation.
Hypothesized associations between expectations and potential correlates were obtained in prior studies using a variety of expectations measures on a broad spectrum of patients undergoing KA [3, 6, 10, 17]. Our study was conducted on a homogenous group of patients with moderate to high levels of pain catastrophizing and it is possible that this phenotype of patients explained our findings relative to these other studies. We found few studies that explored associations between expectations and a variety of psychological distress measures [3]. While we expected that persons with higher levels of pain catastrophizing and depressive symptoms would likely have lower expectations because of their distress, only univariate analyses support this assumption. Simi-larly, we thought it reasonable to hypothesize that per-sons with pain in more body regions would have lower expectations because the surgery only targeted a knee and not these other body regions. This hypothesis also was only supported in our univariate analysis.
The only hypothesized association we found in our multivariate model was between expectation and patient self-efficacy. The higher a patient’s self-efficacy, the better the preoperative expectation. Our data suggests that self-efficacy is an independent correlate and is moderately as-sociated with expectations. Self-efficacy, the belief that one can control both pain and functional challenges asso-ciated with arthritis and KA can affect expectations nega-tively if the patient’s self-efficacy is poor. Addressing reasons for poor self-efficacy may assist in better aligning expectations with expected outcome leading to better re-sults and potentially improving patient satisfaction, given substantial evidence indicating that about 20% of patients are dissatisfied with their outcome and a similar propor-tion have only slight or mild pain following recovery [37, 38]. Alternatively, in patients with very high self-efficacy, expectations may be unrealistically high and the surgeon may need to temper a patient’s expectations. Only about 40% of patients are pain-free following KA recovery and over 60% of our patients expected to be pain free after re-covery. Self-efficacy was the variable in our study that most strongly associated with expectation in both univari-ate and multivariunivari-ate analyses and therefore is the likely
variable to inform interventions designed to align expecta-tions with most likely outcome.
Our study had some important limitations. Our study design was cross sectional and the patients we studied had moderate to severe pain catastrophizing. This popu-lation may respond differently to expectations scales as compared to the general total knee arthroplasty popula-tion. Interestingly, the expectations scores in our sample suggested very high expectations, with mean scores of 5.05 (sd = 5.31) on a 0 to 40 scale with lower scores indi-cating higher expectations. Given the elevated risk of poor outcome for persons with moderate to high cata-strophizing [19, 26, 27, 36], it is likely that many in our sample had artificially inflated expectations. Approxi-mately 63% of our sample expected complete pain relief, 60% expected complete return to daily activities, 72% ex-pected complete success following the procedure and 56% expected no complications. A substantial ceiling ef-fect raises concerns [39] regarding the interpretation of scores and likely limited our ability to identify correlates of expectation. However, scores of 0 on the expectations scale are potentially informative because they indicate the patient’s expectations may be too high. Patients’pain and function are substantially improved, on average, fol-lowing KA surgery but some residual discomfort and functional compromise is very common [22, 40, 41]. Fi-nally, we did not compare our expectation scale to an-other scale designed to measure expectations and this would have provided another approach to assess con-struct validity.
Conclusion
We found that the patient expectation scale [10] is uni-dimensional. Users can be confident that a single score reflects the entire scale. Additionally, we found that of the several baseline variables hypothesized to be associ-ated with expectations, only self-efficacy was found to be significant in our multivariate model. Patients with poor self-efficacy scores may benefit from interventions to both improve self-efficacy and better align expectations with likely outcome. The expectations scale score was substantially influenced by ceiling effects but these ef-fects do not necessarily preclude potentially worthwhile application of the instrument. Scores of 0 on the scale inform the surgeon that expectations may be unrealistic-ally high, particularly in patients with moderate to high pain catastrophizing like those in our sample.
Abbreviations
ASES:Arthritis Self-Efficacy Scale; GAD-7: Generalized Anxiety Scale; HHSKR: Hospital for Special Surgery Knee Replacement Expectations Survey; IRB: Institutional Review Board; KA: Knee arthroplasty; PCS: Pain
Acknowledgements
We wish to thank the patients and the study staff for their participation in our study.
Funding
Research reported in the publication was supported by the National Institute of Arthritis and Musculoskeletal and Skin Diseases of the National Institutes of Health under Award Number UM1AR062800. The content is solely the responsibility of the authors and does not necessarily represent the official views of the National Institutes of Health. The study was also supported by a National Institutes of Health Center for Clinical and Translational Research grant UL1TR000058 from the National Center for Advancing Translational Sciences and awarded to Virginia Commonwealth University.
Availability of data and materials
The datasets generated and/or analyzed during the current study are not publicly available because the study has not yet been completed.
Authors’contributions
DLR developed the idea for the manuscript and was a major contributor in writing the manuscript, JS and DA contributed to the writing of the manuscript, and LD and RP conducted all analyses, contributed to the writing of the manuscript. All authors refined the major purposes and approved the final version of the manuscript.
Ethics approval and consent to participate
All study site institutions’IRBs approved the study. The coordinating center IRB, Virginia Commonwealth University reference number is IRB
HM14326_CR4.
Consent for publication
Not applicable
Competing interests
The authors declare that they have no competing interests.
Publisher’s Note
Springer Nature remains neutral with regard to jurisdictional claims in published maps and institutional affiliations.
Author details
1Departments of Physical Therapy, Orthopaedic Surgery and Rheumatology,
Virginia Commonwealth University, Richmond, Virginia 23298, USA. 2Associate Professor, Adult Reconstructive Division, Department of
Orthopaedic Surgery, NYU Hospital for Joint Diseases, 301 East 17th Street; Suite 213, New York, NY 10003, USA.3Department of Medicine, Section of Rheumatology, Wake Forest School of Medicine, Winston-Salem, North Carolina 27157, USA.4Department of Biostatistics, Virginia Commonwealth University, Richmond, VA 23298, USA.5Department of Epidemiology and Biostatistics, Temple University, Philadelphia, PA 19122, USA.
Received: 12 July 2017 Accepted: 23 November 2017
References
1. Zywiel MG, Mahomed A, Gandhi R, Perruccio AV, Mahomed NN. Measuring expectations in orthopaedic surgery: a systematic review. Clin Orthop Relat Res. 2013;471:3446–56.
2. Mannion AF, Kampfen S, Munzinger U, Kramers-de Quervain I. The role of patient expectations in predicting outcome after total knee arthroplasty. Arthritis Res Ther. 2009;11:R139.
3. Scott CE, Bugler KE, Clement ND, MacDonald D, Howie CR, Biant LC. Patient expectations of arthroplasty of the hip and knee. J Bone Joint Surg Br. 2012; 94:974–81.
4. Mancuso CA, Graziano S, Briskie LM, Peterson MG, Pellicci PM, Salvati EA, Sculco TP. Randomized trials to modify patients’preoperative expectations of hip and knee arthroplasties. Clin Orthop Relat Res. 2008;466:424–31. 5. Culliton SE, Bryant DM, Overend TJ, MacDonald SJ, Chesworth BM. The
relationship between expectations and satisfaction in patients undergoing primary total knee arthroplasty. J Arthroplast. 2012;27:490–2.
6. Jain D, Nguyen LL, Bendich I, Nguyen LL, Lewis CG, Huddleston JI, Duwelius PJ, Feeley BT, Bozic KJ. Higher patient expectations predict higher patient-reported outcomes, but not satisfaction, in Total knee Arthroplasty patients: a prospective multicenter study. J Arthroplast. 2017;32:S166–70.
7. Barlow T, Clark T, Dunbar M, Metcalfe A, Griffin D. The effect of expectation on satisfaction in total knee replacements: a systematic review. Spring. 2016;5:167. 8. Kiran A, Bottomley N, Biant LC, Javaid MK, Carr AJ, Cooper C, Field RE,
Murray DW, Price A, Beard DJ, Arden NK. Variations in good patient reported outcomes after Total knee Arthroplasty. J Arthroplast. 2015;30: 1364–71.
9. Lingard EA, Sledge CB, Learmonth ID. Patient expectations regarding total knee arthroplasty: differences among the United States, United kingdom, and Australia. J Bone Joint Surg Am. 2006;88:1201–7.
10. Mahomed NN, Liang MH, Cook EF, Daltroy LH, Fortin PR, Fossel AH, Katz JN. The importance of patient expectations in predicting functional outcomes after total joint arthroplasty. J Rheumatol. 2002;29:1273–9.
11. Mancuso CA, Sculco TP, Wickiewicz TL, Jones EC, Robbins L, Warren RF, Williams-Russo P. Patients’expectations of knee surgery. J Bone Joint Surg Am. 2001;83-A:1005–12.
12. Noble PC, Scuderi GR, Brekke AC, Sikorskii A, Benjamin JB, Lonner JH, Chadha P, Daylamani DA, Scott WN, Bourne RB. Development of a new knee society scoring system. Clin Orthop Relat Res. 2012;470:20–32. 13. Razmjou H, Finkelstein JA, Yee A, Holtby R, Vidmar M, Ford M. Relationship
between preoperative patient characteristics and expectations in candidates for Total knee Arthroplasty. Physiother Can. 2009;61:38–45.
14. Vissers MM, de Groot IB, Reijman M, Bussmann JB, Stam HJ, Verhaar JA. Functional capacity and actual daily activity do not contribute to patient satisfaction after total knee arthroplasty. BMC Musculoskelet Disord. 2010;11:121. 15. Sullivan MJL, Bishop S, Pivik J. The pain Catastrophizing scale: development
and validation. Psych Asses. 1995;7:524–32.
16. Riddle DL, Keefe FJ, Ang D, Saleh KJ, Dumenci L, Jensen MP, Bair MJ, Reed SD, Kroenke K. A phase iii randomized three-arm trial of physical therapist delivered pain coping skills training for patients with total knee arthroplasty: the kastpain protocol. BMC Musculoskelet Disord. 2012;13:149.
17. Hepinstall MS, Rutledge JR, Bornstein LJ, Mazumdar M, Westrich GH. Factors that impact expectations before total knee arthroplasty. J Arthroplast. 2011;26:870–6. 18. Sullivan M, Tanzer M, Reardon G, Amirault D, Dunbar M, Stanish W. The role
of presurgical expectancies in predicting pain and function one year following total knee arthroplasty. Pain. 2011;152:2287–93.
19. Riddle DL, Wade JB, Jiranek WA, Kong X. Preoperative pain Catastrophizing predicts pain outcome after knee Arthroplasty. Clin Orthop Relat Res. 2009; 468:798–806.
20. Kroenke K, Strine TW, Spitzer RL, Williams JB, Berry JT, Mokdad AH. The PHQ-8 as a measure of current depression in the general population. J Affect Disord. 2008;114:163–73.
21. Callahan CM, Unverzagt FW, Hui SL, Perkins AJ, Hendrie HC. Six-item screener to identify cognitive impairment among potential subjects for clinical research. Med Care. 2002;40:771–81.
22. Lingard EA, Katz JN, Wright EA, Sledge CB. Predicting the outcome of total knee arthroplasty. J Bone Joint Surg Am. 2004;86-A:2179–86.
23. Bellamy N, Buchanan WW, Goldsmith CH, Campbell J, Stitt LW. Validation study of WOMAC: a health status instrument for measuring clinically important patient relevant outcomes to antirheumatic drug therapy in patients with osteoarthritis of the hip or knee. J Rheumatol. 1988;15:1833–40.
24. Bellamy N. The WOMAC knee and hip osteoarthritis indices: development, validation, globalization and influence on the development of the AUSCAN hand osteoarthritis indices. Clin Exp Rheumatol. 2005;23:S148–53. 25. Escobar A, Quintana JM, Bilbao A, Arostegui I, Lafuente I, Vidaurreta I.
Responsiveness and clinically important differences for the WOMAC and SF-36 after total knee replacement. Osteoarthr Cartil. 2007;15:273–80. 26. Sullivan M, Tanzer M, Stanish W, Fallaha M, Keefe FJ, Simmonds M, Dunbar
M. Psychological determinants of problematic outcomes following Total knee Arthroplasty. Pain. 2009;143:123–9.
27. Vissers MM, Bussmann JB, Verhaar JA, Busschbach JJ, Bierma-Zeinstra SM, Reijman M. Psychological factors affecting the outcome of total hip and knee arthroplasty: a systematic review. Semin Arthritis Rheum. 2012;41:576–88. 28. Mueller A, Hartmann M, Mueller K, Eich W. Validation of the arthritis
self-efficacy short-form scale in German fibromyalgia patients. Eur J Pain. 2003;7:163–71.
30. Katz JN, Chang LC, Sangha O, Fossel AH, Bates DW. Can comorbidity be measured by questionnaire rather than medical record review? Med Care. 1996;34:73–84.
31. Kroenke K, Spitzer RL, Williams JB, Monahan PO, Lowe B. Anxiety disorders in primary care: prevalence, impairment, comorbidity, and detection. Ann Intern Med. 2007;146:317–25.
32. Spitzer RL, Kroenke K, Williams JB, Lowe B. A brief measure for assessing generalized anxiety disorder: the GAD-7. Arch Intern Med. 2006;166:1092–7. 33. Cruz-Almeida Y, King CD, Goodin BR, Sibille KT, Glover TL, Riley JL, Sotolongo A,
Herbert MS, Schmidt J, Fessler BJ, Redden DT, Staud R, Bradley LA, Fillingim RB. Psychological profiles and pain characteristics of older adults with knee osteoarthritis. Arthritis Care Res (Hoboken). 2013;65:1786–94.
34. Arnold LM, Stanford SB, Welge JA, Crofford LJ. Development and testing of the fibromyalgia diagnostic screen for primary care. J Women's Health (Larchmt). 2012;21:231–9.
35. Eid M. A multitrait-multimethod model with minimal assumptions. Psychometrika. 2000;65(2):241–61.
36. Dave AJ, Selzer F, Losina E, Usiskin I, Collins JE, Lee YC, Band P, Dalury DF, Iorio R, Kindsfater K, Katz JN. The association of pre-operative body pain diagram scores with pain outcomes following total knee arthroplasty. Osteoarthr Cartil. 2016;25:667–75.
37. Wylde V, Bruce J, Beswick A, Elvers K, Gooberman-Hill R. Assessment of chronic postsurgical pain after knee replacement: a systematic review. Arthritis Care Res (Hoboken). 2013;65:1795–803.
38. Gunaratne R, Pratt DN, Banda J, Fick DP, Khan RJK, Robertson BW. Patient dissatisfaction following Total knee Arthroplasty: a systematic review of the literature. J Arthroplast. 2017;32:3854–60.
39. Voutilainen A, Pitkaaho T, Kvist T, Vehvilainen-Julkunen K. How to ask about patient satisfaction? The visual analogue scale is less vulnerable to confounding factors and ceiling effect than a symmetric Likert scale. J Adv Nurs. 2016;72:946–57.
40. Hawker GA, Badley EM, Borkhoff CM, Croxford R, Davis AM, Dunn S, Gignac MA, Jaglal SB, Kreder HJ, Sale JE. Which patients are most likely to benefit from total joint arthroplasty? Arthritis Rheum. 2013;65:1243–52. 41. Riddle DL, Perera RA, Stratford PW, Jiranek WA, Dumenci L. Progressing
toward, and recovering from, knee replacement surgery: a five-year cohort study. Arthritis Rheum. 2013;65:3304–13.
• We accept pre-submission inquiries
• Our selector tool helps you to find the most relevant journal • We provide round the clock customer support
• Convenient online submission • Thorough peer review
• Inclusion in PubMed and all major indexing services • Maximum visibility for your research
Submit your manuscript at www.biomedcentral.com/submit