retina
Luo
et al.
R E S E A R C H A R T I C L E
Open Access
Midkine-A functions upstream of Id2a to regulate
cell cycle kinetics in the developing vertebrate
retina
Jing Luo
1, Rosa A Uribe
2, Sarah Hayton
1, Anda-Alexandra Calinescu
1, Jeffrey M Gross
2and Peter F Hitchcock
1*Abstract
Background:Midkine is a small heparin binding growth factor expressed in numerous tissues during development.
The unique midkine gene in mammals has two paralogs in zebrafish:midkine-a(mdka) andmidkine-b(mdkb). In the
zebrafish retina, during both larval development and adult photoreceptor regeneration,mdkais expressed in retinal stem and progenitor cells and functions as a molecular component of the retina’s stem cell niche. In this study, loss-of-function and conditional overexpression were used to investigate the function of Mdka in the retina of the embryonic zebrafish.
Results:The results show that during early retinal development Mdka functions to regulate cell cycle kinetics. Following targeted knockdown of Mdka synthesis, retinal progenitors cycle more slowly, and this results in microphthalmia, a diminished rate of cell cycle exit and a temporal delay of cell cycle exit and neuronal differentiation. In contrast, Mdka overexpression results in acceleration of the cell cycle and retinal overgrowth. Mdka gain-of-function, however, does not temporally advance cell cycle exit. Experiments to identify a potential Mdka signaling pathway show that Mdka functions upstream of the HLH regulatory protein, Id2a. Gene expression
analysis shows Mdka regulatesid2aexpression, and co-injection of Mdka morpholinos andid2amRNA rescues the
Mdka loss-of-function phenotype.
Conclusions:These data show that in zebrafish, Mdka resides in a shared Id2a pathway to regulate cell cycle kinetics in retinal progenitors. This is the first study to demonstrate the function of Midkine during retinal development and adds Midkine to the list of growth factors that transcriptionally regulate Id proteins.
Keywords:Proliferation, Growth factors, Signaling pathways
Background
Neurogenesis relies on the coordinated interplay of in-trinsic and exin-trinsic mechanisms that determine the spatial and temporal patterns of proliferation, initiate cell cycle exit, fix cell identities, and govern differenti-ation. The vertebrate retina is a long-standing model for investigating the mechanisms that govern developmental neurogenesis [1]. The retina has a limited number of cell types arrayed in evolutionarily highly conserved spatial patterns and functional circuits, and experimental altera-tions of retinal development are easy to detect by simple microscopic inspection. Cell-extrinsic signals govern
retinal development by modulating intrinsic signals that can drive self-renewal, cell cycle exit, and differentiation. For example, growth factors at the midline divide the early eye field into two retinal anlagen that express unique combinations of transcription factors [2], and signaling centers both outside and inside the eye pattern the optic vesicle and initiate cell cycle exit and neuronal differentiation [1].
Midkine is a secreted heparin binding growth factor with a molecular weight of 13 kDa that is a member of the midkine/pleiotrophin family of growth factors [3]. Midkine is highly conserved among vertebrates and plays an impor-tant role in both development and disease. In mammals, midkine is highly expressed during embryogenesis, and down-regulated at birth. In the mammalian central nervous system (CNS), the expression ofmidkineis temporally and
* Correspondence:[email protected] 1
Department of Ophthalmology and Visual Sciences, University of Michigan, W. K. Kellogg Eye Center, 1000 Wall Street, Ann Arbor, MI 48105-0714, USA Full list of author information is available at the end of the article
spatially regulated in a manner that suggests it functions to govern aspects of neurogenesis [3-7], although this has not been experimentally tested.
The unique midkine gene in mammals has two para-logs in zebrafish: midkine-a (mdka) and midkine-b (mdkb). In zebrafish, the two sub-functionalized genes have non-overlapping patterns of expression and inde-pendent biological functions [8-11]. In the embryonic and larval retina of zebrafish, mdka is expressed in ret-inal progenitors, but immediately down-regulated in these cells as they exit the cell cycle. During photorecep-tor regeneration in the adult retina, both mdka and mdkb are up-regulated in Müller glia as these cells re-enter the cell cycle and adopt the features of retinal stem cells [10].
Here we establish that Mdka controls the cell cycle kinetics of retinal progenitors in the embryonic retina of zebrafish and functions upstream of the intrinsic HLH regulatory protein, Id2a. Following targeted knockdown of Mdka synthesis, retinal progenitors progress more slowly through the cell cycle, and this gives rise to microphthalmia, a diminished rate of cell cycle exit and delay of neuronal differentiation. In contrast, Mdka overexpression results in acceleration of the cell cycle and a transient retinal overgrowth, but Mdka gain-of-function does not temporally advance cell cycle exit. Gene expression analysis shows that Mdka regulates id2aexpression, and co-injection experiments show that
id2a mRNA rescues morpholino-induced Mdka
loss-of-function. These data demonstrate that in the develop-ing vertebrate retina the Mdka/Id2a pathway functions to regulate cell cycle kinetics and identifies Mdka as an extrinsic regulator of neurogenesis in the vertebrate central nervous system.
Results
Mdka knockdown transiently blocks neuronal differentiation
To inhibit Mdka synthesis, two non-overlapping mdka morpholinos (MO1, MO2; Figure 1A) were used. Con-trol morpholinos contained five mismatched nucleotides (MM1, MM2; Figure 1A). At 48 hours post fertilization (hpf ), embryos injected with themdka-targeted morpho-linos are indistinguishable from controls with respect to body size and shape, though experimental embryos dis-play a mild, but statistically significant decrease in eye size (Figure 1B; uninjected (UI) vs. Mdka morpholinos,
P=0.0002; MM morpholinos vs. Mdka morpholinos,
P=0.001). Both MO1 (4 ng/embryo) and MO2 (5 ng/
embryo) produced similar retinal phenotypes, and the specific suppression of Mdka protein synthesis was con-firmed for MO1 (Figure 1C). All Mdka knockdown experiments presented here were performed using MO1.
Figure 1Mdka-targeted morpholinos inhibit Mdka synthesis and delay neuronal differentiation. (A)Sequences of the two morpholino oligos (MO1, MO2) and the respective mismatch (MM) controls used in this study.(B)Representative embryos from the control and experimental groups at 48 hours post fertilization (hpf).
Sections taken through the retinas revealed that at 48 hpf knockdown of Mdka results in small retinas, the absence of lamination and few overtly differentiated cells, which was confirmed using the antibody markers, zn5, zn12, and HPC1, which label inner retinal neurons (Figure 1D). Interestingly, however, the absence of neuronal differentiation (and lamination) was transient. Through 56 hpf, there was little neuronal differentiation following Mdka loss-of-function, whereas, by 72 hpf, even though western blot analysis showed that Mdka synthesis remains inhibited (data not shown), experi-mental retinas were largely normal with respect to the lamination and neuronal differentiation (Figure 1E).
Mdka loss-of-function does not delay the onset of a neurogenic program or increase cell death
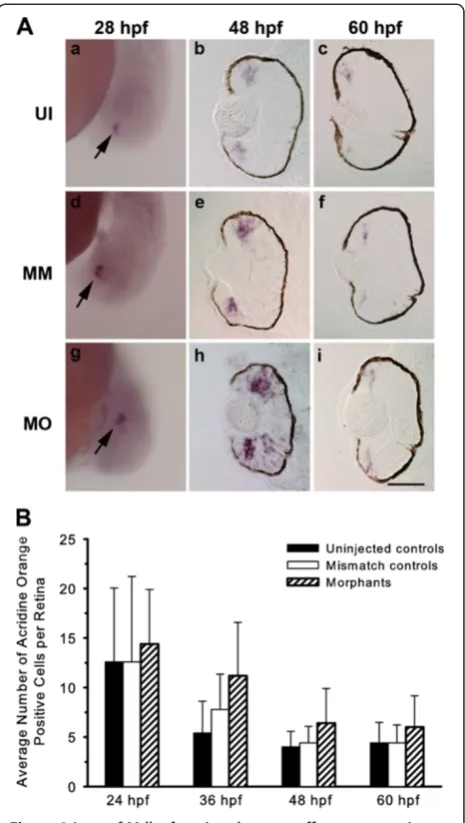
The delayed neuronal differentiation resulting from Mdka loss-of-function could result from four mechan-isms, alone or in combination: (1) delay in the onset of the developmental neurogenic program; (2) apoptosis of newly post mitotic cells; (3) normal cell cycle exit but failure to differentiate; or (4) lengthening of the cell cycle, resulting in a temporal delay in cell cycle exit and, consequently, an absence of neuronal differentiation. In the vertebrate retina, the proneural gene atoh7 (previ-ously designated ath5) is an intrinsic timer required to initiate neurogenesis. The onset of expression of atoh7 was used to test whether or not the loss of Mdka alters the initiation or maintenance of genetic programs required for neuronal differentiation. In zebrafish, ex-pression ofatoh7begins at approximately 25 hpf, within ventral-temporal retina and then expands through the retina as a wave spreading in a dorso-nasal direction, marking cells that are competent to exit the cell cycle and differentiate [12,13]. In situ hybridization analysis showed that the timing of the onset ofatoh7expression is not altered in experimental embryos (Figure 2A, a-i), indicating that the absence of neuronal differentiation following Mdka knockdown does not result from simply delaying the onset of genetic programs that endow neurogenic competence. Further, the initial broad expression domain ofatoh7[13] persists following Mdka knockdown (Figure 2A, h) whereas in control embryos atoh7 mRNA becomes restricted to progenitors at the retinal margin (Figure 2A b,e). The persistence of the broad atoh7 expression domain in the experimental retinas reflects the absence of cellular differentiation following Mdka knockdown and the neurogenic compe-tence these cells retain (Figure 2A, h; see below).
Cell death in the developing zebrafish retina is nor-mally very low [14]. The DNA-binding vital dye, acridine orange, was used to label pyknotic nuclei of dying cells in control and experimental embryos between 24 hpf and 60 hpf. Counts of acridine orange-labeled nuclei
showed no significant differences in the number of dying cells in the retinas of control and experimental animals (Figure 2B). Terminal deoxynucleotidyl transferase dUTP nick end labeling (TUNEL) was also used to mark cells undergoing apoptosis, and no significant differences were observed in the number of TUNEL-positive cells in control and experimental groups (data not shown).
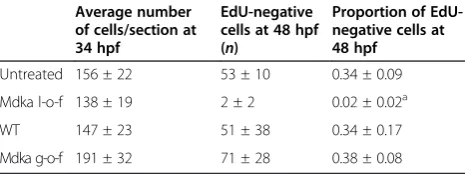
To test whether or not following knockdown of Mdka cells exit the cell cycle on time but merely fail to differ-entiate, embryos were given multiple injections of EdU between 34 hpf and 48 hpf and sacrificed at 48 hpf. DAPI-positive/EdU-negative (post-mitotic) cells were then counted in representative sections from experimen-tal and control embryos (n=10 embryos/group) and averaged to determine the relative proportion of cells that had exited the cell cycle at 34 hpf prior to the avail-ability of the EdU (see [15]). This analysis showed that relative to controls, following knockdown of Mdka, sig-nificantly fewer cells exit the cell cycle at 34 hpf (Table 1). This result indicates that loss of Mdka func-tion does not delay neuronal differentiafunc-tion, but, rather, alters the timing of cell cycle exit.
Mdka loss-of-function alters cell cycle kinetics
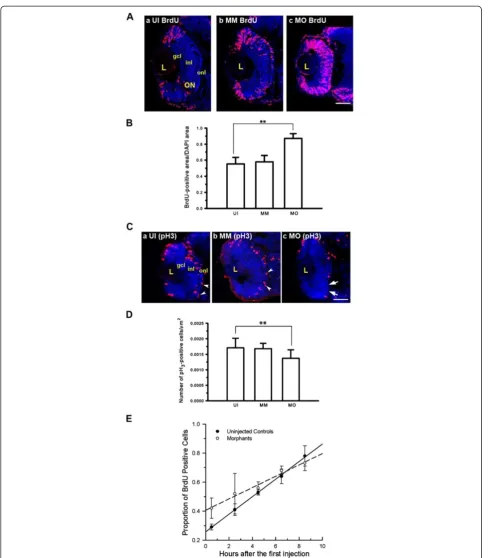
The absence of both neuronal differentiation and the normal timing of cell cycle exit imply that Mdka func-tions to control cell cycle kinetics. Therefore, a variety of approaches were used to evaluate cell proliferation and cell cycle kinetics among the retinal progenitors. This was investigated first by providing a brief systemic pulse of BrdU at 48 hpf and evaluating the spatial distribution and proportion of labeled cells immediately thereafter (Figure 3A). In control retinas the majority of proliferat-ing cells are within the marginal germinal zone, and the proportion of the retina occupied by proliferating cells is low. In embryos injected with control morpholinos, there were extra BrdU-labeled cells in the central retina, and we interpret this to be a consequence of a simple developmental delay resulting from the injection proce-dures and/or presence of the morpholinos [16]. In con-trast to control retinas, in the absence of Mdka function, at 48 hpf BrdU-labeled progenitors are present through-out the retina (Figure 3B), indicating that in central retina progenitors fail to exit the cell cycle at the appro-priate developmental stage.
To further investigate the change of cell cycle kinetics following loss of Mdka function, the mitotic status of retinal progenitors was measured by counting progeni-tors labeled with antibodies that recognize the phos-phorylated form of histone H3 (pH3), a marker specific
for cells in the M-phase of the cell cycle (Figure 3C). In vertebrate retinas, cells undergo mitosis at the outermost (apical) surface of the retina, and this spatial pattern of pH3 labeling did not differ in control and experimental
retinas. However, the proportion of pH3-positive cells in
retinas lacking Mdka was significantly reduced relative to controls (Figure 3D).
To estimate the length of the cell cycle and the dur-ation of the relative S-phase, we employed a cumulative BrdU labeling method [17]. This method provides a sus-tained systemic dose of BrdU and labels all cells passing through the S-phase of the cell cycle. BrdU was injected into the yolk at 2-h intervals beginning at 26 hpf, for 8-h. At 120-min intervals, three to four embryos from each group were removed, fixed, and the proportion of BrdU labeled cells was determined and plotted as a func-tion of time. A linear regression was then fitted to these data. The slope and y-intercept of the best-fit lines were used to estimate the total length of the cell cycle and the relative duration of the S-phase, respectively. This ana-lysis showed that the total length of the cell cycle was significantly longer for retinal progenitors following Mdka loss of function (21.50 h vs. 15.0 h; Figure 3E), and this could be accounted for largely by an increase in the duration of the S-phase (8.75 hvs.4.10 h). Together, the pulse and cumulative BrdU labeling assays suggest that following knockdown of Mdka, retinal progenitors cycle more slowly, fail to exit the cell cycle at the appro-priate developmental stage, and this results in the transi-ent delay in neuronal differtransi-entiation.
Mdka overexpression produces retinal overgrowth
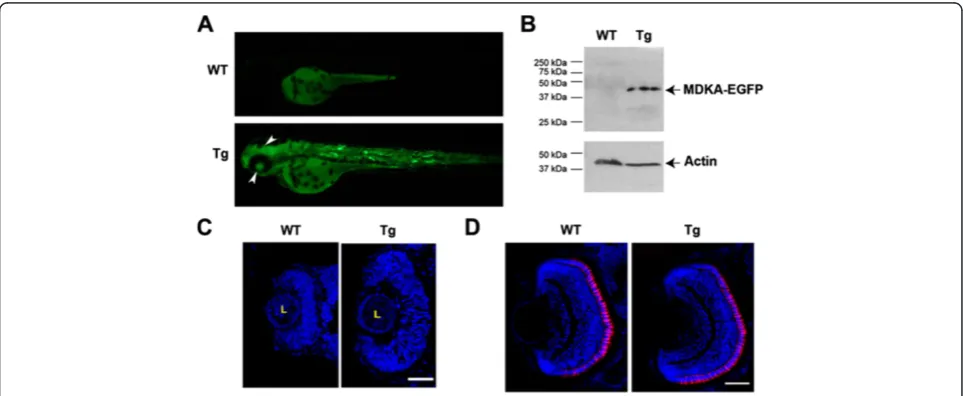
Transgenic fish were generated to conditionally induce Mdka overexpression in vivo. Three lines (kec1001L3, kec1004L4, kec1004L6) were identified that showed germ line transmission of the inducible mdka/egfp con-struct (pHSP70/4:mdka:egfp). When subjected to heat shock at 24 hpf, the Mdka-GFP fusion protein was visible in transgenic animals within 2 h, and wild-type, hemizygous, and homozygous offspring were easily dis-tinguished based on GFP fluorescence intensity. Fluores-cence imaging over time and western blot analysis using the anti-GFP antibody (the Mdka antibody does not recognize the fusion protein) demonstrated that the Mdka fusion protein is stable in transgenic embryos for at least 48 h (Figure 4A, B). Consistent with our model that Mdka governs cell cycle kinetics, Mdka gain-of-function in early embryos resulted in a marked retinal overgrowth (Figure 4C). Interestingly, similar to the
Table 1 Gain of Mdka function does not advance cell cycle exit
Average number of cells/section at 34 hpf
EdU-negative cells at 48 hpf (n)
Proportion of EdU-negative cells at 48 hpf
Untreated 156 ± 22 53 ± 10 0.34 ± 0.09
Mdka l-o-f 138 ± 19 2 ± 2 0.02 ± 0.02a
WT 147 ± 23 51 ± 38 0.34 ± 0.17
Mdka g-o-f 191 ± 32 71 ± 28 0.38 ± 0.08
results from Mdka loss-of-function, the retinal over-growth observed in early embryos was also transient and largely resolved by 72 hpf (Figure 4D).
Mdka levels alter the length of the G2 phase of the cell cycle
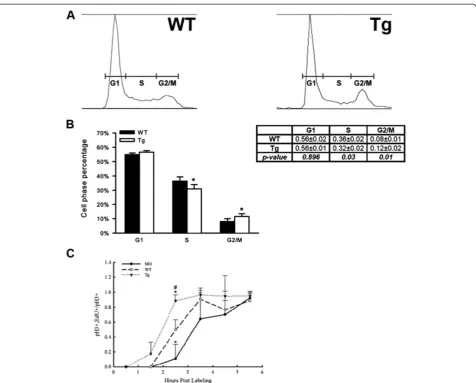
To directly evaluate cycling progenitors following Mdka gain-of-function, FACS DNA-content analysis was used to quantify the proportion of cells that occupy each phase of the cell cycle. This was performed at 30 hpf (6 h after heat shock), when the vast majority of retinal progenitors are still proliferating and the retina lacks post-mitotic cells [14]. Although cells from the forebrain and non-neuronal cells surrounding the head and eyes are included in this assay, the FACS analysis showed that Mdka gain-of-function results in a statistically significant decrease in the proportion of cells in the S-phase, which was accompanied by a significant increase in the propor-tion of cells in G2/M. The proporpropor-tion of cells in the G1-phase was unchanged (Table 1; Figure 5A, B).
Analyzing DNA content provides only the relative pro-portion of cells in each phase of the cell cycle. Therefore, the percent labeled mitoses paradigm (PLM; [18]) was used to complement the FACS analysis and directly measure the length of the G2-phase of the cell cycle among retinal progenitors. These experiments were performed using embryos subjected to heat shock at 24 h, sorted by genotype and evaluated between 28 hpf and 34 hpf. Due to the nature of this experiment, we were
able also to include embryos injected with mdka
morpholinos in the PLM analysis. As anticipated, the percentage of pH3/EdU double-labeled nuclei increased
sigmoidally with time, demonstrating that the experi-mental treatments did not affect the ability of dividing cells to progress from the S- to M-phase of the cell cycle. Further, qualitative observations showed that as progenitors progress through G2 they physically moved from the inner retina to the apical surface, where they become coincident with pH3-positive cells [19]. Al-though variable, the data also showed a significant differ-ence between the three groups at the 2.5-h time point, where nearly 100% of the progenitors with elevated Mdka had completed G2, compared to only approxi-mately 10% of the progenitors in retinas lacking Mdka (Figure 5C). The values for wild-type cells were inter-mediate between these two. These data show directly that Mdka levels regulate progression from S- to M-phase of the cell cycle. The acceleration of the cell cycle following gain of Mdka function both accounts for the retinal overgrowth resulting from Mdka gain-of-function (Figure 4C) and is complementary to the consequences of Mdka loss-of-function (see above).
In an effort to explore the molecular mechanisms through which Mdka governs cell cycle kinetics, we used in situ hybridization to evaluate the relative expression levels of core cell cycle components, the cyclin genes, B1, D1, E1, and the CDK gene,p27 [20,21]. There were no apparent differences in the relative expression levels or tissue distribution of these genes among untreated, loss-of-function, or gain-of-function embryos (data not
shown), suggesting that Mdka does not modulate the duration of the cell cycle by directly regulating the expression of cell cycle kinases or kinase inhibitors.
Gain of Mdka function does not advance cell cycle exit
Experiments were undertaken next to determine if elevating Mdka levels also accelerates cell cycle exit. Clutches from hemizygous transgenic crosses were trea-ted by heat shock at 24 hpf, sortrea-ted into wild-type and homozygous transgenic groups, given multiple injec-tions of EdU between 34 hpf and 48 hpf, and sacrificed at 48 hpf. DAPI-positive/EdU-negative (post-mitotic) cells were counted and averaged to determine the relative pro-portion of cells that had exited the cell cycle at 34 hpf prior to the availability the EdU (see [15]; see above). The average number of cells/retinal section was greater
following Mdka gain-of-function, reflecting the early retinal overgrowth. However, elevating Mdka levels did not significantly increase the proportion of post mitotic (EdU-negative) cells over wild-type controls at 34 hpf (34% ± 17%vs.38% ± 9%; Table 1), demonstrating that the Mdka-induced acceleration of the cell cycle does not also temporally advance cell cycle exit.
Mdka functions upstream of the HLH regulatory protein Id2a
The observations from the Mdka gain- and loss-of-function experiments strongly resemble data reported recently following gain- and loss-of-function of the HLH protein, Id2a [22]. In the early larval retina of zebrafish, Id2a is expressed in retinal progenitors where it functions as a non-cell autonomous regulator of cell cycle kinetics.
Figure 5Mdka gain-of-function accelerates the cell cycle. (A)Representative raw data from FACS sorting of neural progenitors at 30 hpf.
Knockdown of Id2a lengthens the cell cycle, delays neur-onal differentiation, and produces microphthalmia, whereas Id2a over-expression accelerates the cell cycle, leading to
retinal overgrowth. The phenotypes associated with the gain and loss of Id2a persist through 72 hpf [22]. Gene expression studies were performed with embryos at 28 hpf
to determine if there is a genetic relationship between Mdka and Id2a. First, mdka expression was evaluated by in situ hybridization following both the loss and gain of Id2a function. Altering Id2a levels did not alter mdka hybridization signal (data not shown). Second,id2a expres-sion was evaluated byin situhybridization following Mdka gain- and loss-of-function. For this experiment, the color reactions were stopped simultaneously for each group at a point where differences in the signal intensity between loss- and gain-of-function embryos became distinct. This resulted in an apparent incomplete pattern ofid2a expres-sion in the control embryos (Figure 6A). However, in an independent experiment, it was confirmed that using the same riboprobe and developing the color reaction to a suf-ficient degree recapitulates the expression pattern specific for id2a (Figure 7; cf. Figure 3 in Thisseet al., 2004 [23]). The comparativein situhybridization analysis showed that relative expression ofid2ais markedly reduced or lost fol-lowing Mdka knockdown, whereas, relativeid2aexpression is increased following Mdka overexpression (Figure 6A). Third, quantitative Reverse Transcriptase-PCR (qRT-PCR) was performed on mRNA isolated from heads of embryos at 28 hpf following Mdka gain- and loss-of-function. This analysis showed that Mdka knockdown resulted in a 1.75-fold decrease in the expression of id2a(MM morpholinos vs.Mdka morpholinos,P=0.03), whereas Mdka overexpres-sion resulted in a 5.14-fold increase in the expresoverexpres-sion of id2a(WT-heat shockvs.Tg-heat shock,P=0.018). Collect-ively, these data were interpreted to show that in the zebra-fish retina Mdka functions upstream of Id2a and that Mdka levels govern the expression ofid2a. To further test this model, Mdka morpholinos andid2amRNA were co-injected into embryos and proliferation and neurogenesis in the retinas were analyzed. These experiments showed Id2a overexpression is sufficient to restore normal retinal development following Mdka knockdown.id2arescues the microphthalmia (Figure 6B), restores the number of retinal cells to control levels (Figure 6C-E), and restores the nor-mal timing of cellular differentiation (data not shown). These data show that in the zebrafish retina Mdka and Id2a function within a common signaling pathway that regulates retinal development.
Discussion
Mdka regulates cell cycle kinetics
Precisely regulated cell proliferation is a fundamental de-terminant of organ growth. Both intrinsic and extrinsic signaling molecules govern the kinetics of proliferation and the timing of re-entry into or exit from the cell cycle [24]. Relatively few studies have directly addressed the role of Midkine in governing cell cycle kinetics. During fetal CNS development, Midkine is necessary to main-tain the M-phase of neural progenitor cells [25], and transfection of drug-sensitive cells with the midkine
gene releases the drug-induced proliferation arrest and allows cells to progress through the S-phase [26]. More recently, midkine was shown to promote the growth of murine embryonic stem cells by preventing apoptosis and inducing the G1-S phase transition [7], and an in vitroassay showed that neurospheres from Mdka defi-cient mice are significantly smaller than those from wild types [27]. The earlier study from our lab showing that mdka is expressed in retinal progenitors [10] led to the hypothesis that in the zebrafish retina Mdka functions to regulate aspects of neurogenesis. We used loss- and gain-of-function approaches and assays of proliferation and cellular differentiation to test this hypothesis. The resulting data showed that Mdka functions in retinal progenitors to regulate kinetics of the cell cycle. Loss of Mdka significantly increases the duration of the cell cycle, which is manifested by a decreased number of mi-totic cells and microphthalmia. Complementing these results, Mdka overexpression significantly accelerates the cell cycle, leading to a retinal overgrowth. Further, while both morpholino-induced knockdown and induced overexpression of Mdka synthesis persists until at least 72 hpf, the knockdown phenotype observed at 48 hpf was recovered by 60 hpf and the induced retinal overgrowth is largely resolved by 72 hpf. These data suggest that Mdka function in the embryonic retina predominates only during a relatively brief temporal window and during this time functions narrowly to govern cell cycle kinetics. Numerous extrinsic molecules regulate proliferation of vertebrate retinal progenitors, including Notch, FGF, BMP, Wnt, and HH (reviewed in [1]). Mdka can now be
added to this list. Finally, midkine was identified as a component in the core transcriptional repertoire of mi-totic progenitors in the mammalian retina and brain [4]. In light of these data, we propose that in the vertebrate central nervous system Midkine is a component of the complex environment of extrinsic regulatory molecules (for example [24]) that functions, perhaps in an autocrine manner, to regulate developmental neurogenesis.
Mdka does not directly govern cell fate determination or neuronal differentiation
Lineage studies show that retinal progenitor cells give rise to neuronal and glial cell types in a characteristic order of birth [15,28,29]. Whereas Mdka knockdown slows the onset of neuronal differentiation, overexpres-sion of Mdka does not advance cell cycle exit. These data suggest that the delay in neuronal differentiation following Mdka loss-of-function is a consequence of slowing the cell cycle, and Mdka does not normally function to promote neurogenesis. Similarly, Mdka gain-of-function accelerates the cell cycle, but does not also advance cell cycle exit and neurogenesis. The non-correlated effects between cell cycle regulation and cell-fate determination were also observed in the retina of disarrayed mutant zebrafish [30]. These observations, along with the data from our experiments, suggest that Mdka functions, perhaps narrowly, to regulate cell cycle kinetics without influencing cell fate specification or cellular differentiation. This stands in contrast to other intrinsic and extrinsic regulatory molecules, which have been shown both to coordinate cell cycle progression and cell fate determination [1].
Mdka functions upstream of Id2a
The striking similarity in the data regarding Mdka tion and those published recently describing the func-tion of the protein, Id2a [22], led us to investigate the potential genetic relationship between Mdka and Id2a. Id (inhibitor of differentiation) proteins are intrinsic components of signaling pathways that function as posi-tive regulators of cell cycle progression in neuronal pro-genitors [31] and key mediators of tumor progression in transformed cells [32,33]. Id proteins lack a basic, DNA-binding domain, and heterodimers formed between Ids and bHLH transcription factors cannot bind DNA or form active dimers (see [32]). Similar to Mdka, in zebra-fish retinal progenitors, Id2a modulates S-phase progres-sion and/or the S- to M-phase transition [22]. Loss of Id2a function lengthens the cell cycle, leading to micro-phthalmia and an absence of neuronal differentiation, whereas gain of Id2a function shortens the cell cycle, leading to retinal overgrowth. The similarities of the
Mdka and Id2a functional studies suggested the
hypothesis that in the retina Mdka and Id2a function in a shared development pathway.
Gene expression analysis and mRNA rescue experi-ments showed that in the developing retina Mdka func-tions upstream of Id2a within a common signaling pathway. Mdka is required for sustainedid2aexpression, and Mdka gain-of-function is sufficient to increase the transcription ofid2a. Id2a has previously been shown to regulate retinoblast cell cycle kinetics, therefore, these data suggest that Mdka functions through Id2a to gov-ern cell cycle control in the embryonic retina. This was confirmed by experiments showing that overexpression of id2a was sufficient to restore cell division and eye growth to normal levels following Mdka loss-of-function. In the developing retina of mammals, Bmp signaling is upstream of Id expression. In the retina, BMPs promote differentiation of retinal progenitors, and altering BMP4 upregulates the expression of multiple Id proteins [34]. The current study demonstrates that Mdka also modulates Id gene expression and suggests, therefore, that in the mammalian retina and brain Mid-kine may also be a component of signaling events mediated by Id proteins.
down-regulates the expression ofid2ain retinal progeni-tors, which potentially disconnects Mdka-id2asignaling. This raises the possibility that Mdka/Id2a signaling func-tions in the early retina only. When these two signaling proteins are decoupled by differential patterns of expres-sion, cellular differentiation may occur even in the absence of Mdka.
Conclusions
The zebrafish genome encodes two Midkine paralogs, mdka and mdkb[8]. The potential role for Mdka in the retina was identified in a screen for genes in zebrafish retina that are up-regulated following photoreceptor death and during stem cell-based photoreceptor regener-ation [10]. In the embryonic and larval CNS, the two midkine paralogs are differentially regulated, and each exhibits distinct temporal and spatial patterns of cellular expression [8,10]. Interestingly, in the retina, the expres-sion of both midkine paralogs is induced in the intrinsic stem cells, Müller glia, as they re-enter the cell cycle in preparation for regenerative neurogenesis [10]. In the present study, we showed that in the embryonic retina of zebrafish Mdka functions to regulate cell cycle kinet-ics in retinal progenitors and this function is mediated through the transcriptional regulation of id2a. These
data for the embryonic retina suggest that the Mdka/ Id2a pathway may also function during the stem cell-based neuronal regeneration in the adult zebrafish retina.
Methods Reagents
Nitrocellulose membranes, mouse anti-HPC-1, anti-goat peroxidase-conjugated secondary antibodies, propidium iodide (PI), and bromodeoxyuridine (BrdU) were pur-chased from Sigma (St. Louis, MO, USA). Anti-zpr1, anti-zpr3, anti-zn12, and anti-zn5 antibodies were pur-chased from the Zebrafish International Resource Center (ZIRC, Eugene, OR, USA). TOPRO3, Alexa Fluor 555 goat rabbit IgG antibody, Alexa Fluor 555 goat anti-mouse IgG antibody, Alexa Fluor 488 goat anti-rabbit IgG antibody, the MultiSite Gateway Three-Fragment Vector Construction Kit, Click-it EdU Alexa Fluor 555 Imaging Kit, and trypsin were purchased from Invitro-gen (Carlsbad, CA, USA). Rabbit anti-phosphohistone 3 (pH3) antibodies were purchased from Millpore (Billerica,
MA, USA). Mouse anti-BrdU antibody was purchased from BD Biosciences (Franklin Lakes, NJ, USA).
Experimental animals
AB strain zebrafish were purchased from Aquatic Tropi-cals Inc. (Bonita Springs, FL, USA) and housed at 28.5°C on a 14/10-h light/dark cycle. Embryos were collected after natural spawns, incubated at 28.5°C and staged by hpf [36].
Morpholino oligo and mRNA injections
For loss-of-function experiments, two morpholino oligos (Gene Tools, LLC, Cowallis, OR, USA) were used that were targeted to non-overlapping sequences in proximity to the translation start site of the zebrafishmdkamRNA (NCBI Reference Sequence: 131070.2). Control morpho-linos contained a 5-nucleotide mismatch. Morphomorpho-linos were diluted in 1× Danieau buffer [16] at 1 mg/mL, and embryos were injected with 2 ng to 5ng of morpholinos at the 1- to 8-cell stage.
For the mRNA rescue injections, 80 pg ofid2amRNA in a pCS2-id2a vector was co-injected with 5 ng of Mdka morpholino (see [22]).
Western blot analysis
Mdka and GFP were detected in western blots using techniques described previously [9]. Proteins were extracted from pools of 15 to 20 embryos by lysing the embryos in buffer with protease inhibitors (Complete Mini, Roche, Germany). Proteins were separated in a 12% SDS-PAGE gel and transferred to a nitrocellulose membrane. The membrane was blocked in 5% non-fat dry milk in PBS for 2 h and incubated with rabbit
Mdka antibody (1:300; [9]) or rabbit anti-GFP antibody (1:500, Abcam, Cambridge, MA, USA). Blots were rinsed with PBS and incubated with goat horseradish peroxidase-conjugated secondary IgG (1:5,000) for 1 h. Bound anti-bodies were visualized using the enhanced chemilumines-cence assay (ECL detection system, Amersham Biosciences, Arlington Heights, IL, USA). As loading controls, blots were stripped and incubated with anti-actin (1:1,000, Calbiochem, Germany).
Immunohistochemistry
Embryos were fixed overnight in 4% paraformaldehyde dissolved in 100 mM phosphate buffer, cryoprotected by infiltration in 20% sucrose in phosphate buffer, and frozen in Optimal Cutting Temperature (OCT) media. Cryosections at 7 to 10 μm in thickness were mounted on glass slides and processed for immunohistochemistry using standard procedures. Briefly, after drying, sections were incubated with 20% normal sheep serum in phos-phate buffered saline and 0.5% triton X-100 (PBST), followed by overnight incubation at 4°C with primary antibodies. After washing with PBST, sections were incu-bated in secondary antibodies for 1 h at room temperature, washed extensively in PBST. Sections were counterstained with 1:1,000 dilution of DAPI to label nuclei and sealed with mounting media and glass coverslips.
Systemic labeling with BrdU or EdU
Proliferating cells were labeled with either BrdU or EdU by soaking embryos for 20 min in ice-cold 5 mM BrdU or 1.5 mM EdU dissolved in embryo rearing solution containing 15% DMSO. For BrdU staining, sections were incubated in 4 N HCl and immunolabeled using a mouse anti-BrdU antibody that was visualized with goat anti-mouse IgG antibodies conjugated to Alexa Fluor 555 [37]. EdU was visualized using the Click-iT™ EdU imaging kit with Alex Fluor 555 according to the manu-facturer’s protocol.
In situhybridization
In situ hybridization on retinal sections was performed using digoxigenin (DIG)-labeled riboprobes, synthesized as previously described [37]. Briefly, sections were hybri-dized with probes overnight at 55°C. The next day, the sections were washed and incubated with an alkaline-phosphatase-conjugated anti-DIG antibody overnight at 4°C. After washing, riboprobes were visualized using 4-nitrobluetetrazolium/5-bromo-4-chloro-3-indolyl phos-phate (NBT/BCIP; Roche, Indianapolis, IN, USA) solution as the enzymatic substrate (Roche).
For whole mountin situ hybridizations, embryos were fixed in 4% paraformaldehyde, dehydrated in methanol and stored at -20°C for a minimum of 12 h. Embryos
were then returned to room temperature, rehydrated, fixed again in 4% paraformaldehyde, permeabilized with 0.1 M proteinase K, fixed a third time in 4% paraformal-dehyde, treated with acetic anhydride, and washed in PBS with 0.1% Tween. Embryos were next washed in pre-hybridization buffer, which was removed and replaced with 500 μL of hybridization solution contain-ing 200 ng of probe. Embryos were hybridized overnight at 55°C. The next day, embryos were washed and the digoxigenin was detected using antibodies conjugated to alkaline-phosphatase and a colorimetric reaction with NBT/BCIP as the enzymatic substrate. Embryos were transferred to single concavity slides for inspection and photomicroscopy.
Acridine orange labeling
Apoptotic nuclei were visualized by labeling live embryos with the vital exclusion dye, acridine orange. At 24 hpf, embryos were transferred to 0.003% 1-phenyl -2-thiourea (PTU) to block melanin synthesis. At various ages, embryos were then dechorionated and placed in acridine orange solution (5 μg/mL in embryo medium; Molecular Probes, Eugene, OR, USA) for 15 min fol-lowed by extensive washes in embryo medium. Embryos were lightly anesthetized and viewed under a fluores-cence dissecting scope, and acridine orange-positive cells were counted.
Transgenic lines
The Gateway-basedTol2kit system was used to generate transgenic fish [38]. Mdka cDNA (pCS2p-mdk1; a gift from C. Winkler), was PCR-amplified with primers containing an attB1 site on the forward primer and a reverse attB2 site on the reverse primer. The sequence of these primers is as follows: Forward: 50GGGGACAA GTTTGTAC A A A A A AGCAGGCTGTATGCGGGGCC
TGTTTTCCACC 30; Reverse: 50GGGGACCACTTTGT
ACAAGAAAGCTGGGTCGTTCCCTTTCCCCTTGCC TT 30. The purified PCR products with added att sites were used immediately in BP reactions to generate mid-dle entry clones. Multisite recombination reactions were performed to generate the pHSP70/4:mdka:egfp expres-sion construct.
used to propagate stable (Tg(pHSP70/4:mdka:egfp)) lines. These lines were characterized and found to yield approximately 50% GFP-positive progeny when mated to wild-type AB fish, suggesting a single Tol2 insertion. One transgenic line, Tg(pHSP70/4:mdka:egfp)kec1001L3, was used for all of the data presented here.
Flow cytometry
Embryos were collected from pairwise, hemizygous x hemizygous matings and treated by heat shock (37°C for 60 min) at 24 hpf. Wild-type and homozygous trans-genic embryos were identified at 26 hpf by the absence or presence and relative intensity of GFP. At 30 hpf, 50 heads (forebrains and eyes) from each group were isolated and washed twice in ice-cold PBS and dissociated into single-cell suspensions in 5 mL of ice-cold 0.25 mg/mL trypsin solution for 10 min at room temperature. Cells were fixed in ice-cold 70% ethanol for 30 min and stained with propidium iodide. DNA content for the isolated cells was analyzed on a FACScan II (Becton-Dickinson), and histograms of DNA content were acquired by CellQuest (BD Biosciences) and MODFIT LT (Verity Software House, Topsham, ME, USA).
Cumulative BrdU labeling
To estimate the total length of the cell cycle and the length of the S-phase, a cumulative BrdU labeling approach was used [17,40]. BrdU was injected into the yolk at 2-h intervals beginning at 26 hpf, which provides a sustained systemic dose of BrdU and labels all cells passing through the S-phase of the cell cycle. At 30 min after each injection, three to four embryos from each group were removed, dechorionated, and fixed for BrdU immunohistochemistry. At each time point, DAPI- and BrdU-labeled nuclei were counted in retinal sections, and the proportion of cells labeled with BrdU was deter-mined and plotted as a function of time. A least-squares regression line was then fit to the data.
Percent labeled mitoses
The length of the G2-phase of the cell cycle was mea-sured using the percentage labeled mitoses paradigm [18]. At 24 hpf, embryos were placed in embryo solution containing PTU (see above). At 28 hpf, embryos were incubated in the EdU/DMSO solution for 20 min then removed and returned to embryo solution. Ten minutes following the EdU exposure, and at 1-h intervals, subse-quently, four embryos from each group were removed, dechorionated, and fixed. Whole embryos were stained with antibodies against phosphohistone H3 (pH3),
fol-lowed by EdU labeling chemistry. Nuclei were counter-stained with 1:1,000 dilution of TOPRO3. Retinas from whole embryos were imaged using a Leica upright con-focal microscope (Leica DM6000 CFS) with 25× water
immersion objective. Approximately 40 to 80 optical sections, 1 μm in thickness, were acquired for each eye. By surveying each optical slice every pH3-positive cell
was counted and scored for the presence/absence of EdU.
qRT-PCR
mRNA was isolated from the forebrains and eyes of embryos at 28 hpf following either morpholino injec-tions (mismatch morpholinos vs. Mdka-targeted mor-pholinos) or heat shock treatment (wild type vs. Tg (pHSP70/4:mdka:egfp)kec1001L3 from a single clutch). Real-time PCR was performed using Power SYBER Green PCR Master Mix (Applied Biosystems) on the Applied Biosystems 7900HT Real Time PCR machine. Real-time PCR data were analyzed using the Compara-tive Ctmethod [41]. Fold changes in expression are
nor-malized to tubulin levels. The following primer pairs
were used:id2aforward 50GCATCCTCTCACTACAGA
CACC 30,id2areverse 50CCTGATTAACGGTAAAGTG
TCCT 30; tubulin forward 50 TGGAGCCCACTGTCAT
TGATG 30, tubulin reverse 50 CAGACAGTTTGCGAA
CCCTATCT 30.
Statistical analysis
All quantitative data are represented as means and standard deviations. Statistical significance between groups was determined either by a one-way ANOVA or a Student’s t-test using GraphPad Prism software (GraphPad Software, La Jolla, CA, USA). P values <0.05 were considered statistically significant.
Imaging
Images of sectioned retinas were captured using a Leica TCS SP5 confocal microscope (Vernon Hills, IL, USA).
Abbreviations
atoh7: mRNA encoding atonal homologue 7; bHLH: Basic helix-loop-helix; BMP: Bone morphogenetic protein; BrdU: 5-bromo-2'-deoxyuridine; CNS: Central nervous system; DAPI: 4',6-diamidino-2-phenylindole; EdU: 5-ethynyl-2'-deoxyuridine;egfp: mRNA encoding enhanced green fluorescent protein; FACS: Fluorescence-activated cell sorting; FGF: Fibroblast growth factor; GFP: Green fluorescent protein; g-o-f: Gain of function; HLH: Helix-loop-helix proteins; hpf: Hours post fertilization; Id2a: Inhibitor of
differentiation protein; HH: Hedgehog protein;id2a:mRNA encodingId2a; l-o-f: Loss of function; Mdka: Midkine-a protein;Mdka: mRNA encoding Midkine-a;mdkb: mRNA encoding Midkine-b; MO: Targeted morpholino
oligonucleotides; MM: Mismatch morpholino oligonucleotides; mM: milimolar; mRNA: messenger RNA; PBS: Phosphate buffered saline; PCR: Polymerase chain reaction; pg: Picograms; pH3: Phosphorylated histone
H3; PLM: Percent labeled mitoses; PTU: 1-phenyl-2-thiourea; qRT-PCR: Quantitative reverse transcriptase - polymerase chain reaction; Tg: Transgenic; TUNEL: Terminal deoxynucleotidyl transferase dUTP nick end labeling; Wnt: Wnt signaling pathway.
Competing interests
Authors’contributions
JL performed experiments related to the Mdka gain- and loss-of-function experiments, collected the quantitative data, and performed the statistical analyses. RAU performed Id2a g-o-f experiments, collected the quantitative data, and performed the statistical analyses. SH was a rotating graduate student and performedmdka in situhybridizations. A-AC generated antibodies used in the western blot analysis. JMG conceived of aspects of the study, participated in its design and coordination, and helped draft the manuscript. PFH conceived of the study, participated in its design and coordination, and helped draft the manuscript. All authors read and approved the final manuscript.
Authors’information
The senior authors, PFH and JMG, direct active laboratories that investigate the molecular mechanisms that govern eye and retinal development. Both are members of the Society for Neuroscience and the Association for Research in Vision and Ophthalmology. JL received a PhD in Physiology from the University of Wisconsin and is working as a postdoctoral fellow. A-AC was a graduate trainee at the University of Michigan and provided the original descriptions ofmdkaexpression in the developing and adult retina of zebrafish. RAU and SH are graduate students at the University of Texas at Austin and University of Michigan, respectively. JMG and RAU recently published a paper inDevelopmentdemonstrating the function of Id2a in the embryonic retina of the zebrafish.
Acknowledgements
The authors thank Laura Kakuk-Atkins and Dilip Pawar for technical assistance and Dr. Christoph Winkler for midkine cDNAs. This work was supported by NIH grants R01 EY07060, P30 EY07003, Research to Prevent Blindness, Inc. and Midwest Eye Banks (PFH) and RO1 EY18005 (JMG) and F31 EY19239 (RAU). The Zebrafish International Resource Center provided antibodies and is supported by grant P40 RR012546.
Author details
1Department of Ophthalmology and Visual Sciences, University of Michigan,
W. K. Kellogg Eye Center, 1000 Wall Street, Ann Arbor, MI 48105-0714, USA.
2Section of Molecular Cell and Developmental Biology, University of Texas at
Austin, Austin, TX, USA.
Received: 3 May 2012 Accepted: 31 August 2012 Published: 30 October 2012
References
1. Agathocleous M, Harris WA:From progenitors to differentiated cells in the vertebrate retina.Annu Rev Cell Dev Biol2009,25:45–69.
2. Graw J:Eye development. Curr Top Dev Biol2010,90:343–386. 3. Kadomatsu K, Muramatsu T:Midkine and pleiotrophin in neural
development and cancer.Cancer Lett2004,204:127–143. 4. Livesey FJ, Young TL, Cepko CL:An analysis of the gene expression
program of mammalian neural progenitor cells.Proc Natl Acad Sci U S A 2004,101:1374–1379.
5. Mitsiadis TA, Salmivirta M, Muramatsu T, Muramatsu H, Rauvala H, Lehtonen E, Jalkanen M, Thesleff I:Expression of the heparin-binding cytokines, midkine (MK) and HB-GAM (pleiotrophin) is associated with epithelial-mesenchymal interactions during fetal development and organogenesis. Development1995,121:37–51.
6. Nurcombe V, Fraser N, Herlaar E, Heath JK:MK: a pluripotential embryonic stem-cell-derived neuroregulatory factor.Development1992,
116:1175–1183.
7. Yao X, Tan Z, Gu B, Wu RR, Liu YK, Dai LC, Zhang M:Promotion of self-renewal of embryonic stem cells by midkine.Acta Pharmacol Sin2010, 31:629–637.
8. Winkler C, Schafer M, Duschl J, Schartl M, Volff JN:Functional divergence of two zebrafish midkine growth factors following fish-specific gene duplication.Genome Res2003,13:1067–1081.
9. Calinescu AA, Raymond PA, Hitchcock PF:Midkine expression is regulated by the circadian clock in the retina of the zebrafish.Vis Neurosci2009, 26:1–7.
10. Calinescu AA, Vihtelic TS, Hyde DR, Hitchcock PF:Cellular expression of midkine-a and midkine-b during retinal development and photoreceptor regeneration in zebrafish.J Comp Neurol2009,514:1–10.
11. Liedtke D, Winkler C:Midkine-b regulates cell specification at the neural plate border in zebrafish.Dev Dyn2008,237:62–74.
12. Kay JN, Link BA, Baier H:Staggered cell-intrinsic timing of ath5 expression underlies the wave of ganglion cell neurogenesis in the zebrafish retina. Development2005,132:2573–2585.
13. Masai I, Stemple DL, Okamoto H, Wilson SW:Midline signals regulate retinal neurogenesis in zebrafish.Neuron2000,27:251–263. 14. Li Z, Hu M, Ochocinska MJ, Joseph NM, Easter SS Jr:Modulation of cell
proliferation in the embryonic retina of zebrafish (Danio rerio).Dev Dyn 2000,219:391–401.
15. Hu M, Easter SS:Retinal neurogenesis: the formation of the initial central patch of postmitotic cells.Dev Biol1999,207:309–321.
16. Nasevicius A, Ekker SC:Effective targeted gene 'knockdown' in zebrafish. Nat Genet2000,26:216–220.
17. Nowakowski RS, Lewin SB, Miller MW:Bromodeoxyuridine
immunohistochemical determination of the lengths of the cell cycle and the DNA-synthetic phase for an anatomically defined population. J Neurocytol1989,18:311–318.
18. Quastler H, Sherman FG:Cell population kinetics in the intestinal epithelium of the mouse.Exp Cell Res1959,17:420–438.
19. Baye LM, Link BA:The disarrayed mutation results in cell cycle and neurogenesis defects during retinal development in zebrafish.BMC Dev Biol2007,7:28.
20. Ohnuma S, Hopper S, Wang KC, Philpott A, Harris WA:Coordinating retinal histogenesis: early cell cycle exit enhances early cell fate determination in the Xenopus retina.Development2002,129:2435–2446.
21. Vernon AE, Philpott A:The developmental expression of cell cycle regulators in Xenopus laevis.Gene Expr Patterns2003,3:179–192. 22. Uribe RA, Gross JM:Id2a influences neuron and glia formation in the
zebrafish retina by modulating retinoblast cell cycle kinetics. Development2010,137:3763–3774.
23. Thisse B, Pfumio S, Fürthauer M, Loppin B, Heyer V, Degrave A, Woehl R, Lux A, Steffan T, Charbonnier X, Charbonnier XQ,et al:Expression of the zebrafish genome during embryogenesis.ZFIN online publication2004, http://zfin.org.
24. Cerveny KL, Cavodeassi F, Turner KJ, de Jong-Curtain TA, Heath JK, Wilson SW:The zebrafish flotte lotte mutant reveals that the local retinal environment promotes the differentiation of proliferating precursors emerging from their stem cell niche.Development2010, 137:2107–2115.
25. Kikuchi-Horie K, Kawakami E, Kamata M, Wada M, Hu JG, Nakagawa H, Ohara K, Watabe K, Oyanagi K:Distinctive expression of midkine in the repair period of rat brain during neurogenesis: immunohistochemical and immunoelectron microscopic observations.J Neurosci Res2004, 75:678–687.
26. Mirkin BL, Clark S, Zheng X, Chu F, White BD, Greene M, Rebbaa A: Identification of midkine as a mediator for intercellular transfer of drug resistance.Oncogene2005,24:4965–4974.
27. Zou P, Muramatsu H, Miyata T, Muramatsu T:Midkine, a heparin-binding growth factor, is expressed in neural precursor cells and promotes their growth.J Neurochem2006,99:1470–1479.
28. Cepko CL, Austin CP, Yang X, Alexiades M, Ezzeddine D:Cell fate determination in the vertebrate retina.Proc Natl Acad Sci USA1996, 93:589–595.
29. Harris WA:Cellular diversification in the vertebrate retina.Curr Opin Genet Dev1997,7:651–658.
30. Baye LM, Link BA:Interkinetic nuclear migration and the selection of neurogenic cell divisions during vertebrate retinogenesis.J Neurosci2007, 27:10143–10152.
31. Tzeng SF:Inhibitors of DNA binding in neural cell proliferation and differentiation.Neurochem Res2003,28:45–52.
32. Iavarone A, Lasorella A:ID proteins as targets in cancer and tools in neurobiology.Trends Mol Med2006,12:588–594.
33. Ruzinova MB, Benezra R:Id proteins in development, cell cycle and cancer.Trends Cell Biol2003,13:410–418.
34. Du Y, Xiao Q, Yip HK:Regulation of retinal progenitor cell differentiation by bone morphogenetic protein 4 is mediated by the smad/id cascade. Invest Ophthalmol Vis Sci2010,51:3764–3773.
36. Kimmel CB, Ballard WW, Kimmel SR, Ullmann B, Schilling TF:Stages of embryonic development of the zebrafish.Dev Dyn1995,203:253–310. 37. Ochocinska MJ, Hitchcock PF:Dynamic expression of the basic
helix-loop-helix transcription factor neuroD in the rod and cone photoreceptor lineages in the retina of the embryonic and larval zebrafish.J Comp Neurol2007,501:1–12.
38. Kwan KM, Fujimoto E, Grabher C, Mangum BD, Hardy ME, Campbell DS, Parant JM, Yost HJ, Kanki JP, Chien CB:The Tol2kit: a multisite gateway-based construction kit for Tol2 transposon transgenesis constructs. Dev Dyn2007,236:3088–3099.
39. Blechinger SR, Evans TG, Tang PT, Kuwada JY, Warren JT Jr, Krone PH:The heat-inducible zebrafish hsp70 gene is expressed during normal lens development under non-stress conditions.Mech Dev2002,112:213–215. 40. Alexiades MR, Cepko C:Quantitative analysis of proliferation and cell
cycle length during development of the rat retina.Dev Dyn1996, 205:293–307.
41. Schmittgen TD, Livak KJ:Analyzing real-time PCR data by the comparative C(T) method.Nat Prot2008,3:1101–1108.
doi:10.1186/1749-8104-7-33
Cite this article as:Luoet al.:Midkine-A functions upstream of Id2a to regulate cell cycle kinetics in the developing vertebrate retina.Neural Development20127:33.
Submit your next manuscript to BioMed Central and take full advantage of:
• Convenient online submission
• Thorough peer review
• No space constraints or color figure charges
• Immediate publication on acceptance
• Inclusion in PubMed, CAS, Scopus and Google Scholar
• Research which is freely available for redistribution