M E T H O D
Open Access
A SNP profiling panel for sample tracking in
whole-exome sequencing studies
Reuben J Pengelly
1, Jane Gibson
1, Gaia Andreoletti
1, Andrew Collins
1, Christopher J Mattocks
2and Sarah Ennis
1*Abstract
Whole-exome sequencing provides a cost-effective means to sequence protein coding regions within the genome, which are significantly enriched for etiological variants. We describe a panel of single nucleotide polymorphisms (SNPs) to facilitate the validation of data provenance in whole-exome sequencing studies. This is particularly significant where multiple processing steps necessitate transfer of sample custody between clinical, laboratory and bioinformatics facilities. SNPs captured by all commonly used exome enrichment kits were identified, and filtered for possible confounding properties. The optimised panel provides a simple, yet powerful, method for the assignment of intrinsic, highly discriminatory identifiers to genetic samples.
Background
Whole-exome sequencing (WES) is presently one of the most efficient means of identifying aetiological genetic mu-tations [1], minimising some of the challenges associated with whole-genome sequencing, such as high cost and data processing burden, analysis and interpretation. In WES, protein-coding regions of the genome are targeted and enriched via specific hybridisation of genomic fragments with complementary oligonucleotides, or ‘baits’. These targeted regions are then sequenced using high throughput next-generation sequencing (NGS) technologies [2].
The high start-up investment required for in-house WES is currently prohibitive to many groups so sample preparation and/or sequencing is commonly outsourced. This transference of sample custody, combined with the complex sample preparation workflow, makes sample mix-ups possible, and difficult to detect. In both clinical and research contexts, ensuring provenance of data is es-sential to allow the accurate assignment of clinical details to sequence data. It is possible that samples may be mis-identified at any stage of the analytical process, both in vitroandin silico. Therefore, sample tracking must be contiguous throughout both data generation and analysis.
Consequent to sample mix-ups in a research setting, erroneous data and sample matching may result in a loss
of power for identification of causal variants [3]. In a clinical setting, this may lead to delayed or inaccurate reporting of results to patients. Whilst good practice in the handling of samples and increased laboratory auto-mation minimises potential for error, additional check-points are still required to support quality control [4]. A method for post hoc confirmation of sample identity is therefore highly desirable.
Genetic sample identification methods have an advan-tage over alternative sample management systems in that the genetic ‘label’is intrinsic to the biological sample it-self, removing the possibility of manual labelling errors. Single nucleotide polymorphisms (SNPs) are increasingly utilised for DNA-based identification of human samples, with several benefits compared to standard forensic methods [5-7]. Existing SNP panels for human forensic identification and commercial SNP panels for sample identification, such as the iPLEX Sample ID Plus panel (Sequenom, San Diego, CA, USA), utilise pan-genome SNPs, the majority of which are non-exonic, and are therefore not useful for WES studies, as the majority of markers will not lie within the enriched regions of the genome. In addition to existing SNP panels, short tan-dem repeat markers can be used for genetic sample tracking. However, again, markers applied are frequently outside exomic regions and, if captured, will be prone to erroneous NGS genotyping using standard pipelines due to the repetitive nature of the markers [8].
Several methods for genetic tracking of human bio-logical samples have been previously described, some of * Correspondence:[email protected]
1Human Genetics and Genomic Medicine, Faculty of Medicine, University of
Southampton, Duthie Building (MP 808), Southampton General Hospital, Tremona Road, Southampton SO16 6YD, UK
Full list of author information is available at the end of the article
scriptome microarray studies [3,9,10]. Although software for the validation of NGS (including WES) sample iden-tity, such as verifyBamID, exist [11], for the detection of sample misidentifications external array-based genotypes of the samples are required, without which only contam-ination of the samples can be assessed.
Here we describe an optimised panel of SNPs for which WES data are typically informative, the genotypic profile of which can be utilised to extract intrinsic identifiers from human genomic DNA. These SNP profiles have high dis-criminatory power, even in large datasets. The profile de-rived from this panel can be compared to an independently genotyped profile for the same individual, allowing accurate validation of data and sample pairings, at a modest cost per sample.
Methods
Candidate identification and panel selection
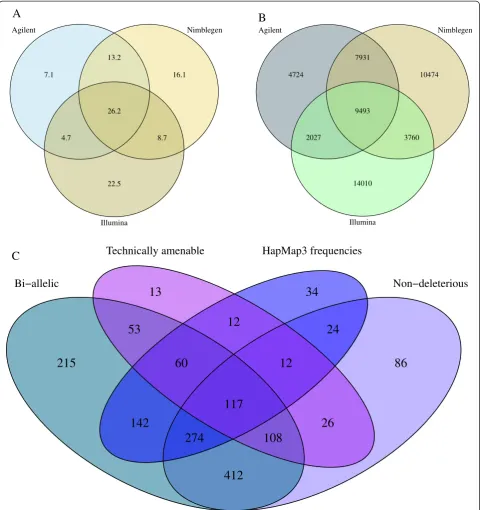
Regions of overlap between three current commonly used whole-exome enrichment kits, (namely Agilent SureSelect Human All Exon V4, Illumina TruSeq Exome Enrichment and Nimblegen SeqCap EZ Human Exome Library V3.0 kits), and common SNPs (dbSNP 137, [12]) were established using BEDTools [13]. SNPs were further filtered for inclusion based upon their presence in genes targeted by the Illumina TruSight Exome kit, which targets only genes of clinical interest.
Primary candidate selection criteria required SNPs to: 1) represent bi-allelic substitutions, excluding substitu-tions of complementary bases, that is, A↔T and G↔C transversions; 2) be technically amenable to both accur-ate WES and orthogonal genotyping, that is, not present in large-scale genomic repeats [14], or homopolymeric tracts of≥5 bp, GC content for the flanking 250 bp was restricted to a range of between 40% and 55% and no other variant within 50 bp with an alternative-allele fre-quency (AF) ≥0.01 was permitted; 3) conform to desir-able phase 3 HapMap AFs across several populations, explicitly AFs of between 0.2 and 0.8 in: CEPH (Utah residents with ancestry from northern and western Europe; CEU), Japanese in Tokyo, Japan (JPT), Han Chinese in Beijing, China (CHB) and Yoruba in Ibidan, Nigeria (YRI) [15] and; 4) not alter the primary sequence of the encoded protein or have an associated Online Mendelian Inheritance in Man (OMIM) record [16].
Following primary candidate identification steps, SNPs were further optimised by the following require-ments: 1) be located at least 10 bp from exon boundar-ies; 2) not be situated in regions with a high sequence similarity to non-target regions, that is, no non-target BLAT score >100 [17], as this could result in non-specific genotyping; and 4) be outside of linkage dis-equilibrium with all other selected SNPs.
panel by proximity of the AFs to 0.5, across HapMap populations, in order to maximise discriminatory power.
SNP coverage in whole-exome sequencing data
A set of 91 in-house exome samples was evaluated for depth of sequence coverage for the candidate SNPs. Exome capture was performed using Agilent SureSelect Human All Exon V3 (n = 22) and V4 (n = 55), Illumina TruSeq Exome Enrichment (n = 9) and Nimblegen SeqCap EZ Human Exome Library V3.0 (n = 5). Exome enrichment, sequencing andin silicoanalysis of samples was performed as previously described [18,19].
Optimised panel validation
The power of sample resolution for the panel was vali-dated using data from phase 1 of the 1000 Genomes Project (n = 1,092) [20] and the UK10K project (n = 2,688; 2,432 of which are whole-genome data) [21]. Genotypes were extracted from data using custom scripts and Tabix [22]. Quantification of mismatches be-tween samples was performed using MEGA5 [23].
Simulated datasets were generated by taking individual population AFs for each SNP as input and generating ran-dom SNP profiles in accordance with Hardy-Weinberg equilibrium based upon this; the randomisation of each SNP was independent of all other SNPs. We then quanti-fied the rate of non-unique profiles per simulated dataset. We performed 20,000 independent replicates of dataset generation in all cases.
Panel application
We applied the panel to a batch of 48 samples exome se-quenced by an external service provider, for which or-thogonal genotypes were obtained concurrently through an independent genotyping provider using KASP geno-typing (LGC Genomics, Hoddeston, UK). Following plat-ing of DNA samples for dispatch, a replicate plate was made directly from the primary plate, to be dispatched for the orthogonal genotyping. Genotypes derived from exome data and orthogonal genotyping assays were compared using PLINK [24] and custom scripts.
Ethics
This study was approved by the Southampton and South West Hampshire Research Ethics Committee (09/H0504/ 125). Informed consent was obtained for all participants.
Results
In total, 26.2 Mbp of genome sequence was found
to overlap all three commonly applied
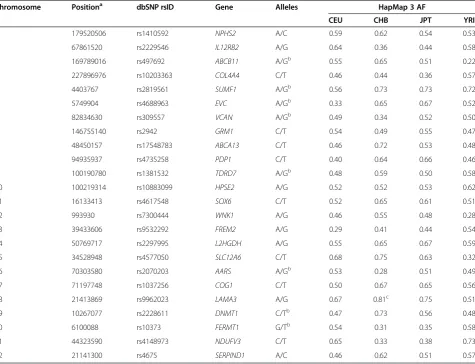
subset, following the filtering for all primary candidate criteria, 117 candidate SNPs were identified (Figure 1C; Additional file 1), from which the optimised panel of 24 SNPs was selected (Table 1). Within the set of 91 in-house exome samples, all 24 SNPs were sequenced at sufficient
read-depth for accurate genotype calling, across all cap-ture kits.
The 24 biallelic SNPs afford 48 points of allelic comparison. Testing the optimised panel in the 1000 Genomes Project data (n = 1,092) [20], an average of
7.1
13.2
16.1
4.7
26.2
8.7
22.5
Agilent Nimblegen
Illumina
4724
7931
10474
2027
9493
3760
14010
Agilent Nimblegen
Illumina
A
B
13
12
34
53
60
117
12
24
215
142
274
108
26
86
412
Bi−allelic
Non−deleterious
Technically amenable
HapMap3 frequencies
C
Figure 1Venn diagrams showing commonality of targeting between capture kits (A,B) and properties of encompassed SNPs (C).
18.0 (standard deviation = 3.3) allelic differences be-tween all pairwise combinations was observed, with a range of 3 to 34. As such, there will be, on average, 18 differential alleles between any two samples, enabling discrimination.
On addition of the UK10K data (n = 2,688) to the 1000 Genomes Project data (ncombined = 3,780), there
remained an average of 17.8 allele mismatches across the profiles. Eighteen UK10K sample pairs produced duplicate profiles. On investigation of these pairs, they were found to share >98% genotypic concordance across an extended panel of 1,662 SNPs in all cases, compared to an average of 42%, with a range of 27 to 77%, for all sample pairs with unique SNP profiles (Additional file 2). As such, these pairs represent extreme outliers, and are derived from genetically identical biological samples, either from the same individual or monozy-gotic twins, and were therefore excluded from the mis-match average.
Simulated data
The discriminatory power of the panel was evaluated by dataset simulation. We simulated datasets of 10,000 individuals, that conformed to AF distributions for investi-gated HapMap populations (CEU, CHB, JPT and YRI),
Chromosome Positiona dbSNP rsID Gene Alleles HapMap 3 AF
CEU CHB JPT YRI
1 179520506 rs1410592 NPHS2 A/C 0.59 0.62 0.54 0.53
1 67861520 rs2229546 IL12RB2 A/G 0.64 0.36 0.44 0.58
2 169789016 rs497692 ABCB11 A/Gb 0.55 0.65 0.51 0.22
2 227896976 rs10203363 COL4A4 C/T 0.46 0.44 0.36 0.57
3 4403767 rs2819561 SUMF1 A/Gb 0.56 0.73 0.73 0.72
4 5749904 rs4688963 EVC A/Gb 0.33 0.65 0.67 0.52
5 82834630 rs309557 VCAN A/Gb 0.49 0.34 0.52 0.50
6 146755140 rs2942 GRM1 C/T 0.54 0.49 0.55 0.47
7 48450157 rs17548783 ABCA13 C/T 0.46 0.72 0.53 0.48
8 94935937 rs4735258 PDP1 C/T 0.40 0.64 0.66 0.46
9 100190780 rs1381532 TDRD7 A/Gb 0.48 0.59 0.50 0.58
10 100219314 rs10883099 HPSE2 A/G 0.52 0.52 0.53 0.62
11 16133413 rs4617548 SOX6 C/T 0.52 0.65 0.61 0.51
12 993930 rs7300444 WNK1 A/G 0.46 0.55 0.48 0.28
13 39433606 rs9532292 FREM2 A/G 0.29 0.41 0.44 0.54
14 50769717 rs2297995 L2HGDH A/G 0.55 0.65 0.67 0.59
15 34528948 rs4577050 SLC12A6 C/T 0.68 0.75 0.63 0.32
16 70303580 rs2070203 AARS A/Gb 0.53 0.28 0.51 0.49
17 71197748 rs1037256 COG1 C/T 0.50 0.67 0.65 0.56
18 21413869 rs9962023 LAMA3 A/G 0.67 0.81c 0.75 0.51
19 10267077 rs2228611 DNMT1 C/Tb 0.47 0.73 0.56 0.48
20 6100088 rs10373 FERMT1 G/Tb 0.54 0.31 0.35 0.58
21 44323590 rs4148973 NDUFV3 C/T 0.65 0.33 0.38 0.73
22 21141300 rs4675 SERPIND1 A/C 0.46 0.62 0.51 0.57
a
Position as defined in genome reference assembly GRCh37 (hg19).
b
SNP is defined on the negative strand.
c
AF marginally outside target range for candidate selection. Selected due to paucity of candidates on chromosome 18.
Table 2 Profile collisions per simulated dataset of 10,000 individuals with various population AFs
AF source Average collisions per dataset (±SD)
1000 Genomes average 0.0039 (0.062)
HapMap phase 3:
CEU 0.0064 (0.079)
CHB 0.0239 (0.154)
JPT 0.0082 (0.090)
YRI 0.0076 (0.086)
Theoretical perfecta 0.0031 (0.056)
a
1000 Genomes Project pilot average [25], as well as for a hypothetical perfect allele distribution (AF = 0.5 for all SNPs) (Table 2). In all simulated populations, <2.5% of simulated datasets of 10,000 contained any repeat SNP profiles (henceforth termed‘collisions’). This translates ap-proximately into less than 1 in every 40 independent datasets of 10,000 individuals containing a single matching pair of profiles.
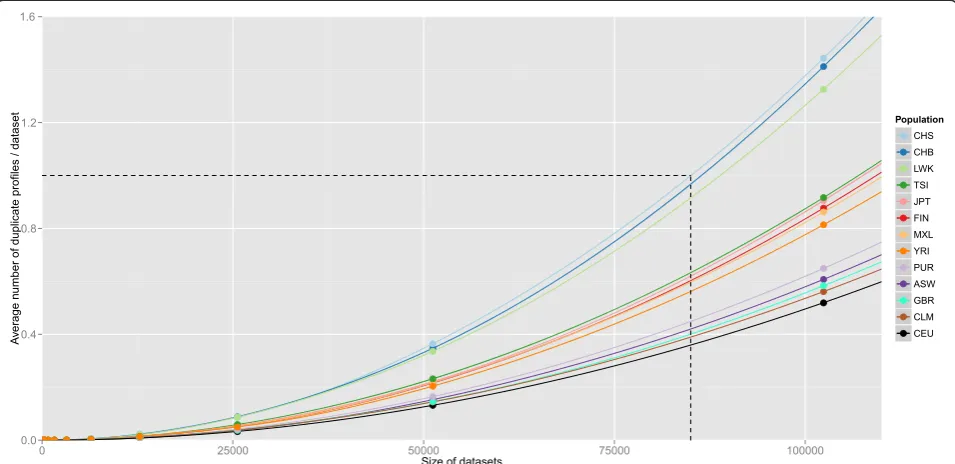
The effect of dataset size on the frequency of collisions was investigated for populations present in 1000 Genomes Project phase 1 data [20]. An exponential increase in the frequency of collisions was observed with increasing dataset size, though the panel continued to have high power for the discrimination of samples. For instance, were we to have 85,000 Southern Han Chinese (CHS)
samples, (the worst performing 1000 Genomes population evaluated, due to the AF distribution for SNPs within this panel), we would expect the dataset to contain, on average, a single duplicate SNP profile (Figure 2). In addition, total SNP absence - for example, through technical failure of orthogonal genotyping - was modelled. For each SNP that entirely failed to provide data, a less than three-fold drop in discriminatory power was observed in all cases (data not shown). This suggests that our approach is robust against technical failure.
Application of the SNP panel to our batch of 48 samples revealed a discrepancy between exome and orthogonal genotypes for two samples dispatched in adjacent wells, suggesting a reciprocal transposition (Figure 3). The occurrence of this error in the exome data was also Figure 2Relationship between size of simulated datasets and the occurrence of non-unique profiles.Thirteen 1000 Genomes Project populations were simulated [20]. Datasets were simulated as described in Methods. With increasing dataset size, the probability of repeat profiles increases. Only populations with a sample size of >50 individuals in the dataset were simulated. Additional populations are Americans of African ancestry in Southwest USA (ASW), Columbians from Medellin, Colombia (CLM), Finnish in Finland (FIN), British in England and Scotland (GBR), Luhya in Webuye, Kenya (LWK), Mexican ancestry from Los Angeles, USA (MXL), Puerto Ricans from Puerto Rico (PUR) and Toscany in Italia (TSI).
Sample rs1 4 1 0 59 2 rs2 2 2 9 54 6 rs4 9 7 6 92 rs 10 203 363 rs2 8 1 9 56 1 rs4 6 8 8 96 3 rs3 0 9 5 57 rs2 9 4 2 rs 17 548 783 rs4 7 3 5 25 8 rs1 3 8 1 53 2 rs 10 883 099 rs4 6 1 7 54 8 rs7 3 0 0 44 4 rs9 5 3 2 29 2 rs2 2 9 7 99 5 rs4 5 7 7 05 0 rs2 0 7 0 20 3 rs1 0 3 7 25 6 rs9 9 6 2 02 3 rs2 2 2 8 61 1 rs1 0 3 7 3 rs4 1 4 8 97 3 rs4 6 7 5
1 Exome A A G A C C C T G G T T T C G A T C C T A A A A A G C T G A G A A A G A G G T C C C G G T G T T Geno N N G A C C C T G G T T T C G A T C C T A A A A A G C T G A G A A A G A G G T C C C G G T G T T
2 Exome C A A A C C C T A G T T T C G A T C C C A A G G G G C T A A G G G A G A G G C C C C G G G G T T Geno C A G A T C C T G G T T T C A A C C C C G G A G A G C C A A A A G A A A G A C C T C A G G G C T
3 Exome C A G A T C C T G G T T T C A A C C C C G G A G A G C C A A A A G A A A G A C C T C A G G G C T Geno C A A A C C C T A G T T T C G A T C C C A A G G G G C T A A G G G A G A G G C C C C G G G G T T
4 Exome C A A A T T C T G G T T T C G A T C C T A A G G A A C T A A A A A A G A G A C C T C A A G G C T Geno C A A A T T C T G G T T T C G A T C C T A A G G A A C T A A A A A A G A G A C C T C A A G G C T
Figure 3Exome derived and orthogonal genotypes (Geno) for four samples, showing a sample-switch between samples 2 and 3.
gosity to confirm sample gender. In addition to the identi-fication of the switch, the panel allowed for expeditious resolution of the error, permitting the continued use of the data in downstream analyses.
Discussion
Validation of sample identity is essential in order to ensure data integrity and validity of conclusions drawn from data. We have described a powerful tool for the identification and validation of data provenance throughout the work-flow of WES data collection and analysis. The power of discrimination, that is, the precision with which samples can be uniquely identifiable, is sufficient and robust for most projects on the current scale of up to 10,000 sam-ples, with inbuilt redundancy of SNPs to protect against technical failures. In WES, the exome enrichment process provides the limiting step for the availability of data on SNPs for use in sample identification. As such, this panel will also be of utility for whole-genome sequencing data, where there is no such limitation on SNP coverage. This will be beneficial where there are mixed datasets of both whole-genome sequence and WES data.
NGS is now developing as the diagnostic methodology of choice across a range of applications, including mutation scanning in targeted gene panels and WES for congenital disorders, as well as high depth analysis for tumour profil-ing. Whilst the service model for delivery of these tests is not fully resolved at this stage, there will certainly be eco-nomic arguments for centralising certain tests. This will have the effect of increasing the throughput requirements as well as physically moving samples between labs. Both of these factors will increase the opportunity for sample misidentification.
Even for testing within a single lab, the use of inherent sample and data identification methods, as described in this study, seems a robust approach to fulfil the regulatory requirement for providing a full audit trail and ensuring data provenance [26,27]. The SNP panel presented here is immediately usable across all commonly used exome cap-ture kits, and would be equally applicable to any gene panel by incorporating, or ‘spiking’, the SNP regions into the custom capture kit at the design stage. Where it can be shown that there are no expected repeat profiles (that is, no paired samples from the same individual are being analysed), it may even be beneficial from a process per-spective to use the SNP profile as the primary method for sample tracking.
The discriminatory power of the panel may be re-duced for various reasons, such as geographically local-ised variation in AFs, and degradation of DNA samples, resulting in incomplete data. We have shown our panel to have a high discriminatory power across a diverse range of populations. Additionally, the discriminatory
are sequenced. In the case of highly consanguineous families, sample tracking methods such as barcoding will afford optimal certainty in these particular cases. Should concerns over insufficient discriminatory power arise, additional SNPs may be added to the panel from the existing list of candidates (Additional file 1), also allowing the tailoring of an enhanced panel to the popu-lation(s) of interest, should this be desired. Neverthe-less, we have demonstrated our panel to be sufficiently robust to withstand power reductions without loss of utility for most purposes.
We have also presented a recent case in which use of this panel has allowed us to identify, confirm, and resolve a sample switch, highlighting the importance of using such a tool. Monetary cost will vary with the technology used for orthogonal genotyping and sample throughput. We have intentionally designed the panel to be platform non-specific, allowing for the establishment of in-house assays using preferred genotyping methodology or outsourced where required. Our own chosen methodology costs ap-proximately £5 GBP per sample, representing a small frac-tion of the cost of exome data generafrac-tion.
Conclusions
The size of held NGS datasets continues to increase, with the UK Government recently committing to the sequen-cing of 100,000 samples as part of healthcare provisions [28]. As such, the demand for the development of effective tools for bioinformatic analysis, data compression, muta-tion effect predicmuta-tion and quality control is high. We have described a panel of SNPs for the discrimination of human biological samples on the basis of data intrinsic to WES data derived from samples processed using common cap-ture kits. We recommend the routine use of this panel to maintain data integrity and protect sample provenance.
Additional files
Additional file 1:List of all candidate SNPs with evaluated properties.
Additional file 2:Distribution of pairwise genotype concordance between samples.Pairs resulting in duplicate SNP profiles (n = 18) and pairs between samples with unique SNP profiles (n = 7,142,293) within the combined dataset of 3,780 samples are shown. Concordance across the 1,662 SNPs detailed in Figure 1C was evaluated. All pairs resulting in duplicate profiles have >98% concordance, well separated from the distribution of samples with unique profiles. Note the logarithmic scale.
Abbreviations
Competing interests
The authors declare that they have no competing interests.
Authors’contributions
RJP performed analysis and interpretation of data, and drafted the manuscript, JG, GA and AC contributed to analysis, CJM contributed to data interpretation and manuscript preparation and SE conceived and supervised the project, and contributed to manuscript preparation. All authors read and approved the final manuscript.
Acknowledgements
The authors thank the Technology Strategy Board and the University of Southampton for funding, and Dr Dietrich Lueerssen for discussion. The authors also acknowledge the use of the IRIDIS High Performance Computing Facility, and associated support services at the University of Southampton, in the completion of this work. This study makes use of data generated by the UK10K Consortium. A full list of the investigators who contributed to the generation of the data is available from www.UK10K.org. Funding for UK10K was provided by the Wellcome Trust under award WT091310.
Author details
1
Human Genetics and Genomic Medicine, Faculty of Medicine, University of Southampton, Duthie Building (MP 808), Southampton General Hospital, Tremona Road, Southampton SO16 6YD, UK.2National Genetics Reference Laboratory (Wessex), Salisbury District Hospital, Salisbury SP2 8BJ, UK.
Received: 22 July 2013 Accepted: 16 September 2013 Published: 27 September 2013
References
1. Need AC, Shashi V, Hitomi Y, Schoch K, Shianna KV, McDonald MT, Meisler MH, Goldstein DB:Clinical application of exome sequencing in undiagnosed genetic conditions.J Med Genet2012,49:353–361. 2. Bamshad MJ, Ng SB, Bigham AW, Tabor HK, Emond MJ, Nickerson DA,
Shendure J:Exome sequencing as a tool for Mendelian disease gene discovery.Nat Rev Genet2011,12:745–755.
3. Westra H-J, Jansen RC, Fehrmann RSN, te Meerman GJ, van Heel D, Wijmenga C, Franke L:MixupMapper: correcting sample mix-ups in genome-wide datasets increases power to detect small genetic effects. Bioinformatics2011,27:2104–2111.
4. Lam CW, Jacob E:Implementing a laboratory automation system: experience of a large clinical laboratory.J Lab Autom2012,17:16–23. 5. Pakstis AJ, Speed WC, Fang R, Hyland FC, Furtado MR, Kidd JR, Kidd KK: SNPs for a universal individual identification panel.Hum Genet2010, 127:315–324.
6. Zietkiewicz E, Witt M, Daca P, Zebracka-Gala J, Goniewicz M, Jarzab B, Witt M:Current genetic methodologies in the identification of disaster victims and in forensic analysis.J Appl Genet2012,53:41–60.
7. Freire-Aradas A, Fondevila M, Kriegel AK, Phillips C, Gill P, Prieto L, Schneider PM, Carracedo A, Lareu MV:A new SNP assay for identification of highly degraded human DNA.Forensic Sci Int Genet2012,6:341–349. 8. Highnam G, Franck C, Martin A, Stephens C, Puthige A, Mittelman D:
Accurate human microsatellite genotypes from high-throughput resequencing data using informed error profiles.Nucleic Acids Res2013, 41:e32.
9. Castro F, Dirks WG, Fähnrich S, Hotz-Wagenblatt A, Pawlita M, Schmitt M: High-throughput SNP-based authentication of human cell lines.Int J Cancer2013,132:308–314.
10. Xu W, Gao H, Seok J, Wilhelmy J, Mindrinos MN, Davis RW, Xiao W:Coding SNPs as intrinsic markers for sample tracking in large-scale
transcriptome studies.Biotechniques2012,52:386–388.
11. Jun G, Flickinger M, Hetrick KN, Romm JM, Doheny KF, Abecasis GR, Boehnke M, Kang HM:Detecting and estimating contamination of human DNA samples in sequencing and array-based genotype data.Am J Hum Genet2012,91:839–848.
12. Sherry ST, Ward MH, Kholodov M, Baker J, Phan L, Smigielski EM, Sirotkin K: dbSNP: the NCBI database of genetic variation.Nucleic Acids Res2001, 29:308–311.
13. Quinlan AR, Hall IM:BEDTools: a flexible suite of utilities for comparing genomic features.Bioinformatics2010,26:841–842.
14. Repeat Masker.http://www.repeatmasker.org/.
15. International HapMap Consortium:Integrating common and rare genetic variation in diverse human populations.Nature2010,467:52–58. 16. OMIM - Online Mendelian Inheritance in Man.http://www.omim.org/. 17. Kent WJ:BLAT–The BLAST-Like Alignment Tool.Genome Res2002,12:656–664. 18. Christodoulou K, Wiskin AE, Gibson J, Tapper W, Willis C, Afzal NA,
Upstill-Goddard R, Holloway JW, Simpson MA, Beattie RM, Collins A, Ennis S:Next generation exome sequencing of paediatric inflammatory bowel disease patients identifies rare and novel variants in candidate genes.Gut2013, 62:977–984.
19. Gibson J, Tapper W, Ennis S, Collins A:Exome-based linkage disequilibrium maps of individual genes: functional clustering and relationship to disease.Hum Genet2013,132:233–243.
20. 1000 Genomes Project Consortium:An integrated map of genetic variation from 1,092 human genomes.Nature2012,491:56–65. 21. UK10K Study Samples.http://www.uk10k.org/studies/.
22. Li H:Tabix: fast retrieval of sequence features from generic TAB-delimited files.Bioinformatics2011,27:718–719.
23. Tamura K, Peterson D, Peterson N, Stecher G, Nei M, Kumar S:MEGA5: molecular evolutionary genetics analysis using maximum likelihood, evolutionary distance, and maximum parsimony methods.Mol Biol Evol 2011,28:2731–2739.
24. Purcell S, Neale B, Todd-Brown K, Thomas L, Ferreira MA, Bender D, Maller J, Sklar P, de Bakker PI, Daly MJ, Sham PC:PLINK: a tool set for whole-genome association and population-based linkage analyses.Am J Hum Genet2007,81:559–575.
25. 1000 Genomes Project Consortium:A map of human genome variation from population-scale sequencing.Nature2010,467:1061–1073. 26. International Organization for Standardization:Medical Laboratories
-Requirements for Quality and Competence; 2012. ISO 15189:2012. 27. Rehm HL, Bale SJ, Bayrak-Toydemir P, Berg JS, Brown KK, Deignan JL, Friez
MJ, Funke BH, Hegde MR, Lyon E:ACMG clinical laboratory standards for next-generation sequencing.Genet Med2013,15:733–747.
28. DNA tests to revolutionise fight against cancer and help 100,000 NHS patients. https://www.gov.uk/government/news/dna-tests-to-revolutionise-fight-against-cancer-and-help-100000-nhs-patients.
doi:10.1186/gm492
Cite this article as:Pengellyet al.:A SNP profiling panel for sample tracking in whole-exome sequencing studies.Genome Medicine
20135:89.
Submit your next manuscript to BioMed Central and take full advantage of:
• Convenient online submission
• Thorough peer review
• No space constraints or color figure charges
• Immediate publication on acceptance
• Inclusion in PubMed, CAS, Scopus and Google Scholar
• Research which is freely available for redistribution