R E S E A R C H
Open Access
Mimosa: Mixture model of co-expression to
detect modulators of regulatory interaction
Matthew Hansen
†, Logan Everett
†, Larry Singh, Sridhar Hannenhalli
*Abstract
Background:Functionally related genes tend to be correlated in their expression patterns across multiple conditions and/or tissue-types. Thus co-expression networks are often used to investigate functional groups of genes. In particular, when one of the genes is a transcription factor (TF), the co-expression-based interaction is interpreted, with caution, as a direct regulatory interaction. However, any particular TF, and more importantly, any particular regulatory interaction, is likely to be active only in a subset of experimental conditions. Moreover, the subset of expression samples where the regulatory interaction holds may be marked by presence or absence of a modifier gene, such as an enzyme that post-translationally modifies the TF. Such subtlety of regulatory interactions is overlooked when one computes an overall expression correlation.
Results:Here we present a novel mixture modeling approach where a TF-Gene pair is presumed to be
significantly correlated (with unknown coefficient) in an (unknown) subset of expression samples. The parameters of the model are estimated using a Maximum Likelihood approach. The estimated mixture of expression samples is then mined to identify genes potentially modulating the TF-Gene interaction. We have validated our approach using synthetic data and on four biological cases in cow, yeast, and humans.
Conclusions:While limited in some ways, as discussed, the work represents a novel approach to mine expression data and detect potential modulators of regulatory interactions.
Background
Eukaryotic gene regulation is carried out, to a significant extent, at the level of transcription. Many functionally related genes, e.g., members of a pathway, involved in the same biological process, or whose products physically interact, tend to have similar expression patterns [1,2]. Indeed, co-expression has been used extensively to infer functional relatedness [3-6]. Various metrics have been proposed to quantify the correlated expression, such as Pearson and Spearman correlation [2], and mutual infor-mation [5]. However, these metrics are symmetric and they neither provide the causality relationships nor do they discriminate between indirect relations. For instance, two co-expressed genes may be co-regulated, or one may regulate the other, directly or indirectly.
A critical component of transcription regulation relies on sequence-specific binding of transcription factor (TF)
proteins to short DNA sites in the relative vicinity of the target gene [7]. If one of the genes in a pairwise analysis of co-expression is a TF then the causality is generally assumed to be directed from the TF to the other gene. In the absence of such information, an additional post-pro-cessing step [5] can be used to infer directionality between the pair of genes with correlated expression. Moreover, a first order conditional independence metric [4] has been proposed to specifically detect direct interactions.
While TFs are the primary engines of transcription, their activity depends on several other proteins such as modifying enzymes and co-factors, which directly or indirectly interact with the TF to facilitate its activity. For instance, the activity of TF CREB depends on a number of post-translational modifications, most notably, Ser133 phosphorylation by Protein Kinase A [8]. Moreover, for many TFs, the TF activity is likely to be restricted to spe-cific cell types and/or experimental conditions. Thus the common practice of using large compendiums of gene expression data to estimate co-expression and thus func-tional relatedness has two main limitations: (1) it includes * Correspondence: [email protected]
†Contributed equally
Department of Genetics, Penn Center for Bioinformatics, University of Pennsylvania, Pennsylvania, USA
irrelevant expression samples which adds noise to the co-expression signal, and (2) it overlooks the contributions of additional modifier genes and thus fails to detect those modifiers which are critical components of gene regula-tory networks.
To infer the dependence of TF activity on histone modification enzymes, Steinfeld et al. analyzed the expression of TF-regulons (putative targets of a TF) in yeast samples where specific histone modification enzymes were knocked out [9]. In a different study, Hudson et al. analyzed two sets of expression data in cow, a less-muscular wild-type and another with mutant TF Myostatin [10]. They found that the co-expression of Myostatin with a differentially expressed gene, MYL2, was significantly different between the mutant and the wild-type sets of expression. This differential co-expres-sion led them to detect Myostatin as the causative TF even though the expression of Myostatin gene itself was not different between the mutant and the wild type. In both of the cited examples [9,10], the two sets of expres-sion were well characterized and known a priori. In fact, Hu et al. have proposed a non-parametric test to detect differentially correlated gene-pairs in two sets of expres-sion samples [11]. However, it is not clear how to detect such differentially co-expressed gene pairs when the appropriate partition of the expression samples is not provided and cannot be derived from the description of the experiments. This problem is an important practical challenge for large expression compendiums that cover many diverse experimental conditions. The tremen-dously growing expression compendium [12], provides a unique opportunity to identify not only co-expressed and functionally related genes, but also to predict puta-tive modifiers of gene regulators.
For a pair of genes for which we have expression data across a set of conditions/samples, we assume there is some partition of the conditions such that the two genes are correlated in one partition and are uncorre-lated in the other. Here we propose a novel approach,
“Mimosa”, that detects the hidden partition of the expression samples into correlated and uncorrelated subsets. If found, such a partition suggests the existence of modifier genes, such as TF modifying enzymes, that should be differentially expressed between the correlated and uncorrelated sample partitions. In other words, genes whose expression vector across samples is corre-lated with the sample partition vector are putative modi-fiers. The sample partition is derived from a mixture model of the co-expression data. The free parameters of the mixture model are estimated using a Maximum Likelihood Estimation (MLE) approach. Once the mix-ture parameters are obtained, we can then compute a weighted partitioning of the samples into the correlated and uncorrelated sets. In a subsequent step, we detect
putative modifier genes that are differentially expressed between correlated and uncorrelated samples. Using synthetic data we show that Mimosa can partition expression samples and detect modifier genes with high accuracy. We further present four biological applica-tions, one in bovine samples, two in yeast, and one in human B cells. This work represents a novel approach to mine expression data and detect potential modulators of regulatory interactions.
Methods
Mixture modeling of co-expression
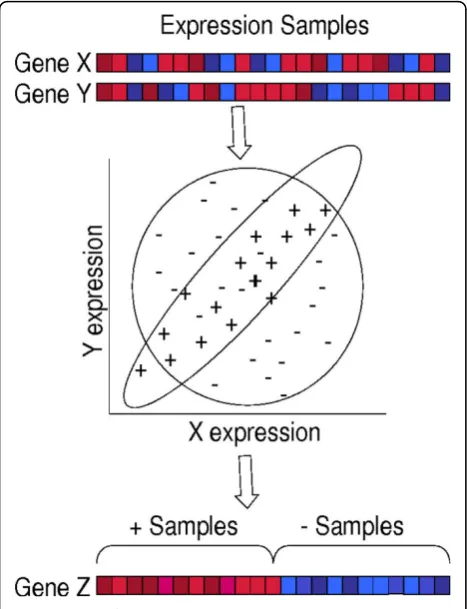
Figure 1 illustrates the method. The input data, i.e. the expression profiles, is a matrixM[i, k] where the genes, indexed byi= 1, 2, ..., Ng, are the rows and the
expres-sion samples, indexed by k= 1, 2, ..., Ns, are the
col-umns of the matrix. M [i, k] represents the expression of genei in expression samplek. All rows are normal-ized to have mean 0 and variance of 1. For each pair of genes i andj, there areNs data points of expression
value pairs, (M [i,k],M [j,k]). For ease of notation, we shall denote the data points as (xk, yk). The observed
data set for the gene pair, (xk, yk), is assumed to be a
mixture of two different distributions: the group of uncorrelated samples (group“u“) and the group of cor-related samples (group “c“), each with its own probabil-ity distribution; call these distribution functionspu(x, y)
and pc(x,y). By definitionpu(x, y) =pu(x)pu(y), where pu(·) is the normal distribution.
The observed data is viewed as a random sampling from these two groups with mixing fractionfdefined to be the fraction of data points that belong to the uncor-related group. The total likelihood of a data point (x, y) isp(x,y) =f pu(x,y) + (1 -f)pc(x,y). In the present
ana-lysis we assume the uncorrelated distributions to be normal, hence,
p x yu( , ) exp (x y ) .
1 2
1 2
2 2
(1)
We derive the distribution of correlated data,pc(x, y)
by assuming that there is some (u, v) coordinate system related to the (x, y) coordinate system by a rotation through an angle θ, such that pc(u, v) = (u, su)
(v,sv). Here, (x,s) is the Gaussian distribution with
zero mean and variance s2. The coordinate transforma-tions from (x, y) coordinates to (u, v) coordinates are: u =x cosθ-y sin θand v=xsin θ+y cos θ. The Jaco-bian of the transformation is 1, so we have
p x y
u x y u v x y v
u v
c( , )
exp ( ( , )/ ( , )/ ) .
1 2
2 2 2 2
2
There are three unknowns, {θ,su,sv}. There are,
how-ever, two natural constraints on the form of pc(x, y);
namely, that
dxp x yc( , ) p yu( )
(3)dyp x yc( , ) p xu( ).
(4)Applying these two constraints to eqn. (2), and assum-ing thatsu≠sv, we have
p x y
x y xy
c( , )
exp ( )/( )
,
1 2
2 2 2 1 2
2 1 2
(5)
where -1≤ a ≤ 1 is a free parameter of the mixture model that controls the aspect ratio of the correlated distribution. Without loss of generality letsv>su; then
in terms ofa we havesu2= (1 - |a|) and su2 = (1 + |
a|). Note thata< 0 corresponds to positively correlated data (θ=π/4) anda> 0 corresponds to negatively cor-related data (θ= -π/4). For an aspect ratio defined byr
≡ sv/su> 1, we have |a| = (r2-1)/(r2+1). In summary,
the mixture model has two free parameters, (f,a), that determine the fraction of uncorrelated points in the observed data and the aspect ratio of the distribution for correlated data.
The log likelihood of the observed data is
L f p xk yk f
k
( , )
ln[ ( , | , )]. (6)We maximizeLnumerically using the quasi Newton-Raphson function optimization routine in the open source Gnu Scientific Library http://www.gnu.org/soft-ware/gsl. The resulting parameter estimates are ˆf and
ˆ .
For each selected gene pair, we compute the probabil-ity that each sample belongs to the correlated group. For thekthsample, this is given by
q f pc xk yk
p xk yk f
k
( ) ( , | ) ( , | , ) .
1
(7)
This vector of probabilities is equivalent to a weighted partitioning of the sample set. Modifier genes are selected based on their correlation with vector q. We compute this correlation with a t-test based on the expected population number, mean, and variance (see below). When computationally feasible, we use non-parametric correlation measures, such as Kendall’s Tau.
Weighted t-statistic
Given two vectors: (1) the q vector denoting the parti-tion probability for each sample, and (2) expression vec-tor E over all samples for a potential modifier gene, we can, in principle, partition the expression samples into two parts based only on the partition probability, and then compare the expression values in the two parts using a t-statistic or an alternative non-parametric test. However, this approach requires an arbitrary choice of partition probability threshold to partition the sample. We instead used a weighted version of the t-statistic that obviates the need for an arbitrary threshold. The standard t-statistic requires three parameters for each of the two partitions: the two sample-means, the two sam-ple-standard deviations, and the two sample-sizes. We computed all these parameters using a weighted sum. For instance, the sample mean of the correlated
partition, μc, can be estimated as c nc1
kq Ek k,where nc qk
k
is the weighted number of correlated samples. Similarly, the standard deviation of thecorre-lated partition, sc, is given by
c k k c
k
nc q E
2 1
( )2.Generating synthetic data
To generate a TF-Gene-Modifier triplet for a givenfand awe performed the following steps. We first create the modifier and TF expression data independantly by ran-dom sampling from a normal distribution. For the given
f, we determine the modifier expression threshold m* such that below this threshold the TF and gene are pre-sumed to be uncorrelated and above this threshold, the TF and the gene are presumed to be correlated. The
value of m * is estimated by f m x x
*d ( , )1 . We generate the gene expression value as follows. Letm be the modifier expression in the kth sample. Ifm < m*, then the gene’s expression value for that sample,yk, isdrawn from a normal distribution (the uncorrelated dis-tribution). Ifm≥m*, then the gene’s expression value is drawn from a Gaussian distribution with mean -axkand
variance (1 -a2), wherexkis the expression value of the
TF for thekthsample. The latter step follows from the fact that the co-expression distribution for correlated data can be written aspc(x, y) = pu(x)pc(y|x) wherepc(y| x) is a Gaussian with mean -axand variance (1 -a2).
Results and Discussion
Synthetic Data
Given a pair of genes with a mixed set of correlated and uncorrelated samples, and also a modifier gene whose expression is correlated with the two types of samples, we tested whether our method can detect the correct modifier, which implicitly requires the correct identifica-tion of the sample partiidentifica-tion. Details of the simulaidentifica-tion are provided in §Methods. We generated 1500 non-overlapping TF-Gene-Modifier triplets and for each gene in the triplet we generated the expression data for 300 samples based on an underlying model, parameter-ized by fanda. We selected a range of parameters and tested the effect of these parameters on the method accuracy. Intuitively, Mimosa will work best for values offnear 1/2 and for values ofaclose to ± 1. Five differ-ent values offwere chosen that broadly encompass the value off= 0.5. As the sign ofa does not affect Mimo-sa’s ability to partition the data samples, we chose only positive values of a. The three values ofachosen were based on their corresponding aspect ratios (see §Meth-ods); namely aspect ratios of 2, 3, and 5. Not surpris-ingly, the performance of Mimosa deteriorates for
aspect ratios below 2, that is, when the correlation is very poor even for the correlated samples (not shown). Each parameter bin contained 100 TF-Gene-Modifier triplets (15 bins × 100 triplets per bin = 1500 triplets, and 3 × 1500 triplets = 4500 total genes). For each of the 1500 TF-Gene pairs, we applied Mimosa to estimate the sample partition and then ranked all 4500 genes based on the weighted t-test p-value of their partitioned expression values (see §Methods). For each 2-dimen-sional bin (f and a value), we computed the median rank (out of 4500 candidates) of the correct modifier for the 100 TF-Gene pairs in the bin. We also computed the fraction of the 100 TF-Gene pairs for which the cor-rect modifier had the highest rank.
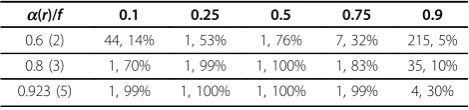
As shown in Table 1, Mimosa detects the correct sam-ple partition and the correct modifier with high accu-racy. Overall, in 64.6% of the cases, the correct modifier is detected at the top rank. When the TF-Gene pair is uncorrelated in 90% of the samples (last column) then it is relatively difficult to detect the modifier. Even then, if the correlation is strong (aspect ratio of 5) then Mimosa can still detect the modifier with very high accuracy. Note that the highest median rank, 215 for thea = 0.6 andf= 0.9 bin, when represented as a percentile out of 4500 candidates, is only 215/4500 = 4.8%.
Application to Bovine data
Hudson et al., have compared expression profiles in two different genetic crosses (denotedPandW) of cattle at dif-ferent developmental time points. ThePtype has a mutant form of TF Myostatin which results in dysregulation of TGF-bpathway and increased muscle mass [10]. The expression level of Myostatin was not different in these two types. They further identified differentially expressed genes betweenPandW, and for each such gene, and for each of the 920 putative regulators, they computed the expression correlation between the gene and the regulator, separately inPand inWsamples. Based on these pair-wise correlations in the two sets of samples, they identified 424 regulator-gene pairs such that the expression correla-tion between the two was significantly different when using expression data fromPcompared with the expres-sion correlation when using expresexpres-sion data fromW. This data provides an ideal test bed for our approach.
Table 1 Performance of Mimosa on synthetic data.
a(r)/f 0.1 0.25 0.5 0.75 0.9
0.6 (2) 44, 14% 1, 53% 1, 76% 7, 32% 215, 5%
0.8 (3) 1, 70% 1, 99% 1, 100% 1, 83% 35, 10%
0.923 (5) 1, 99% 1, 100% 1, 100% 1, 99% 4, 30%
We tested how well Mimosa partitions the expression samples intoPandWwithout any prior knowledge. We subjected each of the 424 regulator-gene pairs to the mixture modeling, using the 20 expression profiles (10 for P and 10 forW) provided in [10]. This resulted in 424 partition probability vectors q, each of length 20 (see §Methods). If the mixture modeling is effective, we expect {q1, ..., q10} (corresponding to P) to be
signifi-cantly different from {q11, ...,q20} (corresponding toW),
with one being high, and the other being low. We tested this hypothesis using the Wilcoxon test and found that for 109(26%) of the 424 pairs, the p-value≤0.05. Thus the mixture modeling correctly retrieves the hidden sample partition in many cases, even with a small num-ber of expression samples.
Application to Yeast
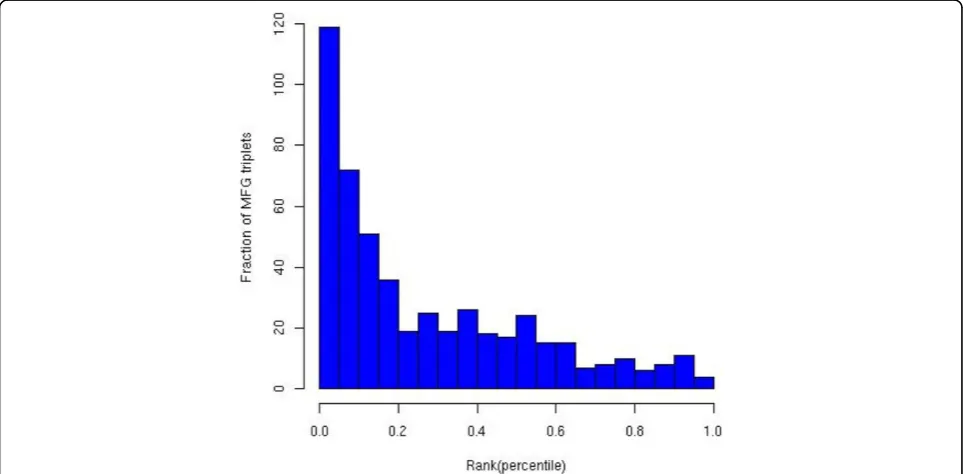
We have previously reported a database - PTM-Switch-board [13], which now contains 510 yeast gene triplets, termed “MFG-triplets”, where a transcription factor (F) regulates a gene (G) and this regulation is modulated by post-translational modification of F by a modifying enzyme (M). We tested whether, for the given F-G pair, Mimosa can correctly partition a set of expression sam-ples and detect the modifier M. For the expression data, we used 314S. cerevisiae expression samples previously compiled in [14] from 18 different studies. These experi-ments included cell cycle and a variety of stress condi-tions. We applied Mimosa to each F-G pair and then computed the correlation (using Kendall’s Tau) of the sample partition probability vector q (see §Methods)
and the expression vector of all 6000 yeast genes. We then computed the ranks (in percentile) of the correct modifiers. As shown in Figure 2, we found that Mimosa detects the true modifier among the top 5% in 23% of the cases, a ~5-fold enrichment over random expectation.
To test the large-scale applicability of Mimosa, we extracted all yeast TF-Gene pairs detected in a genome-wide ChIP-chip experiment [15]. To reduce the number of gene-pairs to be tested we performed the following filtering steps. For each pair we computed their expres-sion correlation using Kendall’s Tau across the 314 expression samples. We retained the pairs for which the Kendall’s Tau Bonferroni-corrected p-value ≤0.05. After applying Mimosa, we further filtered this set to retain only the cases where the mixing probability parameterf was between 0.45 and 0.55 and the aspect ratio para-meter a had an absolute value of at least 0.8 (highly correlated). For each of the 6960 TF-Gene pairs thus obtained we computed the corresponding partition probability vector q.
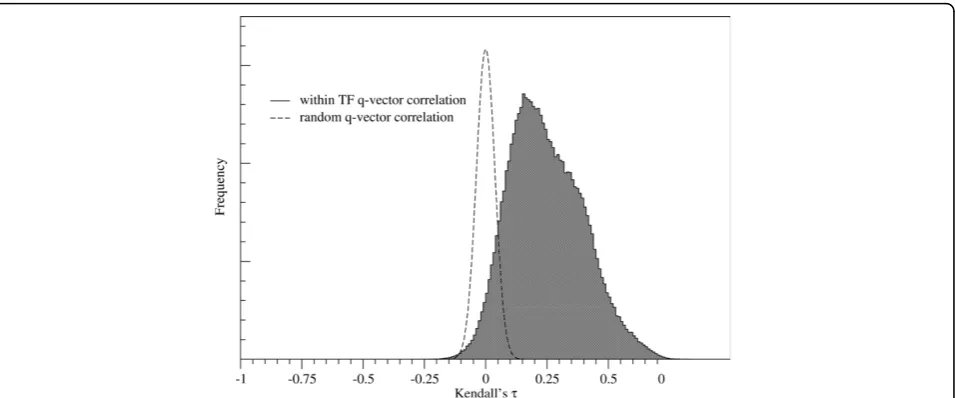
Each TF has a set ofq-vectors, one corresponding to every target gene of the TF. Biologically, we expect the partitioning of samples into correlated and uncorrelated to depend mainly on whether or not the TF is active. If this were the case, then there should be a correlation between the set ofq-vectors for a TF. As shown in Fig-ure 3, the Kendall Tau correlation amongq-vectors with the same TF does indeed have a distribution that is sig-nificantly skewed towards positive values, relative to the
correlations between randomly chosen q-vectors. This result provides some evidence that theq-vector partition found by Mimosa contains biological information.
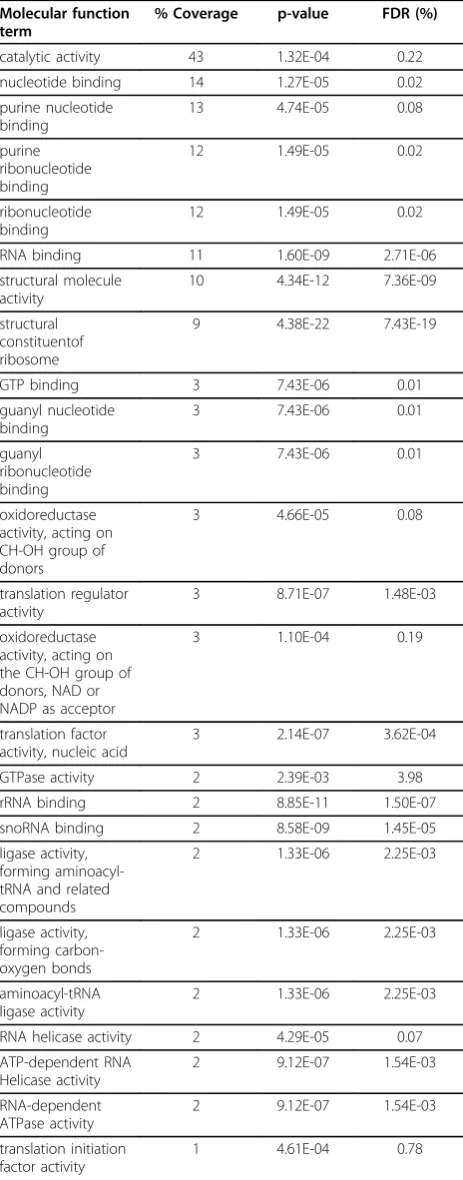
We then calculated the correlation between every gene’s expression vector E and each pair’s q vector.
“Modifiers” for each pair were deemed to be those genes whose correlation qualified a Bonferroni-cor-rected, weighted t-statistic p-value threshold of 0.05. We used a weighted t-statistic, as opposed to Kendall’s Tau, primarily for computational efficiency. We then per-formed a functional enrichment analysis on the 1356 putative modifier genes thus obtained using the DAVID tool (david.abcc.ncifcrf.gov). Table 2 shows the enriched (FDR < 5%) molecular functions sorted by the fraction of input genes annotated to have that function. The most abundant molecular function category was“ cataly-tic activity”, which is consistent with the role of modify-ing enzymes. This enrichment holds even when we selected the single most significant modifier for each TF-Gene pair. Further work needs to be done to analyze the biological significance of specific modifiers detected.
Application to STAT1
Transcription factor STAT1 plays a critical role in B cell function and B cell cancers [16]. STAT1 activity is known to be controlled via a variety of post-translational modifications [17-20]. We attempted to detect potential upstream modulators of STAT1 in B cells using Mimosa. We obtained a set of genes from [21] reported to be STAT1 targets and manually mapped these to 50 transcripts. We also obtained a compendium of 336 expression samples in human B cells from [6], which includes samples from human blood, cancers, and cell
lines based on the HG-U95Av2 Affymetrix arrays. We then applied Mimosa to all pairs consisting of a STAT1 probe and a probe corresponding to one of the targets. Applying the criteria of 0.3 ≤f≤ 0.7 and |a|≥ 0.8, we obtained 10 targets whose expressions were correlated with that of STAT1 in a subset of samples. We then detected 34 genes whose expression was correlated with partition vector q (see Methods) with a p-value≈0.
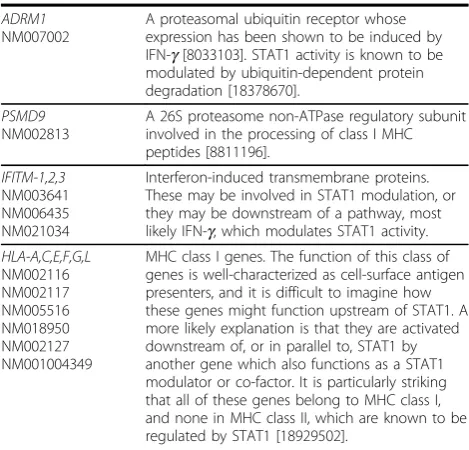
The 34 detected include a number of modifying enzymes such as kinases and phosphotases, as well as transcription factors and co-factors, and membrane receptors. A number of the genes are involved in or per-ipherally related to IFN-gamma signaling, which is the major activator of STAT1 [22], as well as TGF-beta and NF-kappaB signaling, both of which are important in B cell apoptosis/survival. Several of the the detected genes, namely GRK5 and UBE21, have known roles in JAK-STAT signaling. It is possible that these detected genes may play a mechanistic role in the cross-talk between pathways affecting STAT1 activity. However, we cannot rule out the possibility that some of these genes actually operate downstream of or in parallel to STAT1, in which case their correlation with the partition vector q is due to some shared and undetected upstream modu-lator. We have summarized these findings for 24 of the 34 genes in Table 3. We could not find any plausible link with STAT1 for the other 10 genes.
Conclusions
For a pair of co-expressed genes (XandY), we have pre-sented a mixture modeling approach to partition the expression samples in order to detect the specific subset
Table 2 GO molecular functions enriched in the putative modifiers detected for the TF-Gene pairs inS. cerevisiae based on ChIP-chip data and 314 expression samples.
Molecular function term
% Coverage p-value FDR (%)
catalytic activity 43 1.32E-04 0.22
nucleotide binding 14 1.27E-05 0.02
purine nucleotide binding
13 4.74E-05 0.08
purine ribonucleotide binding
12 1.49E-05 0.02
ribonucleotide binding
12 1.49E-05 0.02
RNA binding 11 1.60E-09 2.71E-06
structural molecule activity
10 4.34E-12 7.36E-09
structural constituentof ribosome
9 4.38E-22 7.43E-19
GTP binding 3 7.43E-06 0.01
guanyl nucleotide binding
3 7.43E-06 0.01
guanyl ribonucleotide binding
3 7.43E-06 0.01
oxidoreductase activity, acting on CH-OH group of donors
3 4.66E-05 0.08
translation regulator activity
3 8.71E-07 1.48E-03
oxidoreductase activity, acting on the CH-OH group of donors, NAD or NADP as acceptor
3 1.10E-04 0.19
translation factor activity, nucleic acid
3 2.14E-07 3.62E-04
GTPase activity 2 2.39E-03 3.98
rRNA binding 2 8.85E-11 1.50E-07
snoRNA binding 2 8.58E-09 1.45E-05
ligase activity, forming aminoacyl-tRNA and related compounds
2 1.33E-06 2.25E-03
ligase activity, forming carbon-oxygen bonds
2 1.33E-06 2.25E-03
aminoacyl-tRNA ligase activity
2 1.33E-06 2.25E-03
RNA helicase activity 2 4.29E-05 0.07
ATP-dependent RNA Helicase activity
2 9.12E-07 1.54E-03
RNA-dependent ATPase activity
2 9.12E-07 1.54E-03
translation initiation factor activity
1 4.61E-04 0.78
Table 3 Potential modulators of STAT1 activity detected by Mimosa using the known STAT1 targets and gene expression data from normal B cell and B cell cancers.
Gene Name Evidence
Refseq Id [Pubmed Id for the references are provided in square brackets]
Modifying Enzymes
GRK5 NM005308
A Ser/Ther protein kinase that functions upstream of the JAK-STAT signal transduction pathway according to the KEGG pathway database http:// www.genome.jp/kegg.
UBE21 NM194261
An E2 SUMO-conjugating enzyme implicated in SUMOylation of STAT1 in conjunction with PIAS1 [12855578, 12764129].
DUSP1 NM004417
A dual specificity protein phosphatase. STAT1 is known to be primarily regulated by reversible tyrosine phosphorylation. DUSP1 has been shown to function in a JAK2-dependent manner [14551204] and the members of the JAK family are the canonical regulators of STATs, thus suggesting DUSP1 as a potential upstream modulator of STAT1.
SIK1 NM173354
A Ser/Thr kinase that negatively regulates the TGF-bpathway [18725536]. IFN-gsignaling is mediated via STAT1, while TGF-band IFN-g pathways are known to be directly antagonistic to each other [17116388], thus suggesting a role for SIK1 modulation of STAT1 in pathway cross-talk.
INPP1 NM002194
A phosphatase functioning upstream of major kinases such as AKT/PKB
(KEGG pathway), which are known to mediate apoptotic signaling in B cells [17928528].
Receptors
CD69 NM001781
An early activation antigen functioning downstream of IFN-g[12718936], and STAT1 activation is known to be interferon-responsive.
LGALS8 NM201543
Modulates cellular growth through up-regulation of p21 [15753078], which in turn is regulated by the STAT1 homolog STAT5A [12393707].
SELL NM000655
Belongs to a family of adhesion/homing receptors which play important roles in leukocyte-endothelial cell interaction [12370391], while STAT1 also plays a crucial role in leukocyte-infiltration into the liver in T cell hepatitis [15246962].
Transcription factors and co-factors
DIP NM198057
Glucocorticoid-induced leucine zipper (GILZ) interacts with NF-kappaB
[17169985] which is known to play a key role in B cell function.
IRF7 NM004031
An interferon regulatory factor 7, belonging to the same TF family as two known STAT1 co-factors, IRF-1 and IRF8 [18929502].
POLR2J NM006234
Co-induced with STAT3 by HIV-1 gp120 [12089333].
POLR2J2 NM032959
Related to POLR2J.
ZNHIT3 NM004773
A zinc finger transcription factor known to be a HNF-4aco-activator [11916906]. However, we did not find a potential link with STAT1.
of samples whereXandYexpressions are strongly cor-related. In some cases, such a partition may help detect other genes likely to modulate the expression correlation betweenXandY. Such a potential modulator is charac-terized by having differential expression in the two sam-ple partitions. A few previous investigations closely relate to our work. In [10] and in [11], given two sets of expression samples, the authors explicitly search for
gene-pairs whose expression correlations are
significantly different in the two sets of samples. A dif-ferent approach, termed Liquid Association, explicitly tries to detect gene triplets (X, Y,Z) where the change in correlation betweenX andYvaries with the changes in the value of Z [23]. This approach implicitly parti-tions the expression samples based on the modulator gene expression. In contrast, our approach partitions the expression samples without any knowledge of the mod-ulator gene and proceeds with the search for modmod-ulator genes in a subsequent step.
In a genome-wide application, such as in the yeast application presented above, in principle, one can apply a Log-Likelihood Ratio (LLR) test, where the likelihood of the mixture model with a freefandaparameters is com-pared with the likelihood of a model wheref= 0 and only ais free. The log of the ratio of the two likelihoods can be used to assess significance of the partition based on a c2
distribution. While it is appealing to use the LLR test to assess the significance of the mixture model, we found that our empirical distribution does not follow ac2 distri-bution (Figure 4). Our next thought was to use an empirically derived p-value for the mixture likelihood by randomly permuting the expression data. However, the empirical distributions of the likelihood itself varied sig-nificantly among different gene-pairs and thus we could not use a global distribution. Unfortunately, the number of permutations desired for an adequately resolved p-value is computationally infeasible if done for each gene-pair separately. Thus, as a practical compromise, in the genome-wide yeast application, we chose to only con-sider gene-pairs with a Bonferroni-corrected global Ken-dall’s Tau correlation p-value≤0.05.
Table 3: Potential modulators of STAT1 activity detected by Mimosa using the known STAT1 targets and gene expression data from normal B cell and B cell cancers.(Continued)
ADRM1 NM007002
A proteasomal ubiquitin receptor whose expression has been shown to be induced by IFN-g[8033103]. STAT1 activity is known to be modulated by ubiquitin-dependent protein degradation [18378670].
PSMD9 NM002813
A 26S proteasome non-ATPase regulatory subunit involved in the processing of class I MHC peptides [8811196].
IFITM-1,2,3 NM003641 NM006435 NM021034
Interferon-induced transmembrane proteins. These may be involved in STAT1 modulation, or they may be downstream of a pathway, most likely IFN-g, which modulates STAT1 activity. HLA-A,C,E,F,G,L
NM002116 NM002117 NM005516 NM018950 NM002127 NM001004349
MHC class I genes. The function of this class of genes is well-characterized as cell-surface antigen presenters, and it is difficult to imagine how these genes might function upstream of STAT1. A more likely explanation is that they are activated downstream of, or in parallel to, STAT1 by another gene which also functions as a STAT1 modulator or co-factor. It is particularly striking that all of these genes belong to MHC class I, and none in MHC class II, which are known to be regulated by STAT1 [18929502].
We face a similar challenge in the second phase of the approach, where, given the mixture model and the sam-ple partition probability vector q, we search for modu-lator genes based on the correlation of their expression vectors with q. For a large number of trials (number of candidate modulators), a non-parametric test of correla-tion, such as Kendall’s Tau, becomes infeasible. Thus, as another practical compromise, we devised the weighted t-test, which works well for the synthetic data. For the small-scale yeast application on specific (X, Y, Z )-tri-plets, we used Kendall’s Tau but for the large-scale application we used weighted t-statistic. A more detailed study needs to be done to carefully assess the effect of these practical choices on the method’s accuracy and efficacy.
Our mixture modeling may be most effective in cases such as the one described in [10], where the sample par-tition is clearly characterized by a single (unknown) mutant gene. In most practical situations, based on pub-licly available compendiums of expression data, this may not be the case. Regulatory relationships in eukaryotes have multiple determinants and it is possible that even if the method does detect the“correct” partition, it may be difficult to evaluate the biological significance of the sample partition based on the differential expression of a single modulator gene.
In summary, our work contributes a novel approach to the problem of partitioning expression samples and detecting potential modulators of expression correlation between a pair of genes. While this approach is likely to be effective in specific cases, as discussed above, statisti-cal and computational challenges remain to be resolved and further work needs to be done to harness the approach in a large-scale application.
Acknowledgements
SH is supported by NIH R01-GM-085226, MH is supported by NIH R21-GM-078203, LE is supported by NIH T32-HG-000046 and LS is supported by NIH T32-HG-000046. A version of this paper was published in the WABI 2009 conference proceedings.
Authors’contributions
SH, LE, and MH conceived the project. MH developed the algorithm and implemented it. LS helped with microarray data processing and general statistical issues. LE helped with STAT1 analysis. SH and MH wrote the manuscript.
Competing interests
The authors declare that they have no competing interests.
Received: 14 July 2009
Accepted: 4 January 2010 Published: 4 January 2010
References
1. Tornow S, Mewes HW:Functional modules by relating protein interaction networks and gene expression.Nucleic Acids Res2003,31(21):6283-9. 2. Stuart JM, Segal E, Koller D, Kim SK:A gene-coexpression network for
global discovery of conserved genetic modules.Science2003,
302(5643):249-55.
3. von Mering C, Jensen LJ, Kuhn M, Chaffron S, Doerks T, Kruger B, Snel B, Bork P:STRING 7-recent developments in the integration and prediction of protein interactions.Nucleic Acids Res2007, ,35 Database:D358-62. 4. Magwene PM, Kim J:Estimating genomic coexpression networks using
first-order conditional independence.Genome Biol2004,5(12):R100. 5. Margolin AA, Nemenman I, Basso K, Wiggins C, Stolovitzky G, Dalla
Favera R, Califano A:ARACNE: an algorithm for the reconstruction of gene regulatory networks in a mammalian cellular context.BMC Bioinformatics2006,7(Suppl 1):S7.
6. Basso K, Margolin AA, Stolovitzky G, Klein U, Dalla-Favera R, Califano A:
Reverse engineering of regulatory networks in human B cells.Nat Genet 2005,37(4):382-90.
7. Vaquerizas JM, Kummerfeld SK, Teichmann SA, Luscombe NM:A census of human transcription factors: function, expression and evolution.Nat Rev Genet2009,10(4):252-63.
8. Khidekel N, Hsieh-Wilson LC:A‘molecular switchboard’-covalent modifications to proteins and their impact on transcription.Org Biomol Chem2004,2:1-7.
9. Steinfeld I, Shamir R, Kupiec M:A genome-wide analysis in Saccharomyces cerevisiae demonstrates the influence of chromatin modifiers on transcription.Nat Genet2007,39(3):303-9.
10. Hudson NJ, Reverter A, Dalrymple BP:A differential wiring analysis of expression data correctly identifies the gene containing the causal mutation.PLoS Comput Biol2009,5(5):e1000382.
11. Hu R, Qiu X, Glazko G, Klebanov L, Yakovlev A:Detecting intergene correlation changes in microarray analysis: a new approach to gene selection.BMC Bioinformatics2009,10:20.
12. Barrett T, Troup DB, Wilhite SE, Ledoux P, Rudnev D, Evangelista C, Kim IF, Soboleva A, Tomashevsky M, Marshall KA, Phillippy KH, Sherman PM, Muertter RN, Edgar R:NCBI GEO: archive for high-throughput functional genomic data.Nucleic Acids Res2009, ,37 Database:D885-90. 13. Everett L, Vo A, Hannenhalli S:PTM-Switchboard-a database of
posttranslational modifications of transcription factors, the mediating enzymes and target genes.Nucleic Acids Res2009, ,37 Database:D66-71. 14. Chen G, Jensen ST, Stoeckert JCJ:Clustering of genes into regulons using
integrated modeling-COGRIM.Genome Biol2007,8:R4.
15. Harbison CT, Gordon DB, Lee TI, Rinaldi NJ, Macisaac KD, Danford TW, Hannett NM, Tagne JB, Reynolds DB, Yoo J, Jennings EG, Zeitlinger J, Pokholok DK, Kellis M, Rolfe PA, Takusagawa KT, Lander ES, Gifford DK, Fraenkel E, Young RA:Transcriptional regulatory code of a eukaryotic genome.Nature2004,431(7004):99-104.
16. Lin TS, Mahajan S, Frank DA:STAT signaling in the pathogenesis and treatment of leukemias.Oncogene2000,19(21):2496-504.
17. Wen Z, Zhong Z, Darnell JJE:Maximal activation of transcription by Stat1 and Stat3 requires both tyrosine and serine phosphorylation.Cell1995,
82(2):241-50.
18. Rogers RS, Horvath CM, Matunis MJ:SUMO modification of STAT1 and its role in PIAS-mediated inhibition of gene activation.J Biol Chem2003,
278(32):30091-7.
19. Kramer OH, Knauer SK, Zimmermann D, Stauber RH, Heinzel T:Histone deacetylase inhibitors and hydroxyurea modulate the cell cycle and cooperatively induce apoptosis.Oncogene2008,27(6):732-40.
20. Soond SM, Townsend PA, Barry SP, Knight RA, Latchman DS, Stephanou A:
ERK and the F-box protein betaTRCP target STAT1 for degradation.J Biol Chem2008,283(23):16077-83.
21. Robertson G, Hirst M, Bainbridge M, Bilenky M, Zhao Y, Zeng T, Euskirchen G, Bernier B, Varhol R, Delaney A, Thiessen N, Griffth OL, He A, Marra M, Snyder M, Jones S:Genome-wide profiles of STAT1 DNA association using chromatin immunoprecipitation and massively parallel sequencing.Nat Methods2007,4(8):651-7.
22. Gough DJ, Levy DE, Johnstone RW, Clarke CJ:IFNgamma signaling-does it mean JAK-STAT?.Cytokine Growth Factor Rev2008,19(5-6):383-94. 23. Li KC:Genome-wide coexpression dynamics: theory and application.Proc
Natl Acad Sci USA2002,99(26):16875-80.
doi:10.1186/1748-7188-5-4