R E S E A R C H
Open Access
A new method to estimate parameters of the
growth model for metastatic tumours
Esmaeil Mehrara
1,4*, Eva Forssell-Aronsson
1,4, Viktor Johanson
2, Lars Kölby
2, Ragnar Hultborn
3and Peter Bernhardt
1,4* Correspondence: e.mehrara@radfys.gu.se 1Department of Radiation Physics, University of Gothenburg, Sahlgrenska University Hospital, SE - 413 45 GöteborgSweden 4Department of Medical physics and Biomedical Engineering, Sahlgrenska University Hospital, Göteborg, Sweden
Full list of author information is available at the end of the article
Abstract
Purpose:Knowledge of natural tumour growth is valuable for understanding
tumour biology, optimising screening programs, prognostication, optimal scheduling of chemotherapy, and assessing tumour spread. However, mathematical modelling in individuals is hampered by the limited data available. We aimed to develop a method to estimate parameters of the growth model and formation rate of metastases in individual patients.
Materials and methods:Data from one patient with liver metastases from a primary
ileum carcinoid and one patient with lung metastases from a primary renal cell carcinoma were used to demonstrate this new method. Metastatic growth models were estimated by direct curve fitting, as well as with the new proposed method based on the relationship between tumour growth rate and tumour volume. The new model was derived from the Gompertzian growth model by eliminating the time factor (age of metastases), which made it possible to perform the calculations using data from all metastases in each patient. Finally, the formation time of each metastasis and, consecutively, the formation rate of metastases in each patient were estimated.
Results:With limited measurements in clinical studies, fitting different growth curves was insufficient to estimate true tumour growth, even if patients were followed for several years. Growth of liver metastases was well described with a general growth model for all metastases. However, the lung metastases from renal cell carcinoma were better described by heterogeneous exponential growth with various growth rates.
Conclusion:Analysis of the regression of tumour growth rate with the logarithm of tumour volume can be used to estimate parameters of the tumour growth model and metastasis formation rates, and therefore the number and size distribution of metastases in individuals.
Keywords:Modelling tumour growth, Metastasis, Dissemination, Gompertzian
Introduction
Studying natural tumour growth is valuable for understanding tumour biology, op-timising screening programs, prognostication [1], optimal scheduling of chemotherapy [2], and assessing tumour spread (number and size distribution of metastases, inclu-ding micro-metastases) [3,4]. Mathematical models such as the exponential and the Gompertzian growth models are usually used to describe tumour growth. The growth
© 2013 Mehrara et al.; licensee BioMed Central Ltd. This is an Open Access article distributed under the terms of the Creative Commons Attribution License (http://creativecommons.org/licenses/by/2.0), which permits unrestricted use, distribution, and reproduction in any medium, provided the original work is properly cited.
of a tumour can be described by a curve defined by the selected model, where the tumour volume (V) is a function of time (t): V = f(t).
The exponential model is a simple growth model of solid tumours. Assuming expo-nential tumour growth, the growth rate can be calculated from tumour volume mea-surements from at least two occasions, either as the tumour volume doubling time (DT) or the specific growth rate (SGR) [5]. DT is the time needed for a tumour to double its volume, and SGR is the relative volume increase per unit time, given in %/day. If the tumour volume is measured at times t0and t, the following equation is valid [5]:
V¼V0eSGR t−tð 0Þ ð1Þ
The above equation shows that SGR is equivalent to the exponential growth constant of the tumour. In other words:
SGR¼ 1
V dV
dt ð2Þ
If tumour volume is measured on two occasions, t1 and t2, then the SGR of the tumour during the period of observation can be calculated as:
SGR¼ln Vð 2=V1Þ
t2−t1 ð
3Þ
where V1and V2 are the tumour volume at t = t1and t2, respectively. SGR is recipro-cally related to DT as follows:
SGR¼ln 2ð Þ
DT : ð4Þ
We have previously demonstrated that SGR is less affected by measurement uncer-tainties than DT, and is a better variable to characterise tumour growth rate [5,6].
According to the exponential model, the tumour’s SGR is constant and independent of tumour volume. However, studies have shown that tumour growth rate may decline with time [7-9] (i.e., non-exponential growth).
The Gompertzian model is widely used to describe the growth of non-exponentially growing tumours. According to the Gompertzian growth model, the variation of tumour volume with respect to time is as follows:
V¼V0e SGR0
λ 1−e−λðt−t0Þ
ð5Þ
where SGR0is the initial tumour growth rate at t = t0, andλis the growth deceleration constant. When λ approaches zero, the Equation 5 reduces to Equation 1 (i.e., the ex-ponential growth model).
non-exponential growth curves) are very rare, and the exponential model is most com-monly used [10].
The aim of this study was to develop a new method to estimate the parameters of the non-exponential growth model for metastatic tumours in patients. To demonstrate the applicability of the new proposed method, we applied the method to data from one pa-tient with liver metastases arising from a primary ileum carcinoid and one papa-tient with lung metastases arising from a primary renal cell carcinoma.
Materials and methods
Patients
Data from two patients were used in this study. The first patient was diagnosed with pri-mary midgut carcinoid and liver metastases. The pripri-mary tumour was surgically resected in 1995. Growth data were obtained from eight computed tomography (CT) examinations performed annually during 1995–2002. During this period, the patient was treated with octreotide (Sandostatin, Sandoz/Novartis, Basel, Switzerland) for hormonal symptom re-lief, and interferon alfa-2b (IntronA, Schering-Plough Corporation, New Jersey, USA) was administered on three occasions without clinical response. The volume of each tumour was measured by point counting: a transparent paper marked with square millimeters was used to measure the tumour area in CT slices, and the tumour volume in the slice was es-timated by multiplying the tumour area by the slice thickness. The total tumour volume was calculated as the sum of tumour volumes from the individual CT slices.
The second patient was diagnosed with primary renal cell carcinoma with lung me-tastases. Renal cancer is notoriously chemotherapy resistant. During the 1980th bio-logical therapy with interferon with few responses, but considerable toxicity, was introduced and in the 1990th also IL2 was added, again with modest efficacy but with significant side effects [11]. Due to the frequently very slow disease progression with few symptoms (as in this case), many oncologists in the Scandinavian countries pre-ferred expectation. The frequent X-ray investigations were probably done for psycho-logical reasons. Therefore, this patient was untreated and we studied the natural growth of seven lung metastases in this patient. A total of 32 conventional two-dimensional AP chest radiographs collected from 1989 to 1999 were available. The area of each tumour in each radiograph was estimated using Osirix (cf. http://www. osirix-viewer.com/). Each tumour was assumed to be equal to the volume of a sphere with the diameter of a circle with the same area as the estimated tumour area in the radiograph. Because the lining border of the tumour could not be clearly defined in all images, the number of available data points may vary for different metastatic tumour masses.
All CT and X-ray imaging data used in this study concern deceased persons and were retrieved retrospectively from the patient imaging database at Sahlgrenska University Hospital, Gothenburg, Sweden. This type of information on deceased persons is exempt from ethical approval according to the Ethical Review Act in Sweden (2003:460).
Studying the tumour growth model
We first attempted to estimate the growth model of each tumour by direct curve fitting, where it was not possible to select the most probable growth model of each
Mehraraet al. Theoretical Biology and Medical Modelling2013,10:31 Page 3 of 12
metastasis directly. However, exponential growth rates were higher for smaller tumours than for larger tumours, possibly as a result of growth deceleration as tumours grow (the Gompertzian growth model). Therefore, we developed a new mathematical method assuming that, in each patient, the smaller metastases represent the growth of larger metastases when they were of small size and vice versa. Based on this assump-tion, all metastases of the same type, in the same tissue and in the same patient, follow a general Gompertzian growth model; variations in growth rates are because of volu-metric differences. If the time of formation of each metastasis were available, it would be possible to estimate the parameters of such a general Gompertzian model by fitting the Gompertzian curve to data from all metastases in a single curve fitting. However, the formation time of each metastasis can, in turn, be estimated only if the growth model of the metastasis is known. Therefore, we reformulated the Gompertzian curve (i.e., Equation 5) by eliminating the time parameter. From Equations 2 and 5, the rela-tion between SGR and tumour volume is as follows (see Appendix A):
SGR¼SGR0−λln Vð =V0Þ ð6Þ
Equation 6 does not include time, which makes it possible to use data from all metas-tases of the same type in a single patient without knowing the age of each individual tumour. Equation 6 shows that the regression of tumour SGR with the logarithm of its volume is linear if the growth model is Gompertzian. Therefore, the parameters of the general Gompertzian growth model of metastasis in each patient (SGR0andλ) can be estimated using the linear regression parameters in Equation 6.
This method was applied to our patient data as follows. (1) SGR values were calcu-lated for each metastasis, using Equation 3 for each pair of consecutive tumour volume measurements. (2) The logarithm of the geometric mean of the two volumes (used in stage 1) was calculated for each pair of consecutive tumour volume measurements of each metastasis. (3) Using all SGRs (stage 1) and volumes (stage 2) from all metastases in each patient, λ and SGR0 were estimated using the linear regression parameters in Equation 6, assuming V0= 10-9cm3(one cell). (4) Equation 5 with the estimated λand SGR0values (from stage 3) was assumed to represent the general Gompertzian growth curve of all metastases in each patient. According to this assumption, the general growth curve can describe the growth of each metastasis when the time origin is changed (i.e., the curve is shifted backward and forward). Therefore, (5) the general growth curve was fitted to the volume of each metastasis with time origin as a variable, and the formation time of each metastasis was estimated using the best fit for each tumour.
All curve fittings were performed using Matlab 6.5.1 with the curve fitting toolbox (The MathWorks, USA).
Results
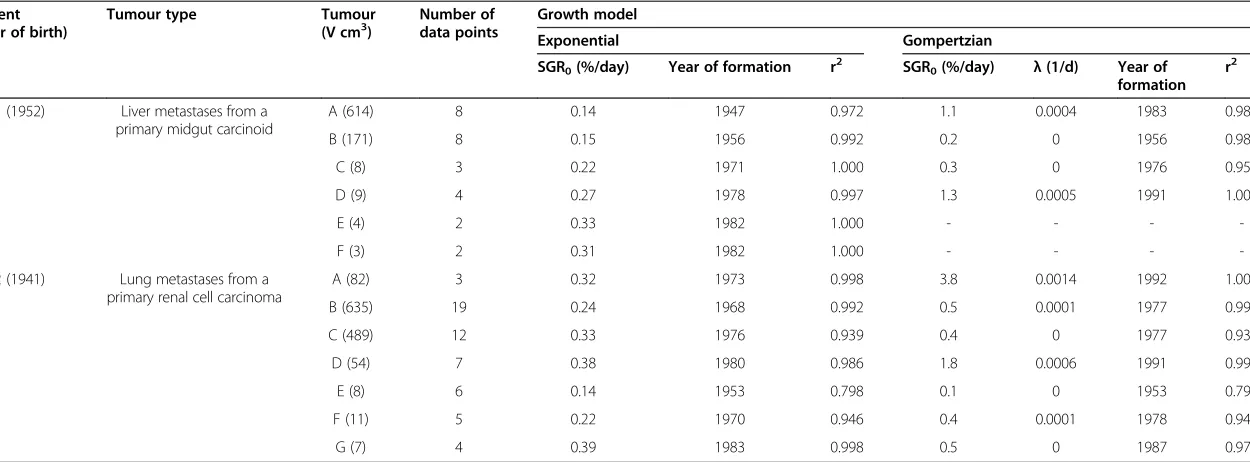
Table 1 Results of direct curve fitting of the exponential and the Gompertzian growth models to tumour volume data from two patients
Patient (year of birth)
Tumour type Tumour
(V cm3) Number ofdata points Growth model
Exponential Gompertzian
SGR0(%/day) Year of formation r2 SGR0(%/day) λ(1/d) Year of
formation r2
1 (1952) Liver metastases from a primary midgut carcinoid
A (614) 8 0.14 1947 0.972 1.1 0.0004 1983 0.988
B (171) 8 0.15 1956 0.992 0.2 0 1956 0.989
C (8) 3 0.22 1971 1.000 0.3 0 1976 0.954
D (9) 4 0.27 1978 0.997 1.3 0.0005 1991 1.000
E (4) 2 0.33 1982 1.000 - - -
-F (3) 2 0.31 1982 1.000 - - -
-2 (1941) Lung metastases from a primary renal cell carcinoma
A (82) 3 0.32 1973 0.998 3.8 0.0014 1992 1.000
B (635) 19 0.24 1968 0.992 0.5 0.0001 1977 0.993
C (489) 12 0.33 1976 0.939 0.4 0 1977 0.938
D (54) 7 0.38 1980 0.986 1.8 0.0006 1991 0.990
E (8) 6 0.14 1953 0.798 0.1 0 1953 0.791
F (11) 5 0.22 1970 0.946 0.4 0.0001 1978 0.944
G (7) 4 0.39 1983 0.998 0.5 0 1987 0.970
SGR0, r, andλare the SGR value at the time of tumour formation, the correlation coefficient, and the Gompertzian growth deceleration constant, respectively. Curve fitting of the Gompertzian model was not possible
for liver tumours E and F because too few data points were available. V: Maximum tumour volume.
Mehrara
et
al.
Theoreti
cal
Biology
and
Medical
Modelling
2013,
10
:31
Page
5
o
f
1
2
http://ww
w.tbiomed
.com/content
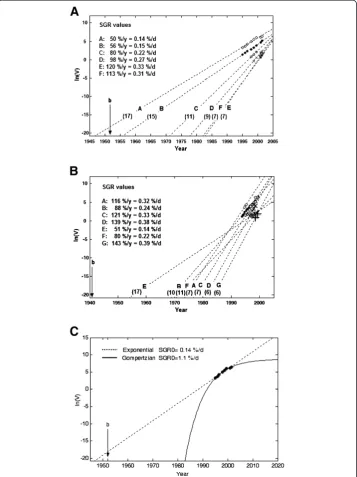
the direct model fitting, it was not possible to select the most probable growth model for each tumour. However, the estimated tumour formation times and SGR0values dif-fered when estimated by the different models. The estimated formation year of liver tumour A, obtained by the exponential fit model, was 1947, which is 5 years before the birth of the patient (1952) and, therefore, not realistic. For the best exponential fits, the SGR values were 0.14-0.33%/day for liver metastases (Figure 1A) and 0.14-0.39%/day
for lung metastasis (Figure 1B), respectively. These values correspond to DT values of 7–17 and 6–17 months, respectively.
Figure 1C shows the best exponential and Gompertzian model curve fits for the vol-ume of liver metastasis A. Although both models fit well with tumour volvol-ume in a short time interval, the extrapolated tumour formation times differed by a large margin: 1947 and 1982 with the exponential and Gompertzian models, respectively. The esti-mated SGR at time of tumour formation (SGR0) differed by an order of magnitude: 0.14%/day and 1.1%/day with the exponential and the Gompertzian models, respec-tively. These values correspond to DT values of 17 months and 2 months, respecrespec-tively.
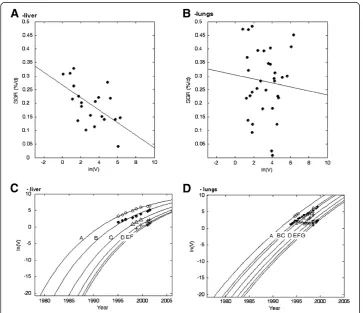
For the liver metastases, the negative correlation between SGR and the logarithm of tumour volume was statistically significant (r2= 0.33, p< 0.005), and the estimated λ and SGR0values were 0.00023 and 0.79%/day, respectively (Figure 2A). For the lung metastases, the correlation was not statistically significant. However, the estimated λ and SGR0values were 0.00007 and 0.46%/day, respectively (Figure 2B). Curve fitting of the general Gompertzian growth model to data for the metastases in each patient are depicted in Figure 2C,D. In each patient, the same growth curve was shifted in time to fit the volume of each metastasis.
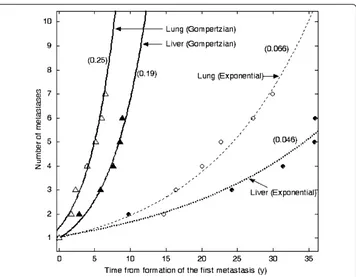
Figure 3 depicts the number of metastases as a function of time in each patient. The number of metastases increased exponentially with respect to time, assuming that the
Figure 2SGR vs. the logarithm of the volume of the metastases in the liver (A) and the lungs (B).
The best linear regression fits are shown. The correlation was statistically significant in the liver (r2= 0.33,
p< 0.005), but not in the lungs. The logarithm of the tumour volume vs. time for all metastases in the liver (C) and the lungs (D) with the general Gompertzian growth model curve fits.
Mehraraet al. Theoretical Biology and Medical Modelling2013,10:31 Page 7 of 12
tumours grow exponentially with different growth rates or according to a general Gompertzian model. The increase rate of the number of metastases based on the gene-ral Gompertzian model was higher than the rate based on the exponential model.
Discussion
Our results demonstrate that, when the observation of tumour growth is limited in time, fitting of different growth curves to the volume of each tumour is not sufficient to estimate the true metastatic growth. In two patients, direct curve fitting was insuffi-cient even when metastatic growths were followed for several years. Selection of the correct tumour growth model is crucial for further analyses of metastatic formation rate, number of metastases present, and response estimates in targeted radionuclide therapy [8].
Because the data available in clinical studies is limited, the exponential model is often used to characterise tumour growth. However, in the present study we demonstrated that extrapolation of different growth curves can generate diverse tumour formation times and metastasis formation rates (Figure 1C). This problem has also been addressed before, and some attempts to handle limited data more efficiently have been proposed. One method to assess tumour growth decline in clinical studies has been to calculate the correlation between DT and tumour volume [12,13]. However, by defin-ition this technique is not mathematically valid according to the Gompertzian growth model. The present study was therefore based on the linear regression of tumour SGR with the logarithm of tumour volume, a relation that was obtained by reformulating
the Gompertzian model. In addition, our approach enabled us to estimate metastasis formation times and rates. Akanuma previously attempted to find the model constants for the Gompertzian growth model using the linear correlation between growth rate and the logarithm of tumour volume [14]. Akanuma’s method was based on a graphic estimation of SGR at different tumour volumes. Tumours were scaled according to their doubling time, and very high or negative values were excluded. However, we have previously shown that negative and zero values should not be excluded from such cal-culations [5,6].
In the proposed method, a significant negative correlation between SGR and the loga-rithm of tumour volume indicates that growth deceleration is a dominating factor in the observed growth rate variations. In other words, the smaller tumours represent the growth of larger tumours when they were of small size and vice versa, and a general Gompertzian growth model (with specific SGR0and λ values) can describe the growth of all tumours. Lack of correlation between SGR and the logarithm of tumour volume indicates that biological factors other than growth deceleration dominate the observed growth rate variations. Thus, these tumours may grow exponentially with different growth rates or according to the Gompertzian model, but the model constants (SGR0 andλ) are heterogeneously distributed among tumours.
According to the linear regression of tumour SGR with the logarithm of tumour vol-ume, the liver metastases in the carcinoid patient probably grow according to a general Gompertzian growth model. This patient was treated with octreotide. Because, based on curve fitting results, no tumours in this patient deviated from exponential growth, the treatment was assumed to have no effect on tumour growth. The growth of lung metastases in the patient with renal cell carcinoma exhibited high variability with our proposed method, indicating that the renal cancer metastases in the lungs likely grew exponentially with different growth rates. To further strengthen the accuracy of the model selection, we extended our methodology by including analysis of the metastatic formation rate.
The exponential model presented to describe the metastasis formation rate does not depend on the origin of a metastasis (e.g., whether it originates from the primary or a metastatic lesion). The model described well the increase of the number of metastases growing exponentially with different growth rates, or growing according to a general Gompertzian model. This finding is similar to the results of a previous study that employed a different approach [3].
Our results showed that a decelerating growth model such as the Gompertzian model implies a higher metastasis formation rate than the exponential model. However, a higher metastasis formation rate does not necessarily mean a larger number of metas-tases at any time point, and the number of metasmetas-tases should be calculated for any specific time to compare different models. The time origin in Figure 3 is time of the formation of the first metastasis, which is different for different models. The estimated number of liver metastases at the time of primary surgery in the ileum carcinoid patient was 9 using the exponential model and 22 using the Gompertzian model. The value of 9 metastases did not reflect reality; 24 metastases were imaged aside from the studied metastases. Therefore, the Gompertzian model provided the best estimate of the num-ber of liver metastases. The estimated numnum-ber of lung metastases at the time of pri-mary surgery in the renal cell carcinoma patient was 14 according to the exponential
Mehraraet al. Theoretical Biology and Medical Modelling2013,10:31 Page 9 of 12
model and 84 according to the Gompertzian model. The value of 84 metastases is un-likely to reflect reality, because only one small, non-growing metastasis was imaged aside from the seven lesions studied. If other metastases were present, they should have grown to visible size during 10 years of follow-up. Therefore, the exponential model provided the best estimate of the number of lung metastases. Our results emphasise the importance of having correct tumour growth information to correctly estimate the number and size distribution of metastases.
We evaluated the Gompertzian growth model in the present study because it is the most commonly adopted model in clinical studies [7,8]; however, our approach is the-oretically applicable to all growth models.
Conclusion
Analysis of the regression of tumour growth rate with its volume can be used to esti-mate the non-exponential growth model parameters of metastatic tumours. These re-sults are valuable for the optimisation of targeted radionuclide therapy based on the estimated number and size distribution of metastases in individual patients.
Appendix A
Relation between tumour growth rate and tumour volume From Equation 5 (Gompertzian model):
ln V
V0 ¼
SGR0
λ 1eλt
ð7Þ
and
1 V
dV dt ¼
SGR0
λ þλÞeλt
Replacing the left side of the above equation with Equation 2 gives:
SGR¼SGR0e−λt
or
e−λt¼ SGR SGR0
If exp (−λt) in Equation 7 is replaced by the above equation, then:
ln V
V0 ¼
SGR0
λ 1
SGR SGR0
Readjustment of the above equation gives Equation 6 in the article:
SGR¼SGR0−λln Vð =V0Þ
where SGR is the value of tumour SGR at each period of observation (calculated using Equation 3 in the article) and V is the geometric mean of tumour volume at that period of observation.
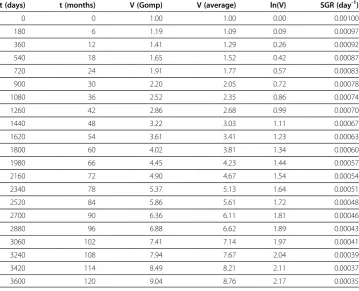
λ= 0.0003 day-1. Tumour volume is measured every six months (180 days). The last two columns in Table 2 show the calculated logarithm of the geometric mean of tumour volume and the tumour SGR at each consecutive pair of measurements, respectively:
Figure 4 shows variation of SGR with the logarithm of tumour volume according to the Table 2. The estimated SGR0andλ values are equal to the assumptions (i.e., 0.001 day-1and 0.0003 day-1, respectively).
Table 2 Variation of specific growth rate (SGR) with logarithm of tumour volume
t (days) t (months) V (Gomp) V (average) ln(V) SGR (day-1)
0 0 1.00 1.00 0.00 0.00100
180 6 1.19 1.09 0.09 0.00097
360 12 1.41 1.29 0.26 0.00092
540 18 1.65 1.52 0.42 0.00087
720 24 1.91 1.77 0.57 0.00083
900 30 2.20 2.05 0.72 0.00078
1080 36 2.52 2.35 0.86 0.00074
1260 42 2.86 2.68 0.99 0.00070
1440 48 3.22 3.03 1.11 0.00067
1620 54 3.61 3.41 1.23 0.00063
1800 60 4.02 3.81 1.34 0.00060
1980 66 4.45 4.23 1.44 0.00057
2160 72 4.90 4.67 1.54 0.00054
2340 78 5.37 5.13 1.64 0.00051
2520 84 5.86 5.61 1.72 0.00048
2700 90 6.36 6.11 1.81 0.00046
2880 96 6.88 6.62 1.89 0.00043
3060 102 7.41 7.14 1.97 0.00041
3240 108 7.94 7.67 2.04 0.00039
3420 114 8.49 8.21 2.11 0.00037
3600 120 9.04 8.76 2.17 0.00035
y = -0.0003x + 0.001 R² = 1
0.0E+00 2.0E-04 4.0E-04 6.0E-04 8.0E-04 1.0E-03 1.2E-03
0.0 0.5 1.0 1.5 2.0 2.5
SGR (1/d)
ln(V)
Figure 4Variation of specific growth rate (SGR) with logarithm of tumour volume.
Mehraraet al. Theoretical Biology and Medical Modelling2013,10:31 Page 11 of 12
Competing interests
The authors declare that they have no competing interests.
Authors’contributions
EM and PB initiated the study. EM developed the model and analyzed the data. EM, EFA, PB and RH drafted the manuscript. RH, VJ and LK participated in selecting images and delineating tumorus. All authors read and approved the final manuscript.
Acknowledgments
We dedicate this article to our late colleague and friend Professor Håkan Ahlman, who contributed considerably to this work.
This study was supported by grants from the Swedish Cancer Society, the Swedish Research Council, and the King Gustav V Jubilee Clinic Cancer Research Foundation, Göteborg, Sweden.
Author details
1
Department of Radiation Physics, University of Gothenburg, Sahlgrenska University Hospital, SE - 413 45 Göteborg Sweden.2Department of Surgery, University of Gothenburg, Göteborg, Sweden.3Department of Oncology, University of Gothenburg, Göteborg, Sweden.4Department of Medical physics and Biomedical Engineering, Sahlgrenska University Hospital, Göteborg, Sweden.
Received: 5 March 2013 Accepted: 22 April 2013 Published: 9 May 2013
References
1. Bassukas ID, Hofmockel G, Tsatalpas P, Eberle V, Maurer-Schultze B:Prognostic relevance of the intrinsic growth deceleration of the first passage xenografts of human renal cell carcinomas.Cancer1996,78:2170–2172. 2. Norton L:A Gompertzian model of human breast cancer growth.Cancer Res1988,48:7067–7071. 3. Withers HR, Lee SP:Modeling growth kinetics and statistical distribution of oligometastases.Semin Radiat
Oncol2006,16:111–119.
4. Iwata K, Kawasaki K, Shigesada N:A dynamical model for the growth and size distribution of multiple metastatic tumors.J Theor Biol2000,203:177–186.
5. Mehrara E, Forssell-Aronsson E, Ahlman H, Bernhardt P:Specific growth rate versus doubling time for quantitative characterization of tumor growth rate.Cancer Res2007,67:3970–3975.
6. Mehrara E, Forssell-Aronsson E, Ahlman H, Bernhardt P:Quantitative analysis of tumor growth rate and changes in tumor marker level: specific growth rate versus doubling time.Acta Oncol2009,48:591–597.
7. Afenya EK, Calderon CP:Diverse ideas on the growth kinetics of disseminated cancer cells.Bull Math Biol2000, 62:527–542.
8. Bajzer Z:Gompertzian growth as a self-similar and allometric process.Growth Dev Aging1999,63:3–11. 9. Hart D, Shochat E, Agur Z:The growth law of primary breast cancer as inferred from mammography
screening trials data.Br J Cancer1998,78:382–387.
10. Haeno H, Gonen M, Davis MB, Herman JM, Iacobuzio-Donahue CA, Michor F:Computational modeling of pancreatic cancer reveals kinetics of metastasis suggesting optimum treatment strategies.Cell2012,148:362–375. 11. Goey SH, Verweij J, Stoter G:Immunotherapy of metastatic renal cell cancer.Ann Oncol1996,7:887–900. 12. Nakamura M, Roser F, Michel J, Jacobs C, Samii M:The natural history of incidental meningiomas.Neurosurgery
2003,53:62–70. discussion 70–61.
13. Ozono S, Miyao N, Igarashi T, Marumo K, Nakazawa H, Fukuda M, Tsushima T, Tokuda N, Kawamura J, Murai M: Tumor doubling time of renal cell carcinoma measured by CT: collaboration of Japanese society of renal cancer.Jpn J Clin Oncol2004,34:82–85.
14. Akanuma A:Parameter analysis of Gompertzian function growth model in clinical tumors.Eur J Cancer1978, 14:681–688.
doi:10.1186/1742-4682-10-31
Cite this article as:Mehraraet al.:A new method to estimate parameters of the growth model for metastatic tumours.Theoretical Biology and Medical Modelling201310:31.
Submit your next manuscript to BioMed Central and take full advantage of:
• Convenient online submission
• Thorough peer review
• No space constraints or color figure charges
• Immediate publication on acceptance
• Inclusion in PubMed, CAS, Scopus and Google Scholar
• Research which is freely available for redistribution