_________
*Corresponding author’s e-mail: rodeano@ums.edu.my
Earthquake Vulnerability Assessment (EVAs):
A study of Physical Vulnerability Assessment in
Ranau area, Sabah, Malaysia
Rodeano Roslee1,2,*, Ahmad Khairut Termizi1,2,3, Elystarina Indan2 and Felix Tongkul1,2
1Natural Disaster Research Centre (NDCR), Universiti Malaysia Sabah (UMS), UMS Road, 88400 Kota
Kinabalu, Sabah.
2Faculty of Science & Natural Resources (FSSA), Universiti Malaysia Sabah, Jalan UMS, 88400 Kota
Kinabalu, Sabah, Malaysia.
3Minerals and Geoscience Department of Malaysia (JMG-Malaysia), Jalan Penampang, 88999 Kota Kinabalu,
Sabah, Malaysia
Earthquakes are one of the most common and widely distributed natural risks to life and property. There is a need to identify the possible risk by assessing the vulnerability of the research area. The topic on Earthquake Vulnerability Assessment (EVAs) in Malaysia is very new and received little attention from geoscientists and engineers. Taking the 5.0 Ranau Earthquake 2015 as research study, the research’s main objective was to identify the physical vulnerability on that area. The framework was formulated semiquantitively through the development of database for risk elements (properties) based on the information from secondary data, literature review and fieldwork. The characteristics that were looking for during fieldwork are the building structures, internal materials, property damage, infrastructural facilities and stabilization actions. Each considered parameter in the vulnerability parameter is allocated with certain index value ranges from 0 (0% damage/victims/period),0.25(1-25% damage/victim/period), 0.50 (26-50% damage/victims/periods), 0.75 (damage/victims/period), and 1.0 (75-100% damage/victim/periods). The value obtained from field work are calculated by using formula and are classified into five classes of vulnerability namely class 1 (<0.20): Very Low Vulnerability: Class 2 (0.21-0.40): Low Vulnerability; Class 3 (0.41-0.60); Medium Vulnerability; Class 4 (0.61-0.80): High Vulnerability; and Class 5 (>0.81): Very High Vulnerability only. Then a Physical Vulnerability Map is generated by using ArcGis software. Results from this study indicate that a further study is needed to the area of high to very high vulnerability only. This approach is suitable as a guideline for preliminary development in the research area and potentially to be extended with different background and environments.
Keywords: Earthquake Vulnerability Assessment (EVAs): Physical Vulnerability Assessment, Ranau, Sabah
I. INTRODUCTION
The aim of this paper is to investigate the physical vulnerability of the research area which
The earthquake has caused a lot of negative implications such as it triggered another natural hazard (rockfall, mudflow and landslides) to occur, as well as building destructions, loss of life, water shortage and disturbance in daily life. It took months and some needs years to recover, although there are a few aftershocks recorded even after a few years of the Ranau Earthquake 2015. This means that this area is exposed to many dangers in the future. It is likely to be under serious threat of the implication of the seismic activities. Hence, the earthquake vulnerability assessment is needed so that the hazard can be managed properly in the future to minimize the negative impacts.
The term ‘vulnerare’ comes from the Latin word which means ‘to wound’ or ‘to be susceptible’. It is also defined as ‘exposed to damage and danger; not protected from danger (Oxford Dictionary 1995). Varnes 1989 defined vulnerability as the degree of loss (damage) of an element or a few elements which is unprotected/exposed to natural hazard.
In certain magnitudes. Vulnerability can also be defined as the degree of loss to a given element at risk, or set of such elements, resulting from an earthquake of a given magnitudes or intensity, which is usually expressed on a scale
the increase number of tourists which came all over the world, the local economy slowly growing. More buildings are built to support the increase number of communities in this area.
As mentioned before the location of the study area is determined by a few aspects which are gathered through finding literature reviews, secondary data and field observation. There are for main locations have been determined. Among the four main location chosen sixty readings have been recorded during field observation (Figure 2 to 5).
Figure 1: The location of the research area in Sabah shown in the white box (Source: Google Map)
Figure 3: Location 2 is in Kg. Kibbas-Mihomboyon, Kundasang
Figure 4: Kg. Location 3 in Lobou-Lobou, Kundasang
Figure 5: Location 4 in Kg. Mesilau, Kundasang
III. MATERIALS AND METHODS
This research focuses on the Physical Vulnerability Assessmentin Ranau Area, Sabah, Malaysia. Figure 6 shows the chart flow on how the Physical Vulnerability Assessment is conducted.
Figure 6. Physical Vulnerability Assessment
The data fields are then re-analyzed based on Standardization Method introduced by Voogd (1983) which aim to rescale the data field by Linear Transformation Numerical (LTN) approach which starting from 0.00 to 1.00 by applying the following equation:
Standardization Method = Raw data/ Raw data Maximum
The physical vulnerability index will be calculated according to this formula;
Physical Vulnerability (Vp) =
(5 𝑥 𝑎𝑓)+(4 𝑥 𝑏𝑓)+(3 𝑥 𝑐𝑓)+(2 𝑥 𝑑𝑓)+(1𝑥 𝑒𝑓) 15
Where,
af: building structure ; bf: internal materials
cf: property damage; df: infrastructural facilities; and ef: stabilization action.
Then the value of will be classified into five classes of vulnerabilities, namely:
a) Class 1 (<0.20) (very low vulnerability); b) Class 2(0.21-0.40) (low vulnerability); c) Class 3(0.41-0.60)(moderate
vulnerability);
d) Class 4(0.61-0.80) (high vulnerability) Class 5(>0.81)(very high vulnerability
some building structure on the area. Due to the seismic activities, there are frequent natural hazard such as rock falls and landslides. This caused the vulnerability is very high in this area. Besides, the recent Ranau Earthquake 2015 gave so many negative impacts towards the communities (Figure 7 to 12).
There are 60 locations have been identified. This location is chosen based on the availability of the designed parameter, literature reviews, and satellite image study and field observation.
Figure 8: The damaged can be seen clearly and it isn’t properly repaired
Figure 9: Damage from the recent 2015 Ranau earthquake sill can be observed till today in Kg.
Kundsang Lama
Figure 10: A house located in Kg. Lobou-Lobou Kundasang destroyed by the 2015 earthquake
Figure 11: Damaged house in Kg. Mesilau due the seismic activities in the area
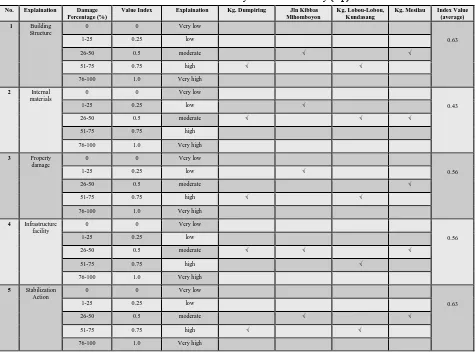
The results from field observation is shown in Table 1. Based on Table 1, the index value of building structure, internal materials, property damage, infrastructure facilities and stabilization actions are 0.63, 0.43, 0.56, 0.56 and 0.63 respectively. The physical vulnerability is calculated by using formula below,
Physical Vulnerability (Vp)
= (5 𝑥 𝑎𝑓)+(4 𝑥 𝑏𝑓)+(3 𝑥 𝑐𝑓)+(2 𝑥 𝑑𝑓)+(1𝑥 𝑒𝑓)
15
=(5 𝑥 0.63)+(4 𝑥 0.43)+(3 𝑥 0.56)+(2 𝑥 0.56)+(1𝑥 0.63)
15
=0.55 (moderate vulnerability)
The index value for each of the physical vulnerability are based on the four chosen location around the research area through
fieldwork observation. The index value for physical vulnerability is 0.55 which is classified as moderate vulnerability. This is showed that the damage in the research area is in moderate level.
Physical Vulnerability in this study involves the assessment of damage or destruction of building structures, internal equipment, damage to property, infrastructure and stabilization measure. The proportion of Physical Vulnerability is depending on the nature of the risk element is exposed, level of danger, building structure, building materials used, the basic structures of the system, the size and the shape of the elements of risk and
long-26-50 0.5 moderate √ √ √
51-75 0.75 high
76-100 1.0 Very high
3 Property damage
0 0 Very low
0.56
1-25 0.25 low √
26-50 0.5 moderate √
51-75 0.75 high √ √
76-100 1.0 Very high
4 Infrastructure facility
0 0 Very low
0.56
1-25 0.25 low
26-50 0.5 moderate √ √ √
51-75 0.75 high √
76-100 1.0 Very high
5 Stabilization Action
0 0 Very low
0.63
1-25 0.25 low
26-50 0.5 moderate √ √
51-75 0.75 high √ √
life used (Figure 13 to 17). Similar damage assessment Physical Vulnerability can be estimated using vulnerability coefficient varying between 0 ( no damage) to 1 ( total destruction).For this area the Physical Vulnerability indicated that 60 % moderate , 30 % as High, 8 % low and 2 % very low(Figure 18). Physical Vulnerability at a ‘high’ to ‘very high’ degree cab leave an impact on individual and society. If the vulnerability level received only involves individuals, the level of the vulnerability is not a dangerous hazard. If it the vulnerability level on the big stage and the rate of occurrence happens too often and may be at the expense of life and property. The level of vulnerability will be seen as a threat of a major disaster.
Measurement taken to reduce the level of earthquake vulnerability in the research area is to be more complex and difficult for many parties involved who have to deal with. Although the effects of hazard in the study area can be overcome, the impact of large vulnerability may exist when exposure parameter vulnerability risks continue to rise and adaptation capacity continue to decline.
Figure 13: Building Structure Vulnerability Index
Figure 14: Internal Materials Vulnerability Index
Figure 16: Infrastructural facilities Vulnerability Index
Figure 17: Stabilization Actions Vulnerability Index
Figure 18: Physical Vulnerability Map
1. The ideal index value suggestion for physical vulnerability are as follows;
- Building structure : 0.63
- Internal materials : 0.43
- Property damage : 0.56
- Infrastructure facility : 0.56
- Stabilization action : 0.63
2. The Physical Vulnerability of the research area is 0.55 which indicates the area has moderate level of vulnerability.
3. Based on the generated map, for this area the Physical Vulnerability indicated that 60 % moderate, 30 % as High, 8 % low and 2 % very low.
4. Physical vulnerability at a ‘high’ to ‘very high’ degree can affect the daily activities of the population.
5. Further study is needed especially form moderate to high vulnerability area.
[1] Adger, W. N. (2006). Vulnerability. Global Environmental Change, 16, 268-281.
[2] Roslee, R., Jamaludin, T. A. & Simon N. (2017). Landslide Vulnerability Assessment (LVAs): A Case Study from Kota Kinabalu, Sabah,
Malaysia. Indonesian Journal on Geoscience, 4(1), 45-59.
[3] Roslee, R., Jamaludin, T. A. & Talip, M. A. (2011). Aplikasi GIS dalam Pentaksiran RisikoGelinciran Tanah (LRA): Kajian Kes bagi kawasan sekitar Bandaraya Kota Kinabalu, Sabah Malaysia. Bulletin of the Geological Society of Malaysia, 57, 69-83.
[4] Roslee, R. & Jamaluddin, T. A. (2012).
Kemudahterancaman Bencana Gelinciran Tanah (LHV): Sorotan Literature dan Cadangan Pendekatan Baru untuk Pengurusan Risiko Gelinciran Tanah di Malaysia. Bulletin of the Geological Society of Malaysia, 58, 75-88.
[5] Roslee, R., Jamaluddin. T. A. & Talip. M. A. (2012). Integration of GIS using GEOSTA-tisticalInterpolation Techniques (kriging)
(GEOSTAINT-K) in determine model for landslide susceptibility analysis (LSA) at Kota Kinabalu, Sabah, Malaysia. Journal of Geography and Geology, 4(1), 18-32.
[6] Tongkul, F. (2015). Status of Mount Kinabalu Water Catchments after June 2015
RanauEarthquake – Lesson Learned.
International Conference On the Heart of Borneo, Kota Kinabalu. 11–12 November 2015.
[7] Tongkul, F. (2015). Status of Mount Kinabalu Water Catchments after June 2015 Ranau Earthquake–Lesson Learned. International Conference On the Heart of Borneo, Kota Kinabalu. 11–12 November 2015.
[8] Varnes D. J. & IAEG Commissions on Landslide. (1984). Landslide hazard zonation–a review of
principles and practices. Paris: UNESCO. DOI: 10.1007/BF02594758.