ABSTRACT
This study is conducted to better understand budgeting practice in Singapore which may be critical for increasing competitiveness and productivity for firms, and increasing value-add contribution for accountants. We obtained 356 valid responses from an online survey administered to members of a professional accounting organization. We found that most firms prepare budget and many (about 30%) incorporate significant strategy assumptions in budgets. The time spend on budgeting (10%-20%) is lower than what was reported in US studies, and more time is spent in preparing than using the budget. Budgeting problems (e.g. ratcheting and sandbagging behaviour) are well recognized, but firms preparing budgets with business plans generally deem pros for budgeting exceeding cons. Firms with annual revenue below $1m prepare budget primarily for forecasting cash flows; larger firms focus more on guiding and coordinating business activities, with increasing importance on variance analysis as firm size increases. For firms that prepare budgets with business plans, employee compensation based on budget performance is not as prevalent as expected. About 70% of the firms set budget targets to monitor strategy execution, about 50% set budget target for employee performance evaluation, and about 43% compensate by budget performance. The implications of these findings are discussed.
Keywords: budgeting process; budget gaming; strategic control; performance measure; time cost of budgeting; use of budget
BUDGETING PRACTICE
IN SINGAPORE – AN EXPLORATORY
STUDY USING A SURVEY
Tan Boon Seng1
Low Kin Yew2
1Institute of Singapore Chartered Accountants, Singapore 2nanyang Business School,
nanyang Technological University, Singapore
ARTICLE InFO Article History:
Asia-Pacific Management Accounting Journal, Volume 12 Issue 1
INTRODUCTION
Budgeting is a ubiquitous activity in business that accountants participate – supporting business unit heads in its preparation, assisting controllers and executives in its review, and even preparing and developing the operating budget itself. Businesses generally prepare two types of budgets – the capital budget and the operating budget. But for our purpose, budgeting refers to the preparation of recurring operating budgets. Capital budgeting, also known as investment appraisal, is non-recurring and uses a different set of tools.
There are two related objectives for businesses to prepare operating budgets. First, budgeting is an integral part of a business strategy where the budget assists managers to allocate resources, monitor progress, and provide feedback on how well the strategy is working (i.e., for strategic control and coordination). Second, budgets are used as performance targets to motivate behaviours supporting the strategy (i.e., for performance measurement). These objectives are related but distinct, and have different implications for the practice and research on budgeting.
A literature review on the practice of budgeting by neely, Sutcliff and Heyns (2001) suggests that traditional budgeting is broken: Budgeting is found to take up a substantial amount of management time in preparation, revision, negotiation, and review. Yet, managers complain that budgets are negotiated outcomes that are rarely strategically focused. They appear to be based on implicit but invalid assumptions, reinforce departmental barriers rather than encourage collaboration, and misallocate resources based on positional power rather than strategic needs. Budgeting is perceived by managers to focus on cost reduction, ignore value creation and encourage gaming. Budgeting is found to be simply too inflexible: Planning assumptions are often outdated when budgets are finally completed. However, budgets are seldom revised in response to competitive changes and hence, constrain effective strategic responses.
79
process; Beyond Budget (Hope & Fraser 2003) abandons the traditional budgeting process and replaces it with concepts such as rolling forecast, relative performance measure and decentralization of decision control.
Anecdotally, there are wide variations in the effectiveness and practice of budgeting approaches. These variations indicate opportunities for adoption of best practices that enable accountants to value-add to their firms. Paradoxically, using the budget for performance measurement intensifies budget gaming which will ultimately reduce the effectiveness of budgeting for strategic coordination and control (Jensen, 2003). How firms handle the trade-off have a strong impact on their competitiveness. However, current budgeting practice in Singapore, which may well be the key to help firms unlock greater competitiveness and productivity, is largely unknown. This exploratory study analyses four aspects of budgeting practice: (a) how are budget prepared and used, (b) time spend, (c) usefulness of budgeting in general and for strategic planning and performance measure, and (d) challenges.
DATA: COLLECTION AND PROFILE
We administered an online survey to members of the Institute of Singapore Chartered Accountants from July to August 2015. We obtained 356 responses after eliminating three duplicate responses.
We collected information of the respondent’s profile that may enables meaningful subgroup levels analysis. The information includes firm size (by revenue class), firm types (ownership and participation in equity market), firm structure (diversification and primary activity) and the respondents’ roles in budgeting.
80
Asia-Pacific Management Accounting Journal, Volume 12 Issue 1
Respondent Profile
The mix of firms by size (measured by category of annual revenue) is diverse. About a quarter (26.4%) are very large firm with over $1b annual sales, another quarter (25.0%) are large firms with annual sales of $100m – $1b, and the remaining half (48.6%) are Small and Medium Enterprise (SME)1 with annual sales below $100m. The pie chart below summarizes the size distribution with detailed breakdown of the SME:
The res
p
more th
a
be a mul
t
Multinat Governm Local Non-pro SGX Lis Listed O
The bu
d
diversifi
c
goods.).
possible
– genera
l
function
a
2 This classi
pondents wo
a
n 100% (n=
tinational en
Own tional ment Linked ofit sted Overseasd
geting pr
o
cation and
b
Generally,
d
– but rare –
l
ly with mor
a
l departme
n
ification follows
Figure 1: D
o
rk in a wi
d
=356) b
eca
u
n
terprise an
d
Tab
nership and
o
cess may
by the natur
e
d
iversified f
i
case of co
m
re than 70%
n
ts. The distr
s from the strateg
$1m to $ Firm
Distribution
d
e variety o
f
use afirm
can
d
listed in Si
n
ble 1: Respo
Equity Listin
be influen
e
of the pro
d
i
rms are org
mbining bot
h
of the reve
n
ribution of t
h
gic management
$10m to $100m, 19 $10m, 16.0%
Below $1m, 1 m Size (Ann
of Firm Siz
f
firms. The
n
have mult
i
n
gapore). T
h
ondents by
ng
ced by fir
d
uct (wheth
e
anized as pr
h
in a matrix
n
ue arising fr
h
e responde
n
t literature, speci
A $100m o 9.7% 12.9% nual Reven
ze of Respo
tabulated
p
i
ple attribut
e
h
e distributi
o
y Firm Type
rm structur
e
e
r the firm
p
roduct or ge
o
structure. F
rom a single
n
ts’ organis
a
ifically Rumelt ( m to $1b, 25.0%
ue) N= 356
ondents
p
ercentages
e
s (e.g.,an or
o
n is tabulat
e
N 149 31 130 18 48 26
e
arising
f
p
rovides ser
v
o
graphical
d
irms with l
o
business
2–
a
tions (n=3
5
(1974). %
below add u
r
ganisation
m
ed as follow
% 41.9% 8.7% 36.5% 5.1% 13.5% 7.3%
f
rom the
f
v
ices or pro
d
divisions wit
o
w diversifi
c
are organiz
e
5
6) is as fol
l
4
u
p to
m
ight
s:
f
irm’s
d
uces
th the
cation
e
d by
l
ows:
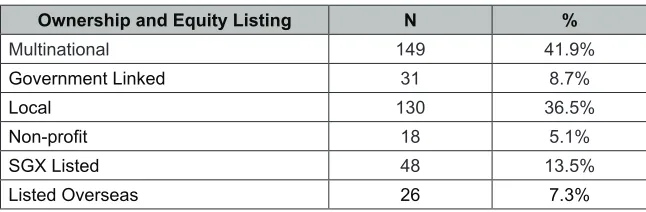
Figure 1: Distribution of Firm Size of RespondentsThe respondents work in a wide variety of firms. The tabulated percentages below add up to more than 100% (n=356) because a firm can have multiple attributes (e.g., an organisation might be a multinational enterprise and listed in Singapore). The distribution is tabulated as follows:
1 SPRInG defines SME in Singapore based on annual sales (below $100m) or employee number (below 200). The definition is used to access eligibility for SME grants. See http://goo.gl/xzAzQn.
81
Table 1: Respondents by Firm Type
Ownership and Equity Listing N %
Multinational 149 41.9%
Government Linked 31 8.7%
Local 130 36.5%
Non-profit 18 5.1%
SGX Listed 48 13.5%
Listed Overseas 26 7.3%
The budgeting process may be influenced by firm structure arising from the firm’s diversification and by the nature of the product (whether the firm provides services or produces goods.). Generally, diversified firms are organized as product or geographical divisions with the possible – but rare – case of combining both in a matrix structure. Firms with low diversification – generally with more than 70% of the revenue arising from a single business2 – are organized by functional departments. The distribution of the respondents’ organisations (n=356) is as follows:
Table 2: Respondents by Firm Structure
Firm Structure N %
Diversified Product Divisions 104 29.2%
Diversified Geographic Divisions 56 15.7%
Primarily Manufacturing 41 11.5%
Primarily Service 155 43.5%
HOW ARE BUDGET PREPARED?
Asia-Pacific Management Accounting Journal, Volume 12 Issue 1
(63.7% vs. 29.5%). This is consistent with the view that the preparation cost for incremental budgets is lower than zero based budgets. Overall, more budgets are prepared based on a business plan than without (52.5% vs. 40.7%). The summarized data are as follows:
Diversifi Diversifi Primarily Primarily
HOW AR
The maj
o
work do
budgets
t
budget b
adjustin
g
plan as th
zero-b
ase
cost for
prepared
follows:
ed Product D ed Geograph y Manufacturi y Service
RE BUDGE
o
rity offirm
s
not prepar
e
t
hrough ne
g
b
ase on thei
g
from last
y
h
e basis of
p
e
d budgetin
g
incrementa
l
based on a
Fig Table Firm Stru Divisions hic Divisions ing
ET PREPA
s
prepare o
p
e
budgets.
A
gotiation and
i
r business
y
ear’s budg
e
p
reparation.
g
(63.7% v
s
l
budgets i
s
business p
l
gure 2: Dist H
e 2: Respon
ucture
RED?
p
erating bu
d
A
bout40.7%
d
without bu
plans, cons
e
tsand 29.5%
There is a
s
. 29.5%).
T
s
lower th
a
lan than with
ribution of Incremental Last Year Busines Plan, 23.0 Zero Based Business Plan, 29.5% How is the
dents by Fi
dgets - only
% of firmspr
u
siness plans
isting of 23
% preparin
g
clear prefer
e
This is consi
a
n zero bas
e
h
out(52.5%
the Basis o Increm Last Negotia l from r by ss 0% by s % Budget Pre N=356 irm Structu
6.7% of th
e
repares bud
g
s
. About 52.
3
.0% prepar
g
zero base
d
e
nce towar
d
istent with t
e
d budgets.
vs. 40.7%).
of Budget P mental from Year by ation, 40.7% epared? re N 104 56 41 155
e
firmswher
e
g
ets by adju
.5% of the
f
ring increm
e
d
budgets u
s
d
sincrement
a
the view tha
Overall, m
. The summ
reparation Does no Budg % 29.2% 15.7% 11.5% 43.5%
e
the respo
n
u
sting last y
f
irms prepar
e
ntal budge
t
s
ing the bu
s
a
l budgeting
a
t the prepar
more budget
marized data
a
ot Prepare get, 6.7%
5
ndents
y
ear’s
r
e the
t
s by
siness
over
r
ation
s are
a
re as
Figure 2: Distribution of the Basis of Budget Preparation
We examine if subgroup characteristics change the way budgets are prepared. The results are summarized in the following tables:
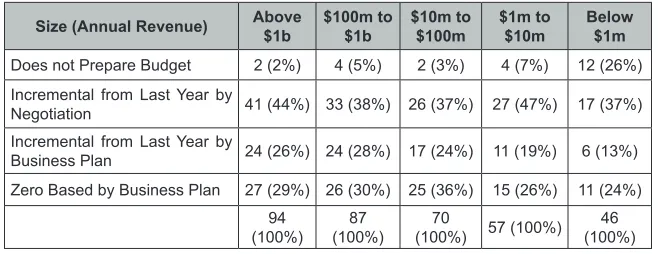
Table 3: Preparation of Budget – Analysed by Size
Size (Annual Revenue) Above $1b $100m to $1b $10m to $100m $1m to $10m Below $1m
Does not Prepare Budget 2 (2%) 4 (5%) 2 (3%) 4 (7%) 12 (26%) Incremental from Last Year by
Negotiation 41 (44%) 33 (38%) 26 (37%) 27 (47%) 17 (37%)
Incremental from Last Year by
Business Plan 24 (26%) 24 (28%) 17 (24%) 11 (19%) 6 (13%)
Zero Based by Business Plan 27 (29%) 26 (30%) 25 (36%) 15 (26%) 11 (24%) 94
83
While only 6.7% of all firms do not prepare operating budget, this group is heavily weighted towards small firms with annual revenue below $1m (26% vs. 2% to 7% in the other groups). For firms not preparing any budget, the differences between small firms and every other group are statistically significant3.
For firms that prepare budgets, there is no clear indication that size is the cause for any difference in budgeting approach. As such, the sub-group analysis does not provide new insight as compared to aggregate analysis for firms that prepare budgets.
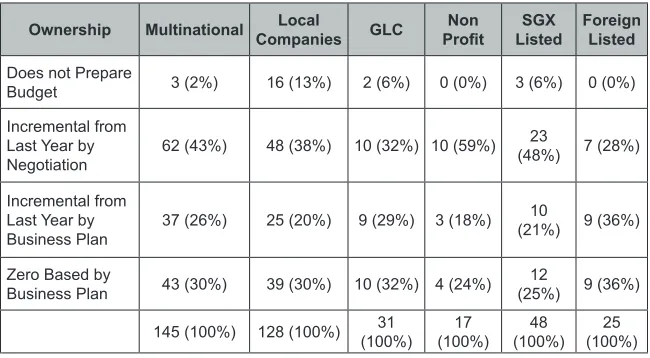
Table 4: Preparation of Budget – Analysed by Ownership
Ownership Multinational CompaniesLocal GLC ProfitNon ListedSGX Foreign Listed
Does not Prepare
Budget 3 (2%) 16 (13%) 2 (6%) 0 (0%) 3 (6%) 0 (0%)
Incremental from Last Year by
Negotiation 62 (43%) 48 (38%) 10 (32%) 10 (59%) 23
(48%) 7 (28%)
Incremental from Last Year by
Business Plan 37 (26%) 25 (20%) 9 (29%) 3 (18%) 10
(21%) 9 (36%)
Zero Based by
Business Plan 43 (30%) 39 (30%) 10 (32%) 4 (24%) (25%)12 9 (36%)
145 (100%) 128 (100%) (100%)31 (100%)17 (100%)48 (100%)25
Comparing multinationals with local companies, local companies are more likely not to prepare a budget (13% vs. 2%; statistically significant). Multinationals are more likely to use incremental budget and equally likely to use the zero-based budget as compared to local companies. As seen from the comparisons of GLC with multinational and local companies which are privately held, the introduction of government shareholding appears to increase the use of business plan in budgeting. The non-profit status of the firm has an opposite effect whereby there is a decreased use of business plan in budgeting, and an increased practice of incremental budgeting by negotiation. Interestingly, when a company is listed in Singapore instead 3 We will use the 5% level throughout this report; see http://www.jerrydallal.com/LHSP/p05.htm
Asia-Pacific Management Accounting Journal, Volume 12 Issue 1
of overseas, it appears to increase the probability of using incremental budgeting and reduce the link of the business plan with the budget.
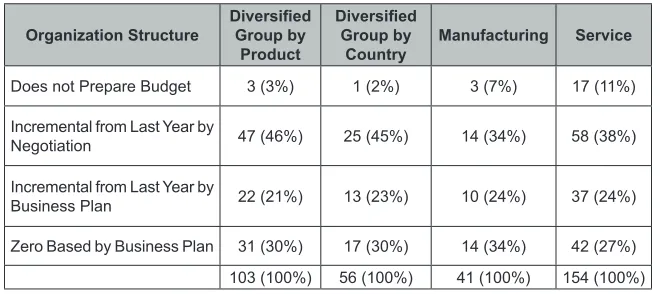
Table 5: Preparation of Budget – Analysed by Firm Structure
Organization Structure Diversified Group by Product
Diversified Group by
Country Manufacturing Service
Does not Prepare Budget 3 (3%) 1 (2%) 3 (7%) 17 (11%)
Incremental from Last Year by
Negotiation 47 (46%) 25 (45%) 14 (34%) 58 (38%)
Incremental from Last Year by
Business Plan 22 (21%) 13 (23%) 10 (24%) 37 (24%)
Zero Based by Business Plan 31 (30%) 17 (30%) 14 (34%) 42 (27%) 103 (100%) 56 (100%) 41 (100%) 154 (100%)
Table 5 shows that diversification affects budgeting in aggregate. The diversification effects are not seen at the detailed level of product or geographical diversification. It also does not extend to the detailed level of whether und iversified firms supply products or services. Diversified firms are less likely not to prepare a budget (2%-3% vs. 7%-11%) and are more likely to use incremental budget by negotiation (45%-46% vs. 34%-38%). There is little difference in the use of business plan for budgeting between the groups.
85
For firms that prepared budget, we examined how the first draft is established by the following three choices:
1. Top-Down Target Setting: Top management sets certain targets and allocates these targets to individual business units to develop their draft budgets
2. Top-Down Budget Setting: Top management prepares the draft budgets and conveys them to the individual business units for their inputs
3. Bottom-Up Approach: Individual business units prepare the draft budgets that are aggregated up the hierarchy
The budget numbers are anchored by the first draft, hence the one who prepares the first draft influences whether the final budget is closer to the ambition of the management or feasibility of the business unit. This outcome is explained by the concept of framing and anchoring in negotiation theory (Bazerman & neale, 1993). For our sample, some firms do not prepare budget (n=24) and others skip this question by choice (n=12), resulting in 320 usable responses. The breakdown of the budgeting approach is as follows:
•
T
th
•
B
ag
The
bud
g
influenc
e
the busi
n
negotiati
(n=24)
a
breakdo
w
The fig
u
approac
h
15.0%) i
than sett
summariz
Top-Down B
h
em to the i
n
Bottom-Up
g
gregated u
p
g
et number
s
e
s whether t
h
n
ess unit.
T
on theory (
B
a
nd others sk
w
n of the bu
d
ure above s
h
h
(57.8% vs
n the top-do
t
ing targets.
z
ed in the fo
Budget Sett
n
dividual bu
Approach:
p
the hierar
c
s
are anchor
h
e final bu
d
T
his outcom
B
azerman &
kip this qu
e
dgeting app
r
Figure 3
hows that th
. 42.2%).
T
o
wn approa
c
We exami
n
o
llowing tab
l
A
A
ting:
Top
m
siness units
Individual
chy
red by the f
i
dget is close
r
me is expla
i
neale, 199
3
e
stion by ch
o
r
oach is as fo
3: Distributi
he top-down
T
arget settin
g
c
h. This resu
n
e if subgr
o
l
es (n=320)
Bu Bottom Up Approach, 42.2%
Approach to
management
for their in
p
business u
n
i
rst draft, h
e
r to the amb
i
i
ned by the
3
). For our s
a
o
ice (n=12)
fo
llows:
on of Budg
n
approach
g
is more
c
ult is expec
t
o
up charact
e
:
Top Dow Setting Top Down udget Setting, 15.0% % o Budgetingprepares th
e
p
uts
n
its prepar
e
ence the one
ition of the
m
concept of
a
mple, som
e
), resulting i
eting Appro
is more pr
c
ommon th
a
ted as setting
e
ristics has
wn Target g, 42.8%
g, N=320
e
draft bud
g
e
the draft
e
who prepar
manageme
n
f
framing
a
e
firms do n
o
n 320 usab
l
oach
r
evalent than
a
n budget s
e
g
budgetsre
q
any impact.
gets and con
budgets th
a
res the first
n
t or feasibil
i
a
nd anchori
n
o
t prepare bu
l
e responses
n
the bottom
e
tting (42.8%
q
uire more
e
. The resul
t
8
nveys
a
t are
draft
ity of
ng in
u
dget
. The
Asia-Pacific Management Accounting Journal, Volume 12 Issue 1
The figure above shows that the top-down approach is more prevalent than the bottom up approach (57.8% vs. 42.2%). Target setting is more common than budget setting (42.8% vs. 15.0%) in the top-down approach. This result is expected as setting budgets require more effort than setting targets. We examine if subgroup characteristics has any impact. The results are summarized in the following tables (n=320):
Table 6: Distribution of Budgeting Approach by Firm Size
Size (Annual Revenue) Above $1b $100m to $1b $10m to $100m $1m to $10m Below $1m Top Down Target Setting 36 (43%) 39 (48%) 26 (38%) 18 (35%) 17 (52%) Top Down Budget Setting 7 (8%) 8 (10%) 13 (19%) 10 (19%) 9 (27%) Bottom Up Approach 41 (49%) 34 (42%) 29 (43%) 24 (46%) 7 (21%) 84 (100%) 81 (100%) 68 (100%) 52 (100%) 33 (100%)
Budgeting in companies below $1m annual turnover is distinct from larger companies. About 79% of companies below $1m annual turnover adopt the top-down approach compared to around 50% in larger companies. The results are consistent with the view that management in small companies is more involved in the budgeting process because it is feasible to do so. This hypothesis is supported by the observation that top-down budget setting is observed to decrease with company size in the sample.
Table 7: Distribution of Budgeting Approach by Ownership
Ownership Multinational Companies GLCLocal ProfitNon ListedSGX Foreign Listed Top Down Target
Setting 59 (42%) 55 (50%) 7 (25%) 5 (31%) 14 (33%) 12 (50%) Top Down Budget
Setting 22 (16%) 17 (15%) 2 (7%) 4 (25%) 4 (9%) 3 (13%)
Bottom Up Approach 59 (42%) 39 (35%) (68%) 7 (44%) 25 (58%) 9 (38%)19
140 (100%) 111 (100%) (100%)28 (100%)16 (100%)43 (100%)24
87
Table 8: Distribution of Budgeting Approach by Firm Structure
Organization Structure
Diversified Group by
Product
Diversified Group by
Country Manufacturing Service
Top Down Target
Setting 41 (43%) 25 (45%) 17 (47%) 53 (40%) Top Down Budget
Setting 15 (16%) 7 (13%) 5 (14%) 20 (15%) Bottom Up Approach 40 (42%) 23 (42%) 14 (39%) 58 (44%) 96 (100%) 55 (100%) 36 (100%) 131 (100%)
The results in Table 8 show that the choice of budgeting approach is not affected by whether a firm is diversified or not. Furthermore, the choice of budgeting approach in undiversified firm is not affected by whether the firm is primarily in manufacturing or service industry.
TIME COST OF BUDGETING
There is no doubt that budgeting is time-consuming. Budgeting is reported to take 20%-30% of managers’ time in Hope and Fraser (2003) and 21%-40% in Umapathy (1987). These results are generally accepted as representative of US companies and appear to indicate a trend of reduced time cost over the years. Our survey shows a lower time cost for budgeting where the median lies in the 10%-20% range compared to the US studies. The detailed results are tabulated below.
Table 9: Distribution of Time Spend on Budgeting
N %
None at all 39 12%
Up to 10% 81 24%
10% to below 20% 67 20%
20% to below 30% 59 18%
30% to below 40% 45 14%
40% to below 50% 16 5%
More than 50% 24 7%
Asia-Pacific Management Accounting Journal, Volume 12 Issue 1
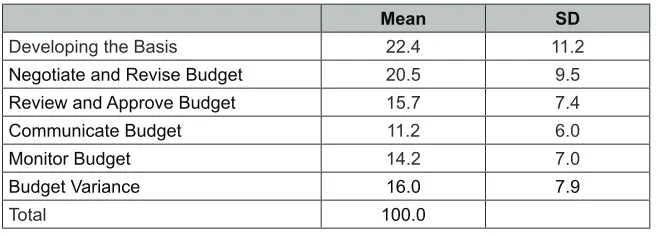
We requested the respondents who prepare the budget with a business plan to allocate their time spent on budgeting activities over a total of 100 points. The results are as follows:
Table 10: Distribution of Mean Time Allocation on Budgeting Activities
Mean SD
Developing the Basis 22.4 11.2
Negotiate and Revise Budget 20.5 9.5
Review and Approve Budget 15.7 7.4
Communicate Budget 11.2 6.0
Monitor Budget 14.2 7.0
Budget Variance 16.0 7.9
Total 100.0
The table illustrates the ratio of time spent in preparing a budget (developing the basis, negotiating and revising, reviewing and approving, communicating the budget) to time spent in using the budget (monitoring budget and analysing variance) is approximately 7:3.
89
Budgeting Practice in Singapore negotiatin
using the
We inves figure (th
Fig
The resu developin more tim sophistic
USE OF
We surv (n=187) of firms 3 4
ng and revis e budget (mo
stigated if th he vertical ax
gure 4: Anal
ults show th ng the basis me foranalysi cated use of t
F BUDGET
eyed a subs
on how bud
for each usa Up to 10% to below 20% to below 30% to below 4 40% to below 5 More than 5
Developing Communica
sing, review onitoring bud
he activity al xis is the tim
lysis of Tim
at firms spe of the budg ing variances the budget.
WHEN PR
set of the re dgets are use age in brack
0% 10% 20% 30% 40% 50% 50% 2 2 2 2 the Basis ate Budget
wing and app dget and ana
llocation var me spenton b
me Allocatio B
ending less et, andfirms s. Therefore
REPARED W
espondents,th ed for strateg ket) are: fore
20% 23 23 22 20 22 1 1 2 20 18 2 Negotiat Monitor B
proving, com alysing varia
ries with the udgeting):
n of Budge Budgeting
time on bud spending m ,firmsspendi
WITH BUS
he firms tha gic planning ecasting cas 40% 21 9 22 0 8 2 16 16 15 16 14 16
e and Revise B Budget
mmunicating ance) is appro
time spento
ting Activit
dgeting appe more time on
ing more tim
INESS PLA
at prepared
g. The comm
sh flow (70% 60% 6 5 12 10 12 10 11 10 16 Budget Revie Budge the budget) oximately 7
onbudgeting
ies by Time
ear to alloca n budgeting a me in budget
AN
budgets wit mon uses (wi %), guiding 80% 13 16 14 16 6 13 14 17 15 17 19 18
ew and Approve et Variance
) to time spe :3.
g in the follo
e Spend on
ate more tim appear to all ting adopt a
th business ith the propo
and coordin 100% 4 5 7 8 e Budget 11 ent in owing
me in ocate more
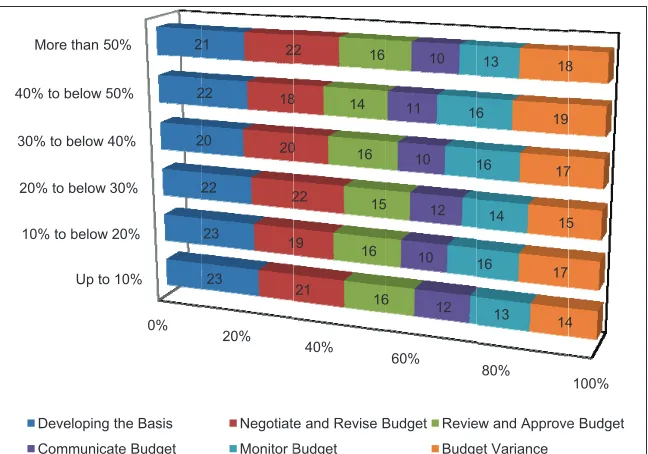
plans ortion nating Figure 4: Analysis of Time Allocation of Budgeting
Activities by Time Spend on Budgeting
The results show that firms spending less time on budgeting appear to allocate more time in developing the basis of the budget and firms spending more time on budgeting appear to allocate more time for analysing variances. Therefore, firms spending more time in budgeting adopt a more sophisticated use of the budget.
USE OF BUDGET WHEN PREPARED WITH BUSINESS
PLAN
Asia-Pacific Management Accounting Journal, Volume 12 Issue 1
business conditions when necessary (63%), setting performance targets and evaluating subsequent actual performance against the budgets for future planning purposes (71%), setting performance targets and evaluating subsequent actual performance against the budgets for employees’ performance evaluation purposes (51%), and setting performance targets and evaluating subsequent actual performance against the budgets for employees’ performance compensation purposes (43%). We examined whether these uses vary by firm size as shown in the figure below:
business
and wher revising performa planning performa setting pe employee
by firm s
Fig
Forecasti
business $10m (u forecastin
other fore
The bud
implemen revenueb anomaly generally Guide a Budg Set Tar Set T
during the b re necessary
budgets to
ance targets purposes
ance against erformance t es’ performa size as shown
gure 5: Ana
ing cash flow
plans. This
sed by 76%
ng in larger
ecasting met
dget also ser
ntation (used
below $1m, may indica y use the bu
and Coordinate
Manage by
get accommoda
rget to Monitor
Target for Emp
Set Target fo
Above $1
budget period y, following
reflect the and evaluati
(71%), sett
the budget
targets and e ance compen n in the figu
lysis of Use
w is a comm
s use is espe
%-85% of th firms (used thods such a
rves as an d by 73% of
use of bud ate a differ udget to guid
Forecast Cash
Business Activ
y Variance Ana
ate external ch
Strategy Exec
ployee Perform
or Performance
1b $100m
d (73%), ide
up (66%), changed b
ing subseque ting perform s for emplo evaluating su
nsation purp
ure below:
e of Budget
mon use (by 7 ecially impo
e firms). Th d by 62%-71 as regression
important g f all firm). W
dget to guid rent approac de and coord
hflow (Mean 70
vities (Mean 73
alysis (Mean 66
ange (Mean 63
cution (Mean 71
ance (Mean 51
e Pay (Mean 43
m to $1b $
entifying var monitoring usiness con ent actual pe
mance targ oyees’ perfor
ubsequent ac poses (43%)
t in Strategi
70% of all f ortant in sm
he lower im
1% of the fi n models from
guidance an With the exc e strategy a ch used by
dinate busin
0% 10% 0%) 3%) 6%) 3%) 1%) 1%) 3%)
10m to $100m
riances (e.g.,
any change nditions whe
erformance a gets and ev
rmance eval ctual perform ). We exami
c Planning
firms) for fir maller firms mportance of irms) may a
m interim fin
d coordinat eption of ve appears to in
very small ness activitie
% 20% 30% 40
31% 3
29%
24%
$1m to $
, price and v
s in busines en necessary against the b
valuating su
luation purp
mance again ined whether
By Firm Siz
ms that prep
with annual f using budg arise because nancial state
ion mechan
ry small firm
ncrease with l firms. For
es, and large
0% 50% 60%
51% 6 53% 51% 6 6 45% 38% 6 42% 54% 46% % 5% 47% 53% $10m Belo
volume varia ss conditions
y (63%), se
budgets for f
ubsequent a poses (51%) st the budge r these uses
ze (N=187)
pare budgets l turnover b
get for cash
e these firm
ements.
nism for stra
ms earningan h firm size. r example,
er firms are
% 70% 80% 9
65% 78% 69% 78% 82% 63% 71% 75% 78% 61% 67% 62% 67% 62% 67% 79% 85 65% 62% 76% 82% ow $1m 12 ances) s and etting future actual , and ts for vary s with below flow ms use ategy nnual . The
firms more 0% % 5% %
Figure 5: Analysis of Use of Budget in Strategic Planning By Firm Size (N=187)
Forecasting cash flow is a common use (by 70% of all firms) for firms that prepare budgets with business plans. This use is especially important in smaller firms with annual turnover below $10m (used by 76%-85% of the firms). The lower importance of using budget for cash flow forecasting in larger firms (used by 62%-71% of the firms) may arise because these firms use other forecasting methods such as regression models from interim financial statements.
91
the exception of very small firms earning annual revenue below $1m, use of budget to guide strategy appears to increase with firm size. The anomaly may indicate a different approach used by very small firms. For example, firms generally use the budget to guide and coordinate business activities, and larger firms are more proficient in doing so. However, very small firms use budgets to guide and coordinate business activities with liquidity as the primary constraint. This pattern is consistent with the greater focus of using the budget for cash flow forecasting in small firms.
About 66% of the firms that prepare budgets with business plans also use variance analysis. There appears to be two groups – a minority of very small firms earning annual revenue below $1m (35% use variance analysis), and a majority of larger firms (62%-78% use variance analysis). Variance analysis provides insight on the contribution of price and volume variations to budget deviations. When this information is interpreted with known business activities, it helps to explain the outcome of business strategy. The low use of variance analysis in very small firms probably indicates that maintaining liquidity, as opposed to value maximization, is the primary objective of strategy execution in these firms. It is comforting to note that a majority of the larger firms analyse their variances.
Generally, we expect larger firms to be more sophisticated and extensive in using budgets as a strategic planning tool. Our results suggest that as organisation size increases, firms are more likely to monitor changes in business conditions and revise their budgets accordingly. For instance, only 47% of the firms with annual revenue below $1m use budgeting as a strategic planning tool as compared with 78% of the firms with annual revenue above $1b.
Overall, a clear majority of the firms uses budgets to set targets to monitor strategy execution (71%). This happens less in small firms with annual revenue below $10m (53%-54%), and much more when annual revenue is above $10m (67%-82%). The results are generally consistent with expectation.
Asia-Pacific Management Accounting Journal, Volume 12 Issue 1
are met. Approximately 30% of the firms that use the budget to set targets for strategy execution do not use the budget to set targets for employee performance evaluation4
About 16% of the firms that use the budget to set targets for employee performance evaluation do not use budgets for employee performance compensation5. Using the budget results to compensate employee performance is less prevalent than expected, only about 43% of the surveyed firms pay for performance based on budget target achievement.
The prevalence of use of budgets for performance compensation varies with firm size. For firms with above $100m annual revenue, 51% compensates performance based on achievement of budget targets; for firms with $1m to $100m annual revenue, it is approximately a third; for firms with below $1m annual revenue, it is about a quarter.
USEFULNESS OF BUDGET PREPARED WITH BUSINESS
PLAN
We use the same subset of respondents whose firms prepare budgets with business plans (n=187) to examine the usefulness of the operating budgets. The results (with the number of respondents in bracket) are summarized as follows:
4 Figure 5 shows that 71% of 187 firms set budget to monitor strategic performance, and 51% of the same 187 firms set target to monitor employee performance. Therefore, of the firms that use budget to monitor strategic performance, 51/71 = 72% also use budget to monitor employee performance. About 30% (more precisely 28%) of the firms that use budget to monitor strategic performance do not use budget to monitor employee performance
93
Budgeting Practice in Singapore
firms wit
USEFUL
We use (n=187) responde
Only abo
takes so while a obsolete, Similarly “budgetin period”.T constrain majority Budg Bu tra Sou cro B S
th below $1m
LNESS OF
the same s
to examine ents in brack
Figure 6
out 40% of long that by
significant
, the majority
y, only abou
ng is too in This result n
n effective r view.
et helps to a (N= udget helps ack planned urce of budg oss function Budget const business c Slow budget obsole
m annual rev
F BUDGET
subset of re e the usefuln
et) are summ
6: Analysis
the respond
y the time th
portion of
y (60%) doe
ut 40% of th nflexible to
ot only show
response to
allocate Res 183) to coordina strategy (N get variance nal effort (N=
trains respo change (N=1 ing makes b ete (N=184)
Strongly D
venue, it is a
PREPARE
espondents w ness of the o
marized as fo
of Respons
ents agree o he budget is
the respond es not think s
he responde
keep up wi ws that a sign
environmen 0% source te and N=184) helps =183) nse to 83) budget 1% 2% 2% 2% Disagree Di
about a quart
ED WITH B
whose firm
operating bu
ollows:
se to Usefu
or strongly a
ready, it is a dents think
so.
ents agree or
ith business
nificant port ntal change,
20% 18% 5% 7% 5% % 10% % % % 8% 13% sagree Ag ter. USINESS P
ms prepare b udgets. The
lness of Op
agree with th already obso that the sl
r strongly a
changes an tion of the re
, but alsobu
40% 26% 26% % 35% 33% ree Strong PLAN
budgets with
results (wit
perating Bud
he statement olete”. This
low process
gree with th nd lock us i
espondents th
usted the m
60% 51% 48%
ly Agree
h business
th the numb
dget
t that “budg
result shows s makes bu
he statement
n for the bu
hink that bu myththat this
80% 68% 72% 70% 14 plans
ber of
geting s that udgets t that udget dgets is a %
Figure 6: Analysis of Response to Usefulness of Operating Budget
Only about 40% of the respondents agree or strongly agree with the statement that “budgeting takes so long that by the time the budget is ready, it is already obsolete”. This result shows that while a significant portion of the respondents think that the slow process makes budgets obsolete, the majority (60%) does not think so.
Similarly, only about 40% of the respondents agree or strongly agree with the statement that “budgeting is too inflexible to keep up with business changes and lock us in for the budget period”. This result not only shows that a significant portion of the respondents think that budgets constrain effective response to environmental change, but also busted the myth that this is a majority view.
The value of variance analysis as a business tool is clearly recognized. About 88% of the respondents agree or strongly agree with the statement that “Identifying the source of budget variances helps to initiate cross-functional effort to solve business problems”.
Asia-Pacific Management Accounting Journal, Volume 12 Issue 1
The importance of the budget for resource allocation is well recognized. Approximately 94% of the respondents agree or strongly agree with the statement that “budgeting helps to allocate resources (people and funding) to the departments that need them”.
In conclusion, the majority of the respondents, whose firms prepare budgets with business plans, view operating budgets as generally useful.
USEFULNESS OF BUDGET IN PERFORMANCE
EVALUATION AND REWARD
We surveyed the respondents whose firms prepared budgets (n=332) about the usefulness of budget for performance evaluation and reward, and the prevalence of known problems.
The valu responde
variances
There is
planned
“budgeti
The impo
the respo
resources
In conclu
view ope
USEFUL
We surv budget fo
Budg
Meet
ue of varian ents agree or
s helps to ini
almost una
strategy. Ab
is a useful to
ortance of th ondents agre s (people and
usion, the ma erating budge
LNESS OF
eyed the res or performan
Figure 7:
get is useful for
ting budget is i perfo
Manag
Th
nce analysis
r strongly a itiate cross-f animous agr bout 98% of ool to coordi
he budget fo ee or strong d funding) to
ajority of the ets as genera
F BUDGET
spondents w nce evaluatio
Budget Us
rewarding perf
mportant in eva ormance (N=32
ger sandbag th
ere is budget r
Strongly A
as a busin agree with th
functional ef
reement on
fthe respond inate and trac
or resource a gly agree w o the departm
e responden ally useful.
IN PERFO
whose firms
on and rewar
sefulness fo
formance (N=3
aluating emplo 23)
he budget (N=3
ratcheting (N=3
Agree Agre
ness tool is he statement ffort to solve
the usefuln dents agree o ck the progr
allocation is with the state
ments that ne
nts, whose fir
ORMANCE
prepared bu rd, and the p
or Performa 0% 10 318) oyee 326) 317) 8% 9 1% 2% 1% 3% e Disagree
clearly reco t that “Iden
e business pr
ness of bud or strongly a
ress of plann
well recogn ement that “
eed them”.
rms prepare
EVALUATI
udgets (n=3 prevalence o
ance Evalua
% 20% 30%
% 9% 15% 14% 15% 24% 12% 14% e Strongly
ognized. Ab
tifying the s
roblems”.
dget to coor
agree with th ned strategy”
nized. Appro
“budgeting
budgets wit
ION AND R
332) about t
f known pro
ation and Re
% 40% 50%
Disagree
bout 88% o source of bu
rdinate and he statemen
”.
oximately 94 helps to all
th business p
REWARD
the usefulne oblems.
eward
60% 70% 8
75 64% 72% 69% 15 of the udget track nt that
4% of
ocate plans, ess of 80% 5% %
Figure 7: Budget Usefulness for Performance Evaluation and Reward
95
The importance of meeting the budget in performance evaluation is also well recognized. About 73% of the respondents agree or strongly agree with the statement “Meeting the budget is very important in evaluating and assessing an employee’s performance”.
The problems of budget manipulation are also prevalent. About 87% of the respondents agree or strongly agree with the statement “Managers who develop budget and are responsible for its achievement often build slack into the budget”. This problem is commonly called sandbagging (or padding) the budget which distorts true estimates on revenues and expenses.
Budget ratcheting is related to the sandbagging problem. About 83% of the respondents agree or strongly agree with the statement “Managers who review and approve budget often increase the targets over time when targeted performance has been achieved in the past”. Budget ratcheting not only counters the slacks built into the operating budget, but also promote behaviours such as unnecessary end-of-period spending so that the budgeted amount remains for the following year.
Asia-Pacific Management Accounting Journal, Volume 12 Issue 1 The majo
42% that
almost al The com performa
CHALLE
We surv challenge
F
From the
that “For Pr Bud Budge There Dis Deli
ority (58%) o t claimed oth lways tied to
mmon feature ance (67%) a
ENGES IN
veyed the r
es in prepari
Figure 9: Dis
e survey resu r afirm’s op
Benefit Exc Preparers/ assump Explicit as strat Budget deli surpr reparers/rev (N dget adapts (N et hinders re
change Low buy-consu is ratcheting tortion of ta
(N nk budgetin apprais
of the respon herwise is s o budget perf es of bonus p and bonus pa
BUDGET P
respondents ing them. Th
stribution o
ults, about60
erating budg
ceed Cost (N Reviewers c ptions (N=32 sumption ba egy (N=324 ivers financ rise (N=324) viewers well =321) * to external =314)* esponse to e
(N=316) -in from insu ultation (N=3 g of target ( rget due to N=314) ng and perfo sal (N=321)
Strongly D
ndents indica surprisingas
formance.
plan include ayable after
PREPARA
whose firm
he results are
of Response
0% of the res get to serve
0% N=325)* common 25)* ased on )* ial if no )* trained change external ufficient 316) N=318) politics rmance 1 2 Disagree Di
ates that thei anecdotal ev
e the presenc
exceeding a
TION
ms prepared e as follows:
e to the Cha
spondents ag
as a more
20% 7% 6% 6% 10% 7% 12% 7% 4% 8% 8% 10% 14% 11% 14% 2 3% 3% 1% 2% 3% 3% 5% 6% 3% 6% 9% isagree Ag
ir bonus is li vidence app
ce of a cap ( minimum ta
d budgets
allenges in
gree or stron effective too 40% 22% 22% 26% 30% 21% 30% 31% gree Strong
inked to mee
ears to sugg
(70%), bonu
arget (59%).
(n=332) an
Budget Pre
ngly agree w ol for strate
% 60% 46% 56 50% 44% gly Agree
eting budget gest that bon
us increasing
.
nd explored
eparation
with the state gic planning % 80 68% 69% 64% 72% 59% 68% 6% 17 t. The
nus is
g with d the ement g and 0% 79% 78%
Figure 8: Use of Budget in Bonus Plan
The majority (58%) of the respondents indicates that their bonus is linked to meeting budget. The 42% that claimed otherwise is surprising as anecdotal evidence appears to suggest that bonus is almost always tied to budget performance.
The common features of bonus plan include the presence of a cap (70%), bonus increasing with performance (67%) and bonus payable after exceeding a minimum target (59%).
CHALLENGES IN BUDGET PREPARATION
97
Budgeting Practice in Singapore 42% that
almost al The com performa
CHALLE
We surv challenge
F
From the
that “For Pr Bud Budge There Dis Deli
t claimed oth lways tied to
mmon feature ance (67%) a
ENGES IN
veyed the r
es in prepari
Figure 9: Dis
e survey resu r afirm’s op
Benefit Exc Preparers/ assump Explicit as strat Budget deli surpr reparers/rev (N dget adapts (N et hinders re
change Low buy-consu is ratcheting tortion of ta
(N nk budgetin apprais
herwise is s o budget perf es of bonus p and bonus pa
BUDGET P
respondents ing them. Th
stribution o
ults, about60
erating budg
ceed Cost (N Reviewers c ptions (N=32 sumption ba egy (N=324 ivers financ rise (N=324) viewers well =321) * to external =314)* esponse to e
(N=316) -in from insu ultation (N=3 g of target (
rget due to N=314) ng and perfo sal (N=321)
Strongly D
surprisingas
formance.
plan include ayable after
PREPARA
whose firm
he results are
of Response
0% of the res get to serve
0% N=325)* common 25)* ased on )* ial if no )* trained change external ufficient 316) N=318) politics rmance 1 2 Disagree Di anecdotal ev
e the presenc
exceeding a
TION
ms prepared e as follows:
e to the Cha
spondents ag
as a more
20% 7% 6% 6% 10% 7% 12% 7% 4% 8% 8% 10% 14% 11% 14% 2 3% 3% 1% 2% 3% 3% 5% 6% 3% 6% 9% isagree Ag vidence app
ce of a cap ( minimum ta
d budgets
allenges in
gree or stron effective too 40% 22% 22% 26% 30% 21% 30% 31% gree Strong
ears to sugg
(70%), bonu
arget (59%).
(n=332) an
Budget Pre
ngly agree w ol for strate
% 60% 46% 56 50% 44% gly Agree
gest that bon
us increasing
.
nd explored
eparation
with the state gic planning % 80 68% 69% 64% 72% 59% 68% 6% 17 nus is
g with d the ement g and 0% 79% 78%
Figure 9: Distribution of Response to the Challenges in Budget Preparation
From the survey results, about 60% of the respondents agree or strongly agree with the statement that “For a firm’s operating budget to serve as a more effective tool for strategic planning and coordination, employee compensation should not be linked to budget achievement”. Therefore, a majority of the respondents think that budget should not be linked to performance appraisal.
About 64% of the respondents agree or strongly agree with the statement that “There is often so much politics involved in the budgeting process that render the final budget less than an accurate depiction of what the firm can actually achieve”. This suggests that the problem that politics degrade the reliability of budget estimates is well recognized.
Asia-Pacific Management Accounting Journal, Volume 12 Issue 1
The lack of budget buy-in is a common complain. However, only about 50% of the respondents agree or strongly agree with the statement that “There are insufficient consultations and agreement before the budget is finalized, resulting in inadequate buy-in during implementation”.
Changes in the external environment are inevitable and pose a major problem for budgeting as the underlying assumptions may become invalid. For respondents whose firms prepare a budget, a majority perceives the budget to hinder effective response. Approximately 66% agree or strongly agree with the statement that “When there are unexpected changes in business conditions, the budget hinders resource mobilization needed to respond to the changes”. This is a similar question that we asked respondents who prepared budgets with the business plan “Budgeting is too inflexible to keep up with business changes and lock us in for the budget period” of which only about 40% of the respondents agree or strongly agree with the statement.
Another aspect of the effect of external change on budgeting is to revise the budget. This is surprisingly prevalent. About 85% of the respondents that prepare budget agree or strongly agree with the statement that “When there are unexpected changes in business conditions, my firm requires the budget to be revised in light of the changes”. However, only 63% of the respondents who prepare a budget with business plan claimed, “to monitor any changes in business conditions and where necessary, revise budgets to reflect the changed business conditions”. The results captured a subtle difference where approximately two third of the firms actively monitor business changes and make the necessary changes. But a larger 85% of respondents would revise the budget when their organisations know and require changes in budget to changed business conditions.
There is a clear majority view that budget preparers and reviewers are well trained. About 71% of the respondents that prepare budget agree or strongly agree with the statement that “Budget preparers and reviewers are well versed and trained in variance analysis and the use of static/flexible budget”.
99
of the business outcome that will be achieved if things go according to expectations”. This result is surprising given that there is also a clear majority that thinks that budget manipulation is common. A possible explanation is that the business outcome will be achieved with a comfortable surplus when the environment is stable. This means that target ratcheting cannot fully compensate for the effect of sandbagging. The validity of this interpretation requires further research.
There is also a clear majority view that the budget is based on explicit assumption derived from strategy. About 85% of the respondents that prepare budget agree or strongly agree with the statement that “the budget assumptions are explicit and arise from an agreed strategy”. The result is incongruent with the neely et al. (2001) which states that budgets are “rarely strategically focused and based on implicit but invalid assumptions”. The difference in these two results may arise as the respondents are from different countries and time period.
About 75% of the respondents that prepare budget agree or strongly agree with the statement that “Budget preparers and reviewers share the same understanding of the budget assumptions”. The high percentage is indicative of a well-functioning budgeting process in Singapore.
The litmus test whether budgets should continue to exist depends on whether their benefits exceed budgeting costs. About 75% of the respondents that prepare budget agree or strongly agree with the statement that “the benefits outweigh the costs (time and resource spent) of the budgeting process”. The results show that budgeting would continue to exist in Singapore on its own merits and not due to the lack of viable alternatives or tools.
DISCUSSION AND CONCLUSION
Asia-Pacific Management Accounting Journal, Volume 12 Issue 1
to higher value-adding activities such as analysing variance, educating managers on using variance for decision making, supporting analysis such as breakeven, costing, tracking strategy implementation and performance. Our motivation for this study is to better understand this lever and identify where accountants can help.
We found that about 7% of Singapore firms do not prepare budgets, and nearly 30% incorporate business strategy assumptions in budgets to a large extent. About a quarter of the firms with annual revenue below $1m do not prepare budgets, which is much higher than the overall average of 7%. Expectedly, incremental budgeting is more popular than zero based budgeting because it demands less resource.
About 40% of Singapore firms prepare budgets without any business plan compared with 14% in the US. These firms are likely to benefit from discussing about the business strategy and programs before preparing budgets when sequencing the business planning process. Accountants who are involved in the planning stage can better help managers to assess the financial impacts of their plans. The rewards for the accountants come later when the basis of the budget is more easily understood and the managers will be more cooperative in meeting the deadlines for submitting budget drafts.
Multinational companies are more likely to prepare budgets than local companies; diversified firms are more likely to prepare budgets than non-diversified firms. These results allude to more extensive use of budget for strategic control as firms operate in more locations and have more significant business units. The prevalence of the top down approach to bottom up approach to budgeting is approximately 60:40. Top down approach is especially common in small firms while the bottom up approach is more common in GLC.
101
Analysing the average time allocated to budgeting activities reveals that about 70% of the time is spend on developing the budget and about 30% on using it. Disaggregated analysis shows that as managers spend more time on budgeting, a higher proportion of the time is spend on activities for using the budget, which is where the real benefits lie.
Our findings show that for firms that prepare budgets with business plans, managers generally consider budget a useful management tool where pros outweigh the cons. About 40% of the respondents recognize the problems that slow budgeting can make budget obsolete and budget can constrain response to business changes. However, an overwhelming 88%-98% of the respondents recognize the value of budget to allocate resource, coordinate and track strategy, and coordinate cross functional effort via budget variance. The Singapore results, therefore, show that when budgets are prepared with business plans, the prescription of the Beyond Budgeting initiative may be too radical. Instead, improvement of budgeting practice through training and adoption of best practices would be a more pragmatic approach.
Our findings suggest that the use of budgeting in strategic planning appears to be divided into two groups. For very small firms with annual revenue below $1m, the primary objective appears to be maintaining liquidity where there is a strong focus on forecasting cash flows, guiding and coordinating business activities, and low importance associated with variance analysis. In the other group, there appears to be a greater focus on using budget for strategic planning as firm size increases. We observe that as size increases for this group, there is less use of budget for forecasting cash flows, more use for guiding business activities, more management by variance, and more budget revision in response to external changes. Therefore, the budgeting needs in the two groups are different, and designing training programs for budgeting needs to consider the differences.
Asia-Pacific Management Accounting Journal, Volume 12 Issue 1
generally increase with firm size. For example, a quarter of the firms with annual revenue below $1m compensate by budget performance, while half of the firms with revenue above $100m do so. not compensating by budget performance can mean firms are not paying for performance at all, or are using other measures to pay for performance. Other measures to pay for performance include using market indicators like share price, subjective ratings or rankings, peer or subordinate ratings and combinations of indicators.
Our results on challenges in budgeting appear to be less disheartening than suggested by extant literature. Responses agreeing or strongly agreeing to the problems of low buy-ins of budget, target distortions due to politics, budget hindering strategic response and budget ratcheting range from 50% to 76%, but responses agreeing or strongly agreeing to positive aspects like well-trained preparers and reviewers, common assumptions in budgeting, budgets are adapted to external changes, and assumptions are based on strategy range from 71% to 88%. The litmus test that budget benefits exceed costs elicits agreement or strong agreement from 75% of the respondents. The finding means that accountants may be receptive to receive training in how to be more effective in the budgeting process.
REFERENCES
Bazerman, M. H. & neale, M. A. (1993). Negotiating Rationally. new York: Simon and Schuster.
Hope, J. & Fraser, R. (2003). new ways of setting rewards: The beyond budgeting model. Californian Management Review, 45(4), 104-119.
Horngren, C. T., Bhimani, A., Srikant M. & Datar, F.G. (2002). Management and Cost Accounting. Harlow: Financial Times/Prentice Hall.
Jensen, M. (2003). Paying People to Lie: the Truth about the Budgeting Process. European Financial Management, 9(3), 379-406.
103
neely, A., Sutcliff, M. & Heyns, H. (2001). Driving Value through Strategic Planning and Budgeting. new York: Accenture
Rumelt, R. P. (1974) Strategy, Structure and Economic Performance. Boston: Harvard Business School.