Numerical Analysis of Electron Energy Distribution Function and
Its E
ff
ects on the H
−
Production in Linac4 H
−
Source
∗
)
Shintaro MOCHIZUKI, Stefano MATTEI
1), Kenjiro NISHIDA,
Akiyoshi HATAYAMA and Jacques LETTRY
1)Faculty of Science and Technology, Keio University, 3-14-1 Hiyoshi, Kohoku-ku, Yokohama 223-8522, Japan
1)CERN, 1211 Geneva 23, Switzerland
(Received 30 November 2015/Accepted 2 March 2016)
In order to enhance the H−surface production in hydrogen negative ion sources, it is important to increase the density of the H atoms dissociated from H2molecule and the resultant atomic flux towards the surface of the
plasma grid. In this paper, the effect of the Electron Energy Distribution Function (EEDF) on the dissociation of H2in Linac4 H−source has been studied using Electromagnetic Particle In Cell (EM-PIC) simulation with
Monte Carlo method for Collision Processes (MCC). It has been shown that the rate coefficient of dissociation reactions can be enhanced in the lower H2gas pressure regime, while the H atom production rate becomes larger
in the higher pressure regime. It is suggested that the optimal H2gas pressure to maximize the H atom production
is determined by the balance of rate coefficient and the H2density.
c
2016 The Japan Society of Plasma Science and Nuclear Fusion Research
Keywords: negative ion source, rf plasma, electron energy distribution function, dissociation rate, particle in cell DOI: 10.1585/pfr.11.2406044
1. Introduction
In order to understand Radio Frequency Inductively Coupled Plasmas (RF-ICPs) in hydrogen negative ion sources, the numerical simulation code based on the Elec-tromagnetic Particle in Cell (EM-PIC) Model with Monte Carlo method for Collision Processes (MCC) has been de-veloped [1]. This code has been applied to the numerical analyses of the hydrogen negative ions source of Linac4 (see Ref. [2] and below) and improved step-by-step by in-cluding various effects, such as i) capacitive component of the electric field [3], ii) Coulomb collision [4] and iii) cou-pling to the Collisional Radiative (CR) model [5, 6] for the calculation of Balmer emission lines from the source plas-mas.
The Large Hadron Collider (LHC) requires an up-grade of its injector complex. Linac4 is a 160 MeV H− accelerator that is currently being built [7] in order to im-prove the performance of the accelerator complex. To achieve the requirement, the H−source of Linac4 is being developed to provide the H−ion current. H−ions are pro-duced by surface production due to the H0atoms incoming
to the cesiated surface of the plasma electrode, and these H0atoms are produced by dissociation from H2molecules.
The dissociation rate of H2 is determined by the density
of H2, the Electron Energy Distribution Function (EEDF)
and the electron density. Thus, the EEDF is one of the key parameters to estimate the amount of H− produced in the source chamber. It is generally difficult to analyze author’s e-mail: [email protected]
∗)This article is based on the presentation at the 25th International Toki Conference (ITC25).
the EEDF experimentally, therefore numerical simulation plays a key role. However, most of previous studies men-tioned above were focused on the macroscopic property of RF-ICPs and detailed discussion of the EEDF in RF-ICPs has not been given so far.
The final goals of our study are as follows; i) to under-stand the dependence of the EEDF on the RF parameters, ii) to understand the effect of the EEDF on the dissociation rate and production rate of H atoms, iii) to estimate the amount of H−ions produced by surface production in neg-ative ion sources. In the previous paper [8], we have done the initial study of above items, especially the dependence of the EEDF on the initial H2gas pressure has been
inves-tigated. In the present paper, focusing the first and second items, we extend the previous study and more systematic investigation has been done.
2. Simulation Model
2.1
Basic equations and model geometry
The EM-PIC MCC model used in the present study is almost the same as that in Ref. [3]. Here, we briefly summarize the basic equations, model geometry and main assumptions. More detailed descriptions have been given in Ref. [4].The model consists of mainly two modules. One is the two-dimensional (2D) model of RF electromagnetic field produced by the external RF-coil and plasma. We can calculate the electromagnetic fields numerically by solving Maxwell Equations. For simplicity, axial sym-metry has been assumed. The Finite Difference Time
c
2016 The Japan Society of Plasma
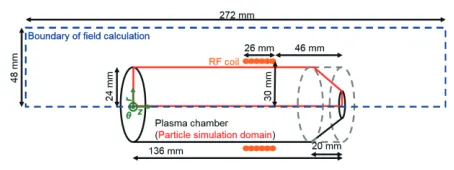
Fig. 1 Model geometry of the numerical simulation.
Domain (FDTD) method [9] has been employed to solve the Maxwell equations. The model of Linac4 H−source used in this study is shown in Fig. 1. The dimensions of the FDTD domain are taken to be double of that of the plasma chamber, in order to avoid the large reflections at the boundary.
The other part is the particle dynamics model with the three-dimension in the real and velocity space (3D3V). The equations of motion for the charged particles are numeri-cally solved. With the use of the electromagnetic fields calculated by the EM-module mentioned above, the veloc-ity of each charged particle is obtained. The velocveloc-ity is also changed by collision process. The process is mod-eled by the MC Null-Collision method [10]. Main colli-sion species taken into account in the simulation are the same as those in Ref. [3]. More than 540 reactions are in-cluded. If particles reach the wall, then they are supposed to be absorbed. The motions of plasma particles produce local plasma currents, and these plasma currents are used in the Maxwell equations with the RF-coil current. In this way, we can calculate self-consistently the electromagnetic field and particle dynamics.
2.2
Simulation condition
The numerical time step Δt for the calculation of the electromagnetic field and the particle motion is de-cided by Courant condition [11] as Δt = 1.0 ×10⁻¹²s. The simulation domain is divided into 13056 cells with
Δr = Δz = 1 mm. RF coils have been modeled as six independent one-turn coils, and the same RF-coil current flows in each one-turn coil asIRF(t) =Icsin(ωRFt). Here
Icis the amplitude of the current,ωRF =2πfRFand fRFis
the RF driven frequency. In this paper, we setIc = 70 A
and fRF=2×10⁶Hz. The simulation code has been
par-allelized using Message Passing Interface (MPI) and per-formed using 128 CPUs.
The initial energy distributions of charged particles are assumed to be Maxwellian distribution with the tem-perature 0.03 eV. Their initial positions are assumed to dis-tributed uniformly in the chamber, and the initial elec-tron density is taken to bene = 1.0×10¹⁸ m−3, n
H+2 =
9.0×10¹⁷m−3 andn
H+ = 1.0×10¹⁷m−3 for ions. The
density of H2 is assumed to be uniform in the chamber,
the density ratio of the molecules to atoms is set to be
nH2 : nH= 10 : 1. The simulations have been performed
with various gas pressure: pH2 = 0.3, 1, 3, 5, 10 Pa, and
nH2has been determined by pH2 and neutral gas
tempera-ture which is assumed to be 300 K.
2.3
Theoretical model of the EEDF
To discuss the validity of the numerical results of EEDFs obtained by the EM-PIC MCC simulation, com-parisons will be made with those by a relatively simple analytic approach using Boltzmann equation. Here, we briefly summarize such a simple theoretical model [12] which gives us a basic theoretical guideline to interpret the numerical results of the EEDF in the complex system.
In order to solve the Boltzmann equation of the EEDF analytically, we expand the EEDF f as
f = f0+f1, (1)
and assume f0 f1. Here f0 is the equilibrium compo-nent of EEDF and f1 is the non-equilibrium component.
To describe the anisotropy, the vectorf1is introduced. We
obtain the following equations from Boltzmann equation,
ne
3mev2
d dv(v
2E· f
1)=S0, (2)
meE me
df0
dv + e
me(B×f1
)=−S1, (3)
whereS0andS1are the linearized collision terms.n,e,me,
EandBare the electron density, electron charge, electron mass, electric field and magnetic field, respectively. Here uniform plasma and uniform electric and magnetic fields are assumed.
In the present condition,ωRFis much smaller than
cy-clotron frequencyωcand collision frequencyvm. This
rela-tion is always satisfied thorough one RF cycle. Thus, elec-tromagnetic fields can be assumed to be constant for the collision and cyclotron time scale. We take into account only elastic collision with neutral particles.
Under these conditions, with Eq. (2) and (3), we can obtain f0as the Maxwell distribution,
f0=n
me
2πTe
3/2
exp
−mev2
2Te
, (4)
with the effective temperature
Te=Ta+
2 3
e2E2
3meκ(ω2 c+ν2m)
, (5)
whereTaandκare the neutral gas temperature and energy transfer coefficient, respectively.
3. Results and Discussions
3.1
Time evolution of electron densities,
av-erage energies and typical example of the
EEDFs
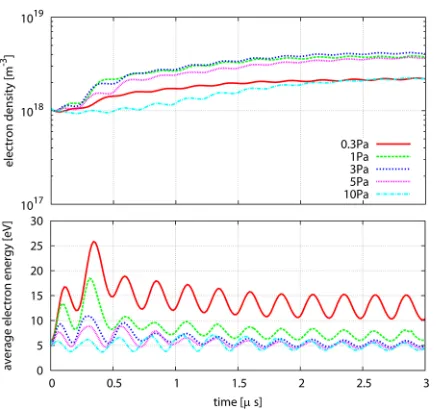
We have calculated 6 RF cycles that are equal to 3µs. Figure 2 shows the time evolution of the electron densi-ties and average electron energies for various H2gas
Fig. 2 Time evolution of the electron density (top) and average electron energy (bottom) for various H2 gas pressure.
Fig. 3 The EEDFs averaged over the one RF cycle (2.5∼3µs).
corresponds to 2.5∼3µs. Therefore, the analysis has been performed based on the results in the 6th cycle.
Figure 3 shows the EEDFs for various gas pressures obtained by simulation. In this figure the EEDFs aver-aged over the last one RF cycle (i.e., the 6th RF cycle) are shown. It is shown that the low energy components of the EEDFs are relaxed to almost Maxwellian distribution, as indicated by the Eq. (4). It is also shown that the cases with higher pressure have the larger gradients of the EEDF, i.e., the lower electron temperature. This tendency agrees with the Eq. (4) and (5). If H2gas pressure increases, the
number of the collisions between the electrons and the H2
molecules increases. The electrons become more likely to loose their energies, therefore the electron temperature be-comes low.
In addition, the population of the high energy compo-nent of the EEDF, i.e., the non-equilibrium compocompo-nent of the EEDF, is enhanced in the lower H2gas pressure regime.
Fig. 4 The dependence of (a) the rate coefficient of the dissoci-ation reactions and (b) H atom production rate on the H2
gas pressure.
3.2
The relationship between the rate
co-e
ffi
cient of the dissociation from H
2molecule, the H atom production rate
and the H
2gas pressure
H atom is produced by the dissociation reaction of H2
molecule. The production rate of H atom due to dissocia-tion,Sdiss, is described as
Sdiss= 5
i=1
nH2neσiv, (6)
wherenH2,neandσare the density of H2, the density of
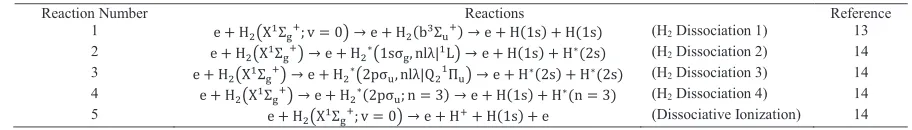
electron and the cross-section of the dissociation reaction, respectively. The symbolidenotes the reaction number. Here five dissociation reactions have been taken into ac-count. They are summarized in Table 1. The symbolσv
is the rate coefficient of the dissociation reactions, Kdiss, and given as
Kdiss=σv=
σ(ε)v(ε)f(ε)dε, (7)
where f(ε) andεare the electron energy distribution func-tion (EEDF) and the electron energy, respectively.
Table 1 The dissociation reactions taken into account in the analysis.
on H2gas pressure for 6th RF cycle. As shown in Fig. 4,
Kdiss is enhanced in the lower pressure condition. This is
due to increase in the high energy component of the EEDF (high energy tail) at lower pressure regime. In addition, the dissociation reactions have the large cross-sections in the relatively high energy regime. Therefore, the high energy tail can enhance the amount of dissociation processes, then it leads to the increase in the dissociation rate.
On the other hand, the H atom production becomes larger for the cases with higher gas pressure, in spite of its relatively low rate coefficients. This is becauseSdiss
de-pends not only on the rate coefficient but also on the H2
gas density. In this calculation isothermal H2 gas is
as-sumed, therefore the H2gas densitynH2is proportional to
the H2gas pressurepH2. If we decrease the gas pressure in
order to enhance the dissociation rate, the H2density must
decrease at the same time.
It is indicated that the gas pressure to maximize the production of H atom exists around 5 Pa. The gas pres-sure to maximize the H atom production is determined by the balance of the rate coefficient and the H2 gas density.
The former has the inverse-proportional dependence and the latter has the proportional dependence on the H2 gas
pressure, therefore it is suggested that the optimal gas pres-sure to maximize the H atom production exists. The basic tendency of results and conclusion will not differ so much in steady state solution from those obtained in this paper.
3.3
Discussion
In this section, we discuss several uncertainties that exist in the present model and analysis. In order to get more robust conclusion, improvement of the model to re-move these uncertainties will be needed.
First, it should be noted thatSdisshas the dependence
on electron density ne. In this calculation, for the
re-striction of the simulation cost, all simulations have been started withne = 1.0×10¹⁸m−3, however the way that
the electron density build-up from its low-density condi-tion must be different from each gas pressure. The condi-tion to maximize the electron density must be also investi-gated.
Secondly, in this calculation, the H2 density is
as-sumed to be constant and distributed uniformly in the chamber. In reality, however, H2 particles exist
non-uniformly in the chamber.
Finally, if a dissociation reaction takes place, then H2
molecule is depleted in such a region. The effect of the
de-pletion of molecules and transport of neutral particles must be included in the simulation for more accurate estimation and will be future work as well.
4. Conclusion and Outlook
The rate coefficient of the dissociation reactions of H2
molecule and the production rate of H atom has been es-timated using the EEDFs obtained by the numerical simu-lation. Non-equilibrium characteristics of the EEDF have been taken into account by kinetic EM-PIC simulation. It has been shown that the dissociation rate is enhanced in the lower gas pressure condition because the high energy tail of the EEDF becomes larger. In contrast, the production rate of the H atom becomes smaller in the low pressure be-cause H2density decreases. The condition to enhance the
H atom production is determined by the balance between the rate coefficient and H2gas density.
In order to get the more robust calculation, the im-provement discussed in Sec. 3.3 will be necessary in the future. Moreover, in this paper we focused on the depen-dence of the dissociation rate and production rate on the H2
gas pressure. However, those two values depend not only on the pressure but also on other parameters, e.g., the input RF power, the RF driven frequency, etc. It is desirable to find the optimal parameters which increase the population of the high energy component of the EEDF without de-creasing the H2 density. The systematic parameter survey
for the dependence on the initial and physical parameters will be future work in order to investigate the condition to enhance the H atom production and resultant enhancement of the surface H−production.
[1] S. Yoshinari, T. Hayami, R. Terasaki, A. Hatayama and A. Fukano, Rev. Sci. Instrum.81, 02A728 (2010).
[2] S. Mattei, M. Ohta, A. Hatayama, J. Lettry, Y. Kawamura, M. Yasumoto and C. Schmitzer, AIP Conf. Proc.1515, 386 (2013).
[3] S. Mattei, M. Ohta, M. Yasumoto, A. Hatayama, J. Lettry and A. Grudiev, Rev. Sci. Instrum.85, 02B115 (2014). [4] S. Mochizuki, S. Mattei, T. Shibata, K. Nishida, A.
Hatayama and J. Lettry, AIP Conf. Proc. 1655, 020016 (2015).
[5] T. Yamamoto, T. Shibata, M. Ohta, M. Yasumoto, K. Nishida, A. Hatayama, S. Mattei, J. Lettry, K. Sawada and U. Fantz, Rev. Sci. Instrum.85, 02B118 (2014).
[6] T. Shibata, S. Mattei, K. Nishida, A. Hatayama and J. Let-try, AIP Conf. Proc.1655, 020008 (2015).
David, E. Chaudet, D. Faircloth, U. Fantz, D.A. Fink, M. Garlasche, A. Grudiev, R. Guida, J. Hansen, M. Haase, A. Hatayama, A. Jones, I. Koszar, J.-B. Lallement, A.M. Lom-bardi, C. Machado, C. Mastrostefano, S. Mathot, S. Mattei, P. Moyret, D. Nisbet, K. Nishida, M. O’Neil, M. Paoluzzi, R. Scrivens, T. Shibata, D. Steyaert, N. Thaus and G. Voul-garakis, Rev. Sci. Instrum.87, 02B139 (2016).
[8] S. Mochizuki, S. Mattei, K. Nishida, A. Hatayama and J. Lettry, Rev. Sci. Instrum.87, 02B108 (2016).
[9] K. Yee, IEEE Trans. Antennas Propag. 14, 302 (1966) ISSN 0018-926X.
[10] K. Nanbu, IEEE Trans. Plasma Sci.28, 971 (2000). [11] R. Courant, K. Friedrichs and H. Lewy, Math. Ann.100, 32
(1928).
[12] V.E. Golant, A. Zhilinskii and S.A. Sakhavov, Fundamen-tals of Plasma Physics(Wiley, New York, 1977).
[13] P.T. Greenland and D. Reiter, Juelich Report No. JUEL-3528 (1996).