39
Dr. Bernadette D’silva
Director, K.G. Mittal Institute of Management, I.T & Research, Malad (West), Mumbai-64,
Email: [email protected]
Mrs. Annie Beena Joseph
Associate Professor, K.G. Mittal Institute of Management, I.T & Research, Malad (West), Mumbai-64, Email: [email protected]
ABSTRACT
Corporate Restructuring has become a major component in the financial and economic environment all over the world. It is the process of redesigning one or more aspects of a company. The process of reorganizing a company may be implemented due to a number of different factors, like positioning the company to be more competitive, survive a currently adverse economic climate, or poise the corporation to move in an entirely new direction and many more. Corporate restructuring is needed to counter challenges in competitive business environment. Most of the organizations carry out corporate restructuring as per the needs of the business. Some do it through mergers, acquisitions, and some by demergers as well; while some others make structural changes and carry out resource optimization in the organization. This paper analyses the success rate of corporate restructuring program (CRP) in India. It also tries to understand the implication of corporate restructuring program with the help of a case study. The present paper is mainly based on secondary data. The paper makes use of SPSS 16 and MS-excel for data Analysis
Keywords: Corporate Restructuring, Challenges, Merger, Demerger
INTRODUCTION
Corporate restructuring is a multifarious phenomenon that management has to deal with. Every company has to choose either to diversify or to refocus on core business activities. Diversifying in simple terms is expansion of business domains while refocus is a deliberate attempt made by companies to become more alert on core business activities. From this point of view, corporate restructuring is thoughtful reduction followed by diversification. Corporate restructuring is an experience in itself which requires one or more of the following:
Pattern of ownership and control Composition of liability
40
realignment of assets and liabilities of the organisation through conscious management action to improves future cash flow stream and make more profitable and efficient. LITERATURE REVIEW
Laura Horn (2012) have emphasized on the essentially political nature of corporate governance regulation and argues that the transformation of corporate governance regulation is part of a broader political project of economic restructuring and market-making in the EU and illustrated that how company law has become increasingly focused on the rights of shareholders, while worker rights have been relegated to the area of social policies and labor law. Desai; Klock; & Mansi (2011) have examined the role played by the parent's motive in undertaking a carve-out and found that the post-IPO parent ownership significantly affects the acquisition likelihood and the level of acquisition premium. Zahid & Shah (2011) have stated that businesses from developing countries have started to buy out businesses of developed countries as their economies are doing better compared to the developed world due to low cost of production. Indian and Chinese businessmen are the most aggressive compared to rest in this regard. Owolabi & Dada (2011) has examined the role, nature, composition, objectives and functions of an effective audit committee in achieving reliable corporate governance and suggested that the recent business and governance failures demonstrated that a great step in corporate governance restructuring is a must.
RESEARCH METHODOLOGY
Research Objectives
To determine the success rate of corporate restructuring programme To ascertain the implications of corporate restructuring programme
Data Collection and Sample Size: The sample size comprises of 9 major companies which went through the process of corporate restructuring during the period 2000-2010. The sample composition is as follows:
1. Hindustan Unilever 2. Mahindra Satyam 3. Wokhardt 4. ITC 5. GSK
41
Research Design: The paper makes use of SPSS 16 and MS-excel for data Analysis. Mean, standard deviation and Students’ test have been used as tools of analysis for evaluating the financial performance of firms.
DATA ANALYSIS
A. Success Rates
H(0)1: There is no significant difference in pre and post profitability margins in companies which went for restructuring for the selected period
H(1)1: There is a significant difference in pre and post profitability margins in companies which went for restructuring for the selected period
Table (1): Paired Samples Statistics
Mean N Std. Deviation Std. Error Mean
Pair 1 Pre_year3 9.6244 9 9.20107 3.06702
Post_year1 12.9644 9 7.83658 2.61219
Data Interpretation: Table (1) shows the descriptive statistics of the corporate restructuring process for the nine companies and the profitability margins are taken for the immediate years of corporate restructuring i.e. immediate preceding year and immediate consecutive year (Pre year 3& Post year 1). Thus the mean profitability scores for Pre year 3& Post year 1 is 9.6 &12.9 respectively which indicates a high difference due to the corporate restructuring process.
Table (2): Paired Samples Correlations
N Correlation Sig. Pair 1 Pre_year3 & Post_year1 9 .859 .003
Data Interpretation: Table (2) describes about the correlations between the variables and it has been found that the R stands at 0.859 at 90% confidence levels and is highly significant since the p value is 0.003 is quite lesser than 0.1. Thus there is very strong correlation between the pair.
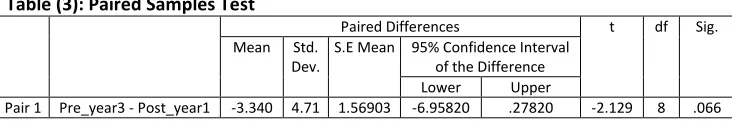
Table (3): Paired Samples Test
Paired Differences t df Sig. Mean Std.
Dev.
S.E Mean 95% Confidence Interval of the Difference Lower Upper
Pair 1 Pre_year3 - Post_year1 -3.340 4.71 1.56903 -6.95820 .27820 -2.129 8 .066
42
firms for the above period. Further analysis of the data reveals that the T statistics is -2.129 with significant level of 0.066 which is quite lesser than 0.1 at 90% confidence levels. Thus it can be concluded that definitely the corporate restructuring process has brought significant difference in the profitability margins of selected companies. It was further analyzed that the change brought by the process was quite positive and it increased the profitability margins for most of the companies. Therefore we reject null hypotheses and accept alternative hypotheses that there is a significant difference in pre and post profitability margins in companies which went for restructuring for the selected period.
H(0)2: There is no significant difference in pre and post profitability margins in companies which went for restructuring for pre and post first years
H(1)2: There is no significant difference in pre and post profitability margins in companies which went for restructuring for pre and post first years
Table (4): Paired Samples Statistics
Mean N Std. Deviation Std. Error Mean Pair 1 Pre_year1 -83.0533 9 278.36795 92.78932
Post_year1 12.9644 9 7.83658 2.61219
Table (5): Paired Samples Correlations
N Correlation Sig. Pair 1 Pre_year1 & Post_year1 9 -.033 .934
Table (6): Paired Samples Test
Paired Differences t df Sig. (2-tailed) Mean SD Std. Error
Mean
95% Confidence Interval of the Difference Lower Upper
Pair 1 Pre_year1 - Post_year1 -96.01 278.73 92.91 -310.27 118.235 -1.033 8 .332
43
H(0)3: There is no significant difference in pre and post profitability margins in companies which went for restructuring for pre and post second years
H(1)3: There is significant difference in pre and post profitability margins in companies which went for restructuring for pre and post second years
Table (7): Paired Samples Statistics
Mean N Std. Deviation Std. Error Mean Pair 1 Pre_year2 9.1056 9 8.71151 2.90384
Post_year2 13.7222 9 7.53074 2.51025
Data Interpretation: Table (7) shows the descriptive statistics of the corporate restructuring process for the nine companies and the profitability margins are taken for the immediate years of corporate restructuring i.e. immediate preceding year and immediate consecutive year (Pre year 2& Post year 2). Thus the mean profitability scores for Pre year 2& Post year 2 is 9.1 &13.7 respectively which indicates a high difference due to the corporate restructuring process.
Table (8): Paired Samples Correlations
N Correlation Sig. Pair 1 Pre_year2 & Post_year2 9 .775 .014
Data Interpretation: Table (8) describes about the correlations between the variables and it has been found that the R stands at 0.775 at 95% confidence levels and is highly significant since the p value is 0.014 is quite lesser than 0.05. Thus there is very strong correlation between the pair.
Table (9): Paired Samples Test
Paired Differences t df Sig. Mean SD Std. Error
Mean
95% Confidence Interval of the Difference Lower Upper
Pair 1 Pre_year2 - Post_year2 -4.61 5.55 1.85 -8.89 -.34309 -2.49 8 .037
44
and post profitability margins in companies which went for restructuring for pre and post second years
H(0)4: There is no significant difference in pre and post profitability margins in companies which went for restructuring for pre and post third years
H(1)4: There is significant difference in pre and post profitability margins in companies which went for restructuring for pre and post third year
Table (10): Paired Samples Statistics
Mean N Std. Deviation Std. Error Mean Pair 1 Pre_year3 9.6244 9 9.20107 3.06702
Post_year3 13.5544 9 9.05731 3.01910
Data Interpretation: Table (10) shows the descriptive statistics of the corporate restructuring process for the nine companies and the profitability margins are taken for the immediate years of corporate restructuring i.e. immediate preceding year and immediate consecutive year (Pre year 3 & Post year 3). Thus the mean profitability scores for Pre year 3& Post year 3 is 9.6 &13.5 respectively which indicates a high difference due to the corporate restructuring process.
Table (11): Paired Samples Correlations
N Correlation Sig. Pair 1 Pre_year3 & Post_year3 9 .860 .003
Data Interpretation: Table (11) describes about the correlations between the variables and it has been found that the R stands at 0.860 at 95% confidence levels and is highly significant since the p value is 0.003 is quite lesser than 0.05. Thus there is very strong correlation between the pair.
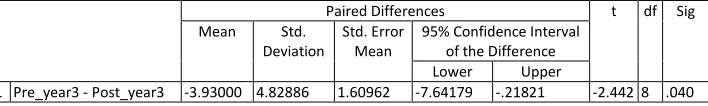
Table (12): Paired Samples Test
Paired Differences t df Sig Mean Std.
Deviation
Std. Error Mean
95% Confidence Interval of the Difference Lower Upper
Pair 1 Pre_year3 - Post_year3 -3.93000 4.82886 1.60962 -7.64179 -.21821 -2.442 8 .040
45
further analyzed that the change brought by the process was quite positive and it increased the profitability margins for most of the companies. Therefore we reject null hypotheses and accept alternative hypotheses that there is significant difference in pre and post profitability margins in companies which went for restructuring for pre and post third years.
B. CASE STUDY
CORPORATE RESTRUCTURING AT ARVIND MILLS
The case provides an overview of the Arvind Mills’ expansion strategy, which resulted in the company’s poor financial health in the late 1990s. In the mid 1990s, Arvind Mills’ undertook a massive expansion of its denim capacity in spite of the fact that other cotton fabrics were slowly replacing the demand for denim. The expansion plan was funded by loans from both Indian and overseas financial institutions. With the demand for denim slowing down, Arvind Mills found it difficult to repay the loans, and thus the interest burden on the loans shot up. In the late 1990s, Arvind Mills ran into deep financial problems because of its debt burden. As a result, it incurred huge losses in the late 1990s. The case also discusses in detail the Arvind Mills debt-restructuring plan for the long-term debts being taken up in February 2001.
ISSUES
Debt driven expansion plan, financial restructuring of Arvind Mills
KEYCONCERN
Global recession will dampen the demands.
Depends highly on the movement of cotton and denim price.
INTRODUCTION
In the early 1990s, Arvind Mills initiated massive expansion of its denim capacity. By the late 1990s, Arvind Mills was the third largest manufacturer of denim in the world, with a capacity of 120 million meters.
46
As the denim business continued to decline in the late 1990s and early 2000, Arvind Mills defaulted on interest payments on every loan, debt burden kept on increasing. In 2000, the company had a total debt of Rs 27 billion, of which 9.29 billion was owed to overseas lenders.
In 2000, Arvind Mills, once the darling of the bourses was in deep trouble. Its share price was hovering between a 52 week high of Rs 20 and low of Rs 9 (in the mid 1990s, the share price was closer to Rs 150). Leading financial analysts no longer tracked the Arvind Mills scrip.
The company’s credit rating had also come down. CRISIL downgraded it to “default” in October 2000 from “highest safety” in 1997. In early 2001, Arvind Mills announced a restructuring proposal to improve its financial health and reduce its debt burden. The proposal was born out of several meetings and negotiations between the company and a steering committee of lenders. As a result of the restructuring plan the interest burden came down substantially and got Arvind Mills the distinction of becoming the first Indian corporate to restructure its entire debt in a single go. Also, post restructuring, Arvind has reported a profit of Rs. 10 crore for the first quarter of the financial year 2002, after a gap of three years. The sheer instinct of Sanjay to survive in the business coupled with some bold and frank decisions had enabled Arvind Mills to come out of its problems and stand again on its feet.
FINDINGS
1. By late 1990s, Arvind Mills was in deep financial trouble because of its increasing debt and interest burden.
2. Its total long-term debt was estimated at Rs 27 billion, out of which the total overseas debt was Rs 9.29 billion and debt to Indian institutional lenders was Rs 17.71 billion.
3. Arvind Mills had defaulted on interest payments on every loan.
4. ICICI was the largest Indian institutional lender, with a loan of over Rs 5 billion to Arvind Mills. In 2000, the company reported a net loss of Rs 3.16 billion against a profit of Rs .14 billion in 1999.
Solutions
1. In February 2001, Arvind Mills announced a debt restructuring
47
3. In mid-2001, Arvind Mills got the approval of a majority of the lenders for its debt restructuring scheme. Forty-three out of fifty-four lenders approved the plan. 4. Some of the banks agreed to the buyback at a 55% discount on the principal
amount, while some agreed to a five year rollover for which they would be entitled to interest plus the principal. Some banks also agreed to a ten year rollover for which they would be paid a higher rate of interest plus principal. The debt revamp was expected to reduce Arvind Mills’ interest burden by 50%.
Arvind Mills board Debts restructuring plan
Company has drawn major restructuring plan, which involves: 1. Entry into industrial or performance fabric.
2. Focus on growing the existing brands and retail vertical. 3. Unlocking value from the real estate.
4. De-leveraging of the balance sheet. 5. Outsourcing of non-core activity. FINDING OF RESEARCH
Most of the company’s profitability margins are affected after corporate restructuring.
Companies mostly increase their profitability margin after their corporate restructuring.
LIMITATIONS
The study is done on the basis of secondary data.
There is enough scope to identify more Indian companies which have done Corporate Restructuring at different time periods and hence can arrive at a more authentic conclusion.
CONCLUSION
48
processes for achieving success in terms of profile and also for enhancing shareholders value.
REFERENCES
Chintal A. Desai; Mark S. Klock; Sattar A. Mansi (2011), On the Acquisition of Equity carve-outs, Journal of Banking & Finance, Vol.: 35, No.: 12, December 2011, pp. 3432-3449
Laura Horn (2012), Corporate Governance in Crisis? The Politics of EU Corporate Governance Regulation, European Law Journal, Vol.18, No. 1, Jan 2012, pp. 83-107
Nauman Zahid; Asif Mujtaba Shah (2011), Mergers and Acquisitions in International Business, European Scientific Journal, Vol.: 22, August 2011, pp. 43