*Corresponding author: [email protected] 2018 UTHM Publisher. All right reserved.
e-ISSN: 2600-7924/penerbit.uthm.edu.my/ojs/index.php/jst
Multidimensional Minimal Spanning Tree: The Bursa Malaysia
Lim San Yee
*, Rohayu Mohd Salleh and Norhaidah Mohd Asrah
*Faculty of Applied Sciences and Technology, Universiti Tun Hussein Onn Malaysia, 86400 Pagoh, Johor, Malaysia.
Received 30 September 2017; accepted 30 May 2018; available online 1 August 2018
1. Introduction
Today, the stock market is one of the world's largest markets where every company uses the stock market as a conduit to raise the funds or capital for running the company. A stock market is a place where all the transactions of stocks are being processed among the brokers and traders with the availability of the advanced technologies while the stock speaks to a claim on part of the company's assets or earnings. Each country has their own particular stock market, which namely stock exchange. For instance, New York Stock Exchange and NASDAQ Stock Exchange are the stock markets available in the United States of America. The New York Stock Exchange is the largest stock exchange in the world with the market capitalization of close to $20 trillion followed by NASDAQ Stock Exchange with the $7 trillion in the market capitalization. In Malaysia, the stock market is known as Bursa Malaysia with the market capitalization of $5.69 billion.
The stocks are represented as multivariate time series due to each stock is denoted by four prices such as opening price, highest price, lowest price and closing price (OHLC prices). Each price plays a different role in the stock market. For example, the highest price is the
highest trading price at which a stock traded during the course of the day whereas lowest price is the lowest trading price of the day. As remarked in [1], the OHLC prices are considered as geometric Brownian motion (GBM) process as the stock price follows the random walk pattern and is technically known as Markov process. The stock price is the cost of purchasing the stock on an exchange as well as the impression of the corresponding corporation’s situation. The stock price can be influenced by various issues such as the volatility in the market, current financial conditions and the fame of the corporation. The authors in [2] expressed that the arrangement of the stock market is ceaselessly developing through different heterogeneous associations between them. Moreover, the stock prices keep changing from minute to minute during the transaction hours and the interrelationships among the stocks are complicated, thus, it can be said that the stock market makes up a complex system.
Since the stock is considered as a multivariate time series of its OHLC prices, thus it is necessary to compute the analysis by using multivariate time series rather than univariate. If the analysis conducted by using the single variable, there is some possibility of losing the embodying information from other
Abstract: The stock market has constituted a complex system since the interrelationships among the stocks
are complicated and unpredictable. Moreover, the stock price does not stagnate at a certain price all the time but the price keeps changing from minute to minute during the transaction hours. Thus, it is quite difficult to indicate which stock influences the performances of other stocks as well as the behaviours of the stocks in a network. The economic information might be misleading and incomplete if the analysis applies with univariate time series of stock price only as each stock is represented by four features of the price. To obtain the complete information of the Bursa Malaysia stock network as well as the interrelationships among the stocks, multivariate time series of stocks are measured by using RV coefficient. Besides, minimum spanning tree and centrality measures are applied in this paper in order to construct the stock network virtually and determine the behaviours of the stocks by using the recent data of top 100 stocks in Bursa Malaysia.
Keyword: Bursa Malaysia; Centrality Measures; Minimum Spanning Tree; Multidimensional Stock
Analysis; RV Coefficient.
137 variables [3] due to the information extracts
from single variable is incomplete and unreliable. Besides, the authors in [4] asserted that more information will be provided by using four prices than using only closing price in the analysis. By using multivariate approach, the phenomenon of social embeddedness can be detected but fail to detect by univariate approach [5]. Therefore, in this case, RV (Random Vector) coefficient as introduced by [6,7] is applied since RV coefficient is a theoretical tool to analyze multivariate techniques [8]. RV coefficient is a multivariate generalization of PCC (Pearson Correlation Coefficient) and used to measure the linear relationship of two stocks where each stock is represented by OHLC prices [7]. There are some researchers applied the RV coefficient in the stock market analysis as can be seen in [1,2,9].
In order to obtain the embodying economic information from the stock market analysis, many researchers have risen up to investigate in this area. There are various approaches being used in filtering the information from the stock network structure such as minimum spanning tree (MST) [1-2,10-11], planar maximally filtered graph [12-13], average linkage-based MSTs [14] and Directed Bubble Hierarchical Tree [15]. MST is the simplest and well-known method for filtering the information that contained in the stock network structure among these approaches. MST is a tree where the sum of the weights of its edges is minimum. MST not only able to filter the information from a complex system but it also able to explain the physical correlation between the topological structure and economic classification of the stocks [9]. Moreover, MST has been widely used in various fields of studies such as in finance [16,17]; manufacturing industry [18]; transportation [19], sociology [20] and politics [21]. There are three common algorithms that can be applied in obtaining the MST such as Kruskal algorithm [22], Prim’s algorithm [23] and forest of all possible MSTs [9]. To interpret the important information contained in the MST, centrality measures such as degree, betweenness, closeness, eigenvector and overall centrality are applied.
In this paper, top 100 companies listed on Bursa Malaysia with the period of investigation from January 4, 2016, until August 15, 2017, choose to obtain the complete economic information about the Bursa Malaysia as well as
the interrelationships among the stocks. Besides, MST and centrality measures are used to construct the stock network virtually and determine the behaviours of the stocks in the network. The rest of the paper is arranged as follows. The next section briefly discusses the methodology of the analysis and section 3 presents the results and discussions. Later on, the conclusions of the study are summarized and highlighted at the end of the paper.
2. Methodology
Assume N stocks are to be examined in a given portfolio. Let p ti( ,1) , p ti( , 2) p ti( , 3) and p ti( , 4) are the opening, highest, lowest and closing prices for stock i where i = 1, 2, …,
N, respectively. Daily data is applied in order to quantify synchronization between the stocks. The correlation function between a pair of stocks is defined as
( , ) ln ( 1, ) ln ( , )
i i i
r t m p t m p t m (1)
where the daily logarithmic of the m-th price returns of stock i at time t where m = 1, 2, 3, 4 which represent the O, H, L and C prices.
Since each stock is denoted by its four prices, RV coefficient is applied in order to measure the similarity of stock i and j. Let
( , ) ( ) ( ) ( ) ( )
ij i j i j
s m l r m r l r m r l where
( ) i
r m is the average of ( , )r t mi for all t. The ( , )
ij
s m l is the covariance between the m-th log
price return of stock i and l-th log price return of stock j with m, l = 1, 2, 3, 4. Nevertheless,
( , ) ii
s m m is the variance of the m-th log price
return of stock i. Covariance matrix which including all the OHLC prices of stock i can be represented by the matrix Siiof size (4 x 4) whereSii consists of s m lii( , ) as its element at the m-th row and l-th column. However, Sij is
138
2 2
( )
( ) ( )
ij ji ij
ii jj
Tr S S RV
Tr S Tr S
(2)
where Tr(*) is the trace operator (sum of all diagonal elements) on a square matrix *.
This coefficient has fulfilled the following properties;
(i) It is symmetric, i.e. Sji SijT for all
i and j.
(ii) The range of the RV value lies between 0 and 1. It equals 0 if and only if each price of stock i and all prices of stock j are uncorrelated. It is equal to 1 if and only if the
eigensystem of Sii is equal to the eigensystem of Sjj except for all
zero eigenvalues.
(iii) If stock i and j are characterized by their closing price only, then
2 ij ij
RV c , where cij2 is the square of PCC between those two stocks. (iv) If stock i is characterized by its
closing price only and stock j is represented by OHLC prices, then
2
1
2 ij ij
RV R where Rij2 is the
R-squared when the closing price of stock i with respect to all OHLC prices of stock j is regressed. Based on these properties, it shows that RV coefficient is a multivariate generalization of PCC.
According to the properties of RV (i) to (iv), similarities among N stocks are being quantified and numerically summarized in a vector correlation matrix V of size (N x N) with
ij
RV as the element of i-th row and j-th column.
In order to examine the network, [24] recommended to transform the vector correlation matrix into a distance matrix by using the function of
2(1 )
ij RVij
(3)
where the function that satisfies all the axioms of distance as remarked in [2]. The distance matrix D(ij)of size (N x N) denotes the distance network of stocks in the multivariate
setting and the information contains in Dcan be filtered by MST to comprehend and envision the topological structure of the stocks in the market.
2.1 Minimum spanning tree
MST is a concept in graph theory and it turns into the crucial tool in stock network analysis to filter the most imperative information [11]. MST lessens the information space from
( 1) / 2
N N to (N-1) linkages which namely tree “edges” while holding the important features of the system [25]. Thus, MST is a tree where the sum of the weights of its edges is no larger than the weight of any other tree. There are three common algorithms can be used in constructing the connected weighted graph of stocks such as Kruskal's algorithm, Prim's algorithm and forest of all possible MSTs. In this paper, the forest of all possible MSTs is applied.
Forest of all possible MSTs is considered as one of the outstanding algorithms in filtering the most imperative information which contained in the stock networks as remarked in [9]. If one works in view of MST, there may exist different possible network topologies but if one works with the Forest, there just exists a single network topology. If and only if the sum of all elements of the adjacency matrix, equal to 2(n1), then the MST is considered as unique. There are few steps to construct the forest of all possible MSTs;
Step 1: Let k = 2,
Step 2: Compute D*k, where D D* *(k1) is a matrix multiplication in the usual sense but multiplication and
summation of two real numbers a and b are defined as max{a,b} and min{a,b} respectively.
Step 3: If D*k D*(k1), then SDU of D is
*k
D and proceed to Step 4. Otherwise, let k = k + 1 and then return to Step 2.
Step 4: Compute
which defined as following:( , )
1; ( , ) ( , ) 0
0; ( , ) ( , ) 0
i j
d i j d i j and i j
d i j d i j or i j
139 Further details about the forest of all possible
MSTs can be referred in [9]. Once the MST produces by the forest of all possible MSTs is not unique and robust, then it is necessary to construct the MST by using either Prim’s algorithm or Kruskal’s algorithm for comparing the results purpose.
2.2 Data
This paper attempts to analyze top 100 companies traded in Bursa Malaysia. However, due to the availability of data in the time period of investigation, there are only 89 stocks to be analyzed. The daily data of the OHLC prices of 89 stocks traded on Bursa Malaysia main market from January 1, 2016, until August 15, 2017 are collected.
2.3 Centrality measures
As mentioned in [2], centrality measure is known as a basic concept in the network analysis where it gives pertinent information with respect to the importance of stocks. There are four standard approaches of centrality measures to be used in the paper which are,
(i) Degree centrality
Degree centrality indicates the quantity of associations a stock has in the network. Degree centrality of stock i is
1 n
ij j
d
where ij 1 if i-th and j-thstocks are linked and 0 otherwise.
(ii) Betweenness centrality
Betweenness centrality indicates the capability of a stock to affect the other
stocks which define as
,
ijk k i j
ij
g b
g
where gij is the shortest path from
stock i to stock j and gijk is the shortest
path from i to j that passes through k.
(iii) Closeness centrality
Closeness centrality measures how close a stock is to all other stocks in terms of correlations. Closeness
centrality of stock i, i ij j
c
d whereij
d is the number of links in the path
from stock i to stock j for all ji.
(iv) Eigenvector centrality
Eigenvector centrality figures out which stock is the most vital stock in a network. Eigenvector centrality is also known as a variant of simple degree
which is defined as i 1 ij j j
e
a ewhere
is a constant eigenvalue andi
e is the centrality of stock i.
The use of these four standard approaches of centrality measures can be seen in many papers [26-29].
These four centrality measures interpret the results differently due to each centrality measure plays the diverse functions in explaining the topological structure of the stocks. Therefore, so as to indicate the overall role of each stock, it is important to define an overall centrality. Overall centrality is defined by the Principal Component Analysis (PCA) of the data matrix of size N x p where the p
represents the score of degree, betweenness, closeness and eigenvector centralities, respectively. The score of stock i in terms of overall centrality measure is defined by
1 ( ) 2 ( ) 3 ( ) 4 ( )
i D B C E
O e C i e C i e C i e C i (5) where e( ,e e e e1 2, 3, 4)t is the eigenvector of
covariance matrix S from the matrix of size N x
p and these eigenvectors are associated with the largest eigenvalue [27,29].
3. Results and Discussions
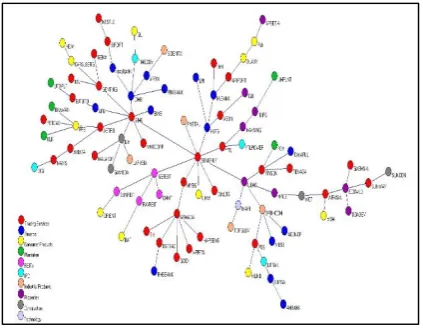
red-140
violet), construction (gray) and technology
(light purple). Each stock is labeled by its ticker
symbol such as Scientex Berhad as SCIENTX. The sum of all elements of the adjacency matrix, is 176 which is equal to 2(89-1) = 176. Therefore, it can be said that the MST obtained from the forest of all possible MSTs is unique and robust. There is unnecessary to plot another MST by using either Prim’s algorithm or Kruskal’s algorithm due to there is one and only one MST exists in the analysis.
Fig. 1 Forest of Bursa Malaysia analysis
According to Fig. 1, it can be seen that the stocks are grouped into five clusters where each cluster is dominated by SENERGY, SIME, ARMADA, CIMB, and UEMS respectively. These stocks have the highest number of connections to the other stocks in the network. Among these five stocks, SENERGY has the highest number of links with the other stocks followed by SIME. Surprisingly, 3 out of 5 stocks are categorized under the trading and services sector, UEMS is under the properties sector and CIMB is under the finance sector. Each stock not just connects to its own particular sector of stocks yet links with other sectors of stocks. For example, other than the trading and service sector of stocks, SENERGY still connects to the stocks under industrial products, consumer products, finance and real estate investment trusts sectors. This indicates that there exists the interrelationship between sector and sector in the stock market and this might due to these stocks share the same economic information as each other in the network. There are 3 stocks only connect with SENERGY such as PMETAL, UMW, and DIALOG. This demonstrates that these stocks
prices will only affect by the SENERGY price. The rest of the stocks are then branching out into two or more branches in the network.
PMETAL is the farthest stock while
SIME is the closest stock to the SENERGY
among the stocks that connect with it. This
means that SENERGY and SIME truly
have the closest relationship with each
other in the market. Besides, the stocks
which under the same parent company are
also linked together in the network such as
HLFG-HLBANK and YTL-YTLPOWER.
For SIME stock, SENERGY is also the
closest stock to it whereas BIMB is the
farthest stock from it. BIMB and
MMCCORP are the only two stocks that
link with SIME only. Other stocks branch
out into few branches in the network.
The telecommunication services such as ASTRO, AXIATA, MAXIS, and DIGI are connected and formed into a single line since these stocks provide the same area of services to the community. Hence, it is sure that these stocks connect to each other as these stocks share the same information and resources as one other.ARMADA is the top 3 highest number of connections of stock in the network. From the Fig. 1, it can be seen that ARMADA only connects to the trading and services sector of stocks and one of the branches which is BSTEAD has an association with RHBBANK. Other than ARMADA, CIMB also mostly connects with the financial sector of stocks except for SIME and TIMECOM. For the UEMS, it has 5 stocks connect with it and each stock has branched out to the few branches in the network. In this analysis, UEMS not only has an association with the same sector of stock but also has relationships with other sectors such as technology, trading and services as well as industrial products sectors.
141 network. In this MST, there are some stocks
only connect to a single stock. This indicates that the particular stock only has an association with the connected stock. As an example, NESTLE only connects with BIPORT in the network. Any changes on the BIPORT price will affect the NESTLE price directly.
Further explanations on the structural topological position of the stocks in the network can be referred to the centrality measures. Degree centrality determines the quantities of associations a stock has with the other stocks. In this study, SENERGY has the highest score in terms of degree centrality with 9 edges (0.0511) followed by SIME with 8 edges (0.0455) and ARMADA with 6 edges (0.0341). Stocks with most astounding scores in degree centrality could comprise of a huge amount of investments and considered as the best organizations in the market contrasted with the stocks with low scores. This is because of the most elevated scoring stocks have numerous associations with other stock and the higher quantity of connections of a stock, the more noteworthy the impact of that specific stock to other stocks. Thus, it can be said that SENERGY is the most important stock in Bursa Malaysia in terms of degree centrality.
Betweenness centrality is the sum of all possible shortest distance between any stocks that passing through a stock. Moreover, it is used to assess the control of a stock on the information flow in the network as stated in [30]. SENERGY is the highest scoring stock (0.6223) followed by SIME (0.4521) and UEMS (0.3528). This finding indicates that these three stocks especially SENERGY, give great impact on many stocks when the other stocks receive the information that passing through them. However, the stocks with lowest scores have less impact on other stocks in the network. Therefore, based on this measure, SENERGY plays an important role in Bursa Malaysia as a liaison that able to control the information among the stocks.
The key player in terms of closeness centrality is represented by SENERGY again with the score of 0.2909. It is then followed by the second highest with SIME (0.2664) and the third goes to UEMS (0.2528). From these findings, it can be said that SENERGY is the closest stock to other stocks and it consists of the excellent positions in the network that able to reach the other stocks rapidly in order to get the resources. The higher the closeness
centrality score, the quicker the information can be spread to the other stocks.
Eigenvector centrality measure is used to determine the strength and the significance of a stock with its associations in the network. The stock with the highest score of eigenvector centrality indicates that the stock consists of the relationships with other significant and important stocks in the network. SENERGY has the highest score (0.5243) followed by SIME (0.4444) and UEMS (0.2381). As a result, it can be noticed that SENERGY connects to the high-scoring stocks has contributed many scores to the stock network compared to the stocks which link to the low-scoring stocks.
In a nutshell, SENERGY and SIME have appeared four times in the four standard approaches of centrality measures while UEMS appeared three times. Hence, it can be inferred that these stocks are the vital stocks in Bursa Malaysia.
It is necessary to determine the most important stocks with overall characteristics in the network due to each centrality measure has the different function in interpreting the behaviours of the stock market. Therefore, overall centrality measure is applied in this paper. Overall centrality is an optimal linear combination of the four standard centrality measures where the optimality criterion is regarding the principal component analysis (PCA) on data matrix of size 89 x 4 representing the 89 stocks and their scores in the four centrality measures.
142
4. Concluding Remarks
By applying the multivariate time series in the analysis, the economic information obtained is truly embodying and reliable compared to the analysis done by using univariate time series which can be supported by [1-3,27]. The behavior of every stock can be visualized clearly through the MST constructed by the forest of all possible MSTs. In this paper, it is quite surprising that SENERGY found out to be the most important stock in Bursa Malaysia within the period of investigation. With this finding, it may conclude that the recent stock market is mainly dominated by the trading and services sector as the two most important stocks are categorized under this sector.
As presented in [33], trading and services sector always the largest shares traded on the Main Market in Bursa Malaysia. It might due to the trading and services industry is getting better year by year in Malaysia. It is supported by many trading and services companies rose up recently. On the other hand, SENERGY is considered as the bellwether of the Malaysian Oil & Gas sector. Its sheer size as a service provider and engineering company has taken up a number of great projects in the industry of oil and gas as well as engineering in Malaysia just as stated in [34]. This might the reason why SENERGY mainly dominates the market because of the company able to provide services in the two largest fields such as oil and gas and engineering which has given main focus in Malaysia recently. Therefore, it is recommended that Malaysia should put many efforts on the trading and services sector just to increase the stock value to a higher level in the market. Moreover, this sector might be the steppingstone for Malaysia in achieving the developed economy country by 2020.
Acknowledgements
We would like to thank Universiti Tun Hussein Onn Malaysia for providing the research grant of GPPS with vote number U810.
References
[1] Gan, S.L. & Djauhari, M.A. (2013). “Multidimensional Stock Network Analysis: An Escoufier’s RV Coefficient Approach” in ICMSS, Vol. 1577. pp. 550-555.
[2] Kazemilari, M. & Djauhari, M.A. (2015). “Correlation Network Analysis for Multi-Dimensional Data in Stocks Market” in
Physica A, Vol. 429. pp. 62-75.
[3] Brida, J.G. & Risso, W.A. (2009). “Multidimensional Minimal Spanning Tree: The Dow Jones Case” in Physica A, Vol. 287. pp. 5205-5210.
[4] Yamashita, Y. & Yodahisa, H. (2012). “Similarity Measure and Clustering Algorithm for Candlestick Valued Data”
in Joint Meeting of Japanese and Italian
Classification Societies (JCS-CLADAG).
[5] Halinen, A. & Tornroos, J. (1998). “The Role of Embeddedness in the Evolution of Business Networks” in Scandinavian
Journal of Management, Vol. 14. No. 3 pp.
187-205.
[6] Escoufier, Y. (1973). “Le Traitement Des Variables Vectorielles” in Biometrics, Vol. 29. No. 4 pp. 751-760.
[7] Robert, P. & Escoufier, Y. (1976). “A Unifying Tool for Linear Multivariate Statistical Methods: The RV-Coefficient”
in Journal of the Royal Statistical Society
Series C, Vol. 25. No. 3 pp. 257-265.
[8] Abdi, H. (2007). “RV Coefficient and Congruence Coefficient” in Encyclopedia
of Measurement and Statistics, pp.
849-853.
[9] Djauhari, M.A. (2012). “A Robust Filter in Stock Network Analysis” in Physica A, Vol. 391. pp. 5049-5057.
[10] Djauhari, M.A. & Gan, S.L. (2015). “Optimality Problem of Network Topology in Stocks Market Analysis” in
Physica A, Vol. 419 pp. 62-75.
[11] Sharif, S. & Djauhari, M.A. (2016).
Minimal Spanning Tree and Centrality Measures. Scientific Investigation on
Univariate Quantitative Methods, First
Edition, UUM Press, Sintok, Kedah, Malaysia.
[12] Tumminello, M., Aste, T., Di Matteo, T. & Mantegna, R.N. (2005). “A Tool for Filtering Information in Complex Systems” in Applied Physical Sciences, Vol. 102 pp. 10421-10426.
[13] Aste, T., Di Matteo, T. & Hyde, S.T. (2005). “Complex Networks on Hyperbolic Surfaces” in Physica A, Vol. 346 pp. 20-26.
143 Estimation in Correlation Based
Networks” in Int. J. Bifurcation Chaos, Vol. 17, pp.2319.
[15] Musmeci, N., Aste, T. & Di Matteo, T. (2015). “Relation Between Financial Market Structure and the Real Economy: Comparison Between Clustering Methods” in PLOS One, Vol. 10 pp. 1-31. [16] Wang, G.J., Xie, C., Han, F. & Sun, B. (2012). “Similarity Measure and Topology Evolution of Foreign Exchange Markets using Dynamic Time Warping Method: Evidence from Minimal Spanning Tree” in
Physica A, Vol. 391. No. 16 pp.
4136-4146.
[17] Sharif, S. & Djauhari, M.A. (2012). “A Centrality Measure in Currency Exchange Rate” in Discovering Mathematics, Vol. 34. No. 2 pp. 1-6.
[18] Sharif, S., Djauhari, M.A. & Djauhari, H. (2012). “Worker’s Behaviour in Manufacturing Industry: an Evidence from a Minimum Spanning Tree” in Malaysian
Journal of Fundamental Sciences, Vol. 8.
No. 1 pp. 9-14.
[19] Park, K. & Yilmaz, A. (2010). “A Social Network Analysis Approach to Analyse Road Networks” in ASPRS Annual
Conference, San Diego, CA.
[20] Krichel, T. & Bakkalbasi, N. (2006). “A Social Network Analysis of Research Collaboration in the Economics Community” in Informetrics and Scientometrics & Seventh COLLINET
Meeting, Vol. 12.
[21] Situngkir, H. & Surya, Y. (2004). “Hierarchical Taxonomy in Multi-Party System” in WPM, Bandung Fe Institute. [22] Joseph, B.K. (1956). “On the Shortest
Spanning Subtree of a Graph and the Traveling Salesman Problem” in
Proceedings of the American
Mathematical Society, Vol. 7. No. 1 pp.
48-50.
[23] Prim, R.C. (1957). “Shortest Connection Networks and Some Generalizations” in
Bell Syst. Tech. J., Vol. 36 pp.1389-1401.
[24] Mantegna, R.N. & Stanley, H.E. (2000). “An Introduction to Econophysics: Correlations and Complexity in Finance”
in Physics Today, Vol. 53. No. 12 pp.70.
[25] Mizuno, T., Takayasu, H. & Takayasu, M. (2005). “Correlation Networks Among Currencies” in Physica A, Vol. 364 pp. 336-342.
[26] Gan, S.L. & Djauhari, M.A. (2012). “Network Topology of Indonesian Stock Market” in Proceedings – ICCCSN, IEEE. [27] Djauhari, M.A. & Gan, S.L. (2014).
“Bursa Malaysia Stocks Market Analysis: A Review” in ASM Sci. J., Vol. 8. No. 2 pp. 150-158.
[28] Kazemilari, M. & Djauhari, M.A. (2013). “Analysis of a Correlation Network in World Currency Exchange Market” in Int.
J. of Applied Mathematics and Statistics,
Vol. 44. No.14 pp. 202-209.
[29] Asrah, N.M., Djauhari, M.A. & Ebi, S.S. (2014). “Work Attitude Among Malaysian Academics in the Public Universities: A Social Network Analysis” in Modern
Applied Science, Vol. 8. No. 5 pp. 9-18.
[30] Gan, S.L. & Djauhari, M.A. (2012). “An Overall Centrality Measure: the Case of U.S Stock Market” in International
Journal of Basic & Applied Sciences, Vol.
12. No. 6 pp.99-103.
[31] Jolliffe, I.T. (2002). Principal Component Analysis. Springer, New York.
[32] Minitab 18 Support (2017). Retrieved
fromhttps://support.minitab.com/en-us/
minitab/18/help-and-how-to/modeling- statistics/multivariate/how-to/principal- components/interpret-the-results/all-statistics-and-graphs/
[33] Malay Mail Online. (2017). Retrieved from http://www.themalaymailonline.com /money/article/bursa-malaysia-ends-firm-in-listless-trading#k4yK5DGfrrjp1S7S.97
[34] New Straits Times. (2017). Retrieved from