A New User Model based Interactive Product Retrieval
Process for improved eBuying
Oshadi Alahakoon Victoria University
Abstract
When searching for items online there are three common problems that e-buyers may encounter; null retrieval, retrieving unmanageable number of items, and retrieving unsatisfactory items. In the past information retrieval systems or recommender systems were used as solutions. With information retrieval systems, too rigorous filtering based on the user query to reduce unmanageable number of items result in either null retrieval or filtering out the items users prefer. Recommender systems on the other hand do not provide sufficient opportunity for users to communicate their needs. As a solution, this paper introduces a novel method combining a user model with an interactive product retrieval process. The new layered user model has the potential of being applied across multiple product and service domains and is able to adapt to changing user preferences. The new product retrieval algorithm is integrated with the user model and is able to successfully address null retrieval, retrieving unmanageable number of items, and retrieving unsatisfactory items. The process is demonstrated using a bench mark dataset and a case study. Finally the Product retrieval process is evaluated using a set of guidelines to illustrate its suitability to current eBuying environments.
Keywords: user modelling; e-commerce; customer analytics; personalization
1 Introduction
The Internet and smart phones have revolutionized the way we shop. During the past decade the number of online shoppers have grown drastically, where statistics states that 40 percent of worldwide internet users have bought products or goods online (Statistica 2014). However, for these buyers, navigating massive product bases to find the best suited products can be challenging. In the past either recommender systems or information retrieval systems were employed to facilitate online purchasing. Both these techniques have inherent limitations; the information retrieval systems use product attributes specified by the user as selection criteria which may result in too stringent filtering resulting in the problem of null retrieval. Recommender systems on the other hand do not provide the user with sufficient opportunity to express their needs but employ personalized retrievals based on past preferences. With the massive increase in the number of products and services available on line, with numerous variations and alternatives, the capturing of the user requirements has become very complex. At the same time the continuing huge increase in the online consumer population has resulted in more individuality being required to be expressed in eBuying. This environment has also resulted in more informed eBuyers who demand more and more customization. Therefore as a result of this increase in both products, services, their variations as well as massive and demanding population of eBuyers, the traditional limitations of the information retrieval systems and recommender systems have become significant problems.
The rest of the paper is structured as follows. Section 2 describes the background information on information retrieval systems and recommender systems while positioning the work presented. Section 3 describes the new product retrieval algorithm in detail using a benchmark dataset. Section 4 demonstrates the integrated product retrieval process and the value of the new user model with a comprehensive case study. A hypothetical user is introduced with a wide ranging set of requirements to enable the demonstration of various features, functionality and advantages of the new techniques. Section 5 evaluates combined user model and the product selection according to criteria critical to requirements of the current eBuyer’s needs. Finally, Section 6 provides a discussion and concluding remarks.
2 Background
2.1 Information Retrieval Systems vs Recommender Systems
In information retrieval, even powerful search engines such as google or yahoo still use one-size-fits-all strategy (Smyth, Coyle et al. 2011). Therefore there is ongoing research to improve the performance of these search engines. Most information retrieval systems employ two different retrieval techniques; filter based retrieval and similarity based retrieval. Filter based retrieval is carried out either using keyword search or using parametric search. Keyword search use keywords in item descriptions. Parametric search assigns values to product attributes as parameters where the user query is represented as a set of constraints on item descriptions. Generally the user is asked to fill in a form specifying values for product attributes. Then, a database query is formed where the query consists of features or feature ranges. However, both these methods narrow down the search space according to set constraints and has a high chance of null retrieval. Similarity based retrieval has its roots in Case Based Reasoning (CBR) (Burke 2002) and uses a similarity matrix. A similarity metric can be any function that takes two entities and returns a value reflecting their similarity with respect to a given goal. This results in less vocabulary mismatches and null retrievals. In product retrieval, forming and implementing a similarity metric is complicated, time consuming, and inefficient at runtime. However, similarity based filtering performs well in document retrieval due to comparison of words (Ahn, Brusilovsky et al. 2006).
A recommender system will use past preferences rather compared to the direct user requirement at the time of product search. Recommender systems mainly use two different techniques in recommender engines; either content based or collaborative techniques. There are systems which use pure collaborative recommendation techniques (Schafer, Frankowski et al. 2007) and ones that use pure content based techniques (Pazzani and Billsus 2007) while some use hybrid of these techniques (Burke 2007). In a few hybrid systems demographic techniques and cased based recommendation techniques were used combined with either collaborative or content based techniques.
Conversational recommender systems can be considered as a combination of these two types of systems. Notable work is presented in (Shearin and Lieberman 2001), (Mahmood and Ricci 2009) and (Thompson, Göker et al. 2002). These systems use a user model and also manipulate the user query to find suitable items. Our work relates to this group of recommender system since it uses a user model to enhance performance of a product retrieval algorithm.
The work described in this paper combines a user model with a product retrieval system. To address the limitations of traditional systems and accomplish the current needs our research has focused on the following:
x Design and implement a new user model architecture (LUM – Layered User Model) which can capture complex purchase behaviour.
2.2 The layered user model (LUM)
The LUM was first introduced in (Alahakoon, Loke et al. 2007). LUM allows modelling highly complex individual purchasing behaviour by capturing the elements which contribute to such behaviour: demographics, purchasing history and current requirements. Each element is stored as an information layer.
The three layers are as follows.
i. User’s personal information (Demographics) based general buying behaviour information (PI Layer – Personal Information Layer)
ii. User’s buying preferences in specific domains (DI Layer – Domain based Information Layer)
iii. User’s transaction based needs for each interaction (TI Layer – Transaction based Information Layer).
PI layer of the LUM is the first layer to create. When seeking personalization in a given domain the corresponding DI layer get generated based on the PI layer. Once the PI layer and the DI layers are available, user can start interacting with the system.
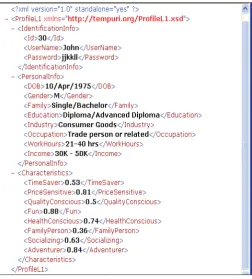
Since the slow changing demographics are used, PI layer becomes the most stable information layer as demographics depicts an individual’s ‘position and ability’. In addition to demographics, PI layer contains Personal Behaviour Characteristics (PBC values) (Alahakoon, Loke et al. 2007). PBC values, exhibit an individual’s general trends and abilities that are valid in any purchasing domain. In LUM PBC values are calculated combing demographics using Multi Attribute Utility Theory (MAUT) (Schafer 2001). A sample of PI layer is shown in Figure 1.
Figure 1: PI Layer
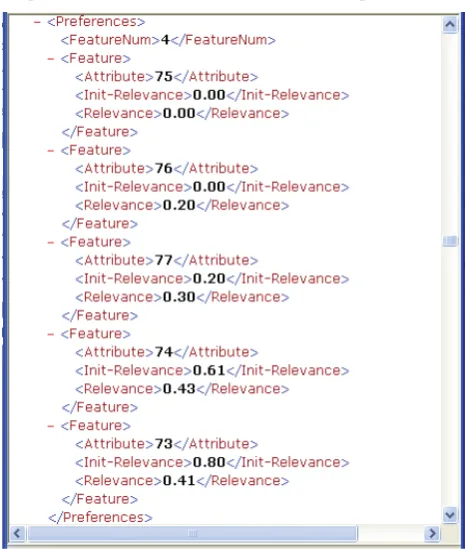
At the creation of a new DI layer, initial relevance values (Figure 2 “Init_Relevance”) are calculated using the PI layer and a matrix called Influence Matrix. “Relevance” is the updated current relevance of the attribute, after at least one transaction.
Some domain attributes are directly related to the information in the PI layer. Such attributes are called Personal Information Related attributes (PIR-attributes).
In the restaurants domain, some intuitions relating PI layer and domain attributes are;
i. A price sensitive person would be more influenced by restaurants with lower costs, A quality conscious and a socializing person would be more influenced by better décor.
Figure 2: A section of the DI layer
An Influence Matrix (IM) is a matrix which contains all such attributes along with their influence thresholds (Table 1). The weight gives the influence of the PBC value on the attribute. For example, the Feature ‘Cost’ has four continuous attributes which becomes relevant to users (with a weight of 1).
Feature
A
ttribute
Name
Price Sens
itivity
(P
S)
PS
w
eig
ht
Qual
ity
Consci
ous
n
es
s
(QC)
QC W
eig
ht
So
cial
is
in
g
(So)
So Weigh
t
Cost below $15 0.75-1 1 0 0 0 0
$15-$30 0.5-0.75 1 0 0 0 0
$30-$50 0.25-0.5 1 0 0 0 0
over $50 0- 0.25 1 0 0 0 0
Décor Fair Décor 0 0 0.15-0.35 0.5 0.15-0.35 0.5
Good Décor 0 0 0.35-0.55 0.5 0.35-0.55 0.5
Excellent
Décor 0 0 0.55-0.75 0.5 0.55-0.7 0.5
For a given feature if more than one attribute value becomes relevant to an individual, a fuzzy approach (Zadeh 1965) is employed. Following is an example showing how fuzzy membership functions are used in relevance value calculation.
Figure 3: Membership functions for cost attributes based on Price Sensitivity
Example: According to the membership functions in Figure 6, for a person with Price Sensitivity value 0.67, out of the four attributes in ‘cost’, three becomes relevant; “less than $15”, 0.68, “$15-$30”, 1 and “$30-$50”, 0.32. Since the user’s PS value is quite high (0.67), the highest price range is not relevant.
The last information layer (TI layer) captures the short term needs of the consumer. Information in the TI layer may not agree with the more general behaviour in the first layer or the expected domain centric behaviour in the DI layer. The reason being, users may deviate from their usual behaviour due to impulsive purchases caused by mood changes or unusual circumstances.
Figure 4 depicts the layers of information in the LUM architecture. Each time a user interacts in a new domain a DI layer for that domain gets created.
Figure 4: The user model with n-layers (the middle layer has sub layers)
All the DI layer components of the user model are attached to the PI layer of the user model. Since a domain can be a specific subject area of knowledge such as restaurants, footwear, real estate, etc., each category of products presented in a hierarchical taxonomy becomes a domain. Hence the domains in which users interact can be interconnected. In real life such categorization is observed in supermarket aisles.
purchasing behavior irrespective of a specific domain. Detailed descriptions of the LUM with details of its initial creation, information contents, calculations and updates are presented in (Alahakoon, Loke et al. 2007).
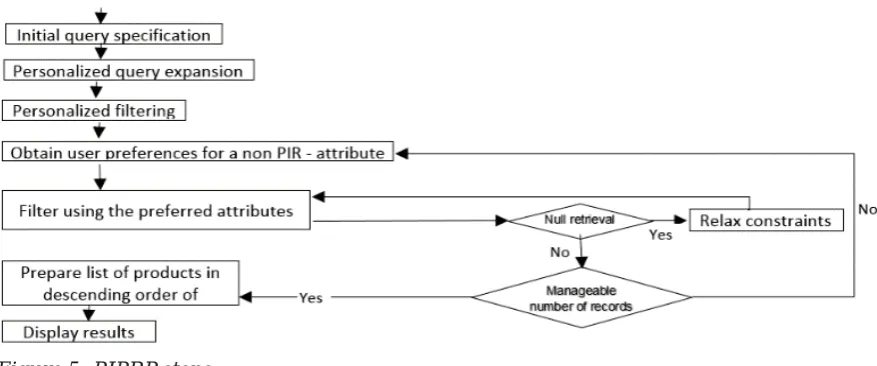
3 Personalized Interactive Product Retrieval Process – (PIPRP)
Figure 5 depicts PIPRP as a sequence of steps.Figure 5: PIPRP steps
Each step is described using an example of restaurant search.
Step 1: Personalized Initial Query Specification
The initial preference elicitation process provides the user with a flexible interface (Figure 6).
Figure 6: Screen – Users initial query selection
The products are categorized under features such as ‘Cuisine’ and within a feature, sub features such as ‘Italian’. Sub-features may have sub-sub features until the final layer consists of atomic attributes. This allows the user to specify his/her need to very detailed level of granularity, with the further possibility of selecting more than one value for a given feature (Italian and Indian).
Step 2: Personalized Query Expansion
x Use of similarity matrices to identify the items with similar attributes (as in Entrée (Burke 2001)).
x Inclusion of items preferred by like-minded users (user-user correlation – collaborative filtering (Resnick, Iacovou et al. 1994)).
x Inclusion of items similar to previous user preference (item-item correlation - as in (Thompson, Göker et al. 2002)).
However, as explained in (Burke 2001) two items maybe similar due to several different reasons where the underlying reason is not visible to the selection algorithm. If user-user correlation (Resnick, Iacovou et al. 1994) is used, two users may prefer the same item due to two different reasons (Towle and Quinn 2000). In (Thompson, Göker et al. 2002), all the attributes present in user’s preferred items (in the past) were included in the query. Although user preferred the item, it doesn’t mean s/he preferred each and every attribute.
In PIPRP, the idea of query expansion is not only to avoid null retrieval but also to include any possible items that may satisfy the user in the results set. Therefore, PIPRP does not look for similar items. Instead, if there are any other attributes (in the user model) that belongs to the same feature (as the selected one and has positive relevance values), such attributes are included in the query.
In the user model, a positive relevance value for an attribute may result due to one or both of the following reasons.
i. Initially allocated based on the user’s PBC values
ii. Updated due to implicit user preferences during past product selections.
For example, higher cost range can become highly relevant to a user due to one or both of the following;
i. If the PBC values describe the user as a not so price sensitive person
ii. Or if the user explicitly expressed preference for higher cost ranges during previous interactions
In the current query if the user selects the lower cost range as preferred value, still the higher range (from the user model) gets included in the personalized query expansion. This way PIPRP consider both user’s past preferences and his/her demographic preferences.
Step 3: Further Filtering Based on the User Model – Personalized Filtering
To further filter out the unwanted results, there are two important facts to consider. i. What is the next most important feature of the item to set a constraint on? ii. What is the preferred value for that feature?
Doyle and Cunningham (Doyle and Cunningham 2000) considered the information gain of a question to unobtrusively determine the next best attribute to ask. This method only focused on the least number of questions. If the user is asked to provide his/her preference for an unimportant feature, one of the following can happen.
x If the user answered the question and the records were filtered depending on the answer given, important records may be lost.
x If the user did not answer the question, then asking an unimportant question adds to the obtrusiveness of the system.
The PIR-attributes in the user model hold very important information to the user. Therefore, personalized filtering is carried out using the existing values of PIR-attributes in the corresponding DI layer of the user model. Since only the relevant PIR-attributes are to be considered as preferred or applicable to the user, ones that are with a greater than zero relevance are used in the filtering.
When personalized filtering is applied, nonzero PIR- attributes get added to the query in Step 2.
Step 4: Further Querying the User
To further filter the results set, the item features which were not constrained in the previous steps needs to be considered. This can be achieved by asking the preferred attributes values for such features from the user. However, as explained in the section under step 3, the most important item features need to be constrained first to avoid losing more suitable results. In LUM, most important attributes are identified by its average Total Relevance (ATR) value. The Average Total Relevance (ATR) of an item feature is the average of all relevance values of the attributes belonging to that feature. Since each feature can have varying number of attributes, average is considered.
Step 5: Calculate Similarity between the Query and the Items
After presenting all features with positive ATR values as questions, if a further unmanageable set of records exists, the system needs to filter out the less important items. For this purpose, a novel similarity measure (pertaining to the LUM) is used to rank the remaining list of items, and the first three items are displayed to the user.
The novel similarity measure takes following information into consideration. i. User preferences provided in the current query.
ii. User preferences provided during Step4. iii. User preferences available in the user model. The similarity calculation is described next.
Each item in the product base are represented as an n-long one dimensional array, (where n is the number of attributes used to describe the products in a given domain - Note all the products are described under the same set of attributes). Each element can assign either 1 or 0, indicating the existence (1) or absence (0) of each attribute. The user query is also represented in the same manner: each array element with ‘1’ indicating a preferred attribute. The similarity of an item to the user query is calculated based on the total relevance value of the attributes present in that item. Each attribute present in an item, contributes a sum of two relevance values to the total similarity as follows:
i. Relevance of an attribute, according to the current query.
x (Simiq) - If the given attribute is among the constraints provided with the initial
query (provided during Step 1) - assign a relevance value of r1.
x (Simpsp) - If the given attribute is among the user provided constraints during
the product selection process (provided during Step 4) – assign a relevance value of r2.
ii. (Simum) - If the current attribute has a relevance value in the user model DI layer –
obtain the actual relevance value from the DI layer.
The total similarity of an item I (
Tot
Sim
I ) which is described using n attributes to the user query
is given by;
Tot
Sim
I = [{Simiq(i) or Simpsp(i)} + Simum(i)]
Using the above formula
Tot
Sim
I is calculated for each item remaining in the result set.
4 Demonstration of the PIPRP Process
A benchmark dataset is used to demonstrate the process. The dataset (Asuncion and Newman 2007) which has been used in this work was intended to use as a knowledge base of a recommender system called Entrée (Burke 2002). The Entrée dataset contains descriptive information about restaurants in a number of cities in the USA. Data is available separately for each city and log files are available indicating user browsing sessions. Each restaurant is described under 256 attributes indicating the presence or absence of each attribute.
In our prototype implementation we modified the data according to our requirements. For example, the 256 attributes were grouped into 31 features (as ‘cost’, ‘décor’, etc) to form questions during the search. The experiments presented in this paper, are subject to the limitations of the datasets used. It is an obvious and known fact that the retrieval process greatly depends on the available data (the distribution of products in the search space). For example, if most of the available items belong to the same price range, then retrieving items belonging to other price ranges cannot be constrained as much as constraining the items belonging to the common price range, as this might lead to null retrievals. In addition there were missing values; out of the 1875 restaurants used in experiments only 295 had cuisine descriptions. Such records are prone to null retrieval.
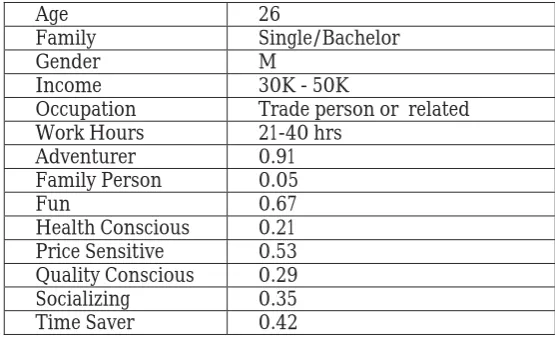
Each step is described in detail in the demonstration example below. Example scenarios for the demonstration were constructed for a hypothetical user (called User41). Information in PI layer (demographics and PBC values) of User41 is given in Table 2. In the rest of the section the advantages of the new process is demonstrated with a bench mark dataset.
Age 26
Family Single/Bachelor
Gender M
Income 30K - 50K
Occupation Trade person or related
Work Hours 21-40 hrs
Adventurer 0.91
Family Person 0.05
Fun 0.67
Health Conscious 0.21
Price Sensitive 0.53
Quality Conscious 0.29
Socializing 0.35
Time Saver 0.42
Table 2: PI layer information belonging to user41
According to the PI layer, User41 is a young bachelor with a low income. Therefore, the user is ‘expected’ to be concerned about the price. However, realistically he may have other preferences that are not apparent from only the demographic information (such as interest in food, and a desire to taste different culinary disciplines).
Scenario Id Description
41-a1 Searching a restaurant to have lunch during the work break. He is interested in food, and would like to taste different culinary disciplines for an affordable price.
41-d1 To organize a gathering of young bachelor friends to celebrate his new promotion over dinner and a drink. Price is still a concern but more attention to the friendly atmosphere and distance.
41-e1 To have dinner over a chat, with a friend. Price is a concern as paying for both but the atmosphere and the quality of the restaurant should be adequately good. At the back of his mind plans for watching a movie before the meal. Better if parking is available.
Table 3: Possible scenarios of interactions for User41
Steps in the PIPRP as detailed in the previous section are now demonstrated for user 41 for the above scenarios.
Step 1: Personalized Initial Query Specification: User41 selects Cuisine as “Italian” and food quality as “near perfect food”
The resultant query is as follows;
"Search for the items offering CUISINE type [‘Italian (North & South)’ OR ‘Italian (North)’ OR ‘Italian (Northern)’ OR ‘Italian (Southern)’ OR ‘Italian’ OR ‘Italian Nuova Cucina’] AND with FOOD QUALITY [‘Near-perfect Food‘]”
This is parametric search resulting in few (only 3) restaurants being retrieved thus eliminating many restaurants which could still interest the user.
Step 2: Personalized Query Expansion for capturing varying possibilities and minimizing null retrieval
If only the constraints given in Step 1 are used, there is a high chance of null retrieval. (As demonstrated, only 3 restaurants were retrieved).
User41 is described as a person interested in food and different culinary disciplines. He may have selected ‘Italian’ cuisine due to reasons such as, he not having ever experienced ‘Italian’ food; having experienced Italian food and liking the Italian flavor, or maybe he preferring a certain Italian dish. User41’s user model shows high relevance values for both ‘Fair Food’ and ‘Good Food’ which was allocated based on user’s PBC values. The query is expanded using all additional attribute values in the user model as follows.
"Search for the items that offer CUISINE type [‘Italian (North & South)’ OR ‘Italian (North)’ OR ‘Italian (Northern)’ OR ‘Italian (Southern)’ OR ‘Italian’ OR ‘Italian Nuova Cucina’] AND with FOOD QUALITY [‘Near-perfect Food’ OR ‘Fair Food’ OR ‘Good Food’]”
This resulted in an expanded 106 records. If this is an unmanageable number of records, for the user, then can be filtered in later steps. Otherwise has the option to stop the search process in Step 2 (see Figure 5).
Step 3: Further Filtering Based on the User Model – Personalized Filtering
"Search for the items with CUISINE type [‘Italian(North & South)’ OR ‘Italian(North)’ OR ‘Italian(Northern)’ OR ‘Italian (Southern)’ OR ‘Italian’ OR ‘Italian Nuova Cucina’] AND with FOOD QUALITY [‘Near-perfect Food’ OR ‘Fair Food’ OR ‘Good Food’] AND the DÉCOR is from poor to good AND the SERVICE is from fair to good”
The outcome of Step 2 (106) items was reduced to 85 items.
Step 4: Further Querying the User
Refer to DI layer information in Figure 2. Feature number “4”, has five attributes. User 41’s ATR for feature number 4 is calculated as follows;
ATRfeat4= (0 + 0.2 +0.3+0.43+0.41)/5 = 0.265
Figure 7, shows the ATR values of features in the DI layer of User41. Feature “popularity” has the highest ATR value, while the feature “restaurant category” has the least ATR value. Therefore, the first question in Step 4 on ‘popularity’ will be followed by the question on ‘location’ which has the next highest ATR value.
Figure 7: ATR values calculated for User 41’s DI layer for restaurants before the scenario 41-a1
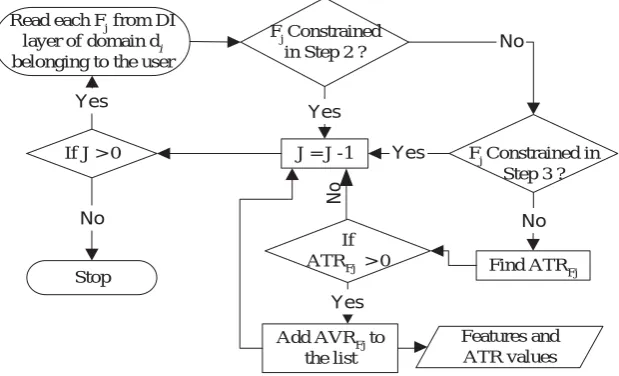
The algorithm for ordering the item features according to ATR values is shown in Figure 8. Each feature is represented as Fj, j[1, 2, .., J], and J is the total number of features exploited to describe items in the current interacting domain di. Now, starting from the feature with the highest ATR value, each feature is directed to the user as a question. All the attribute values are provided as options for the question.
FjConstrained in Step 2 ?
FjConstrained in Step 3 ? Read each Fjfrom DI
layer of domain di belonging to the user
Stop Find ATRFj
If ATRFj > 0
Features and ATR values J = J -1
If J > 0
No No Yes Yes Yes Yes No
Add AVRFjto the list
No
Figure 8: Feature selection for further querying
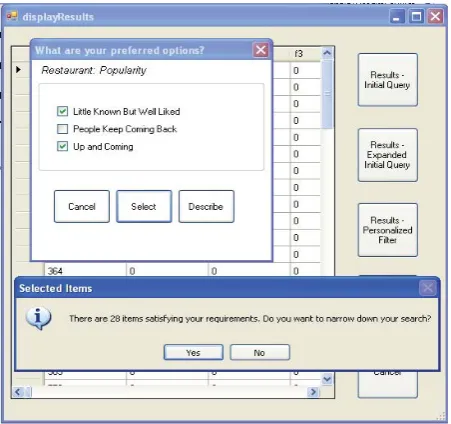
Figure 9 shows the three possible attribute values as options to obtain a value for the feature ‘Popularity’. The result set is filtered according to the user selected attribute values (In the example, ‘little known but well liked’ and ‘up and coming’).
Even though the user model indicates ‘popularity’ as the most important feature, there can be instances where the user is not interested in the feature for the current scenario. In such situations cancellation (“Cancel”) of the query is possible. Therefore, the user is able to control
Average Total Relevance Values of features - User41
0 0.1 0.2 0.3 0.4 0.5 0.6 0.7 Cuisin e Cost Deco re Food Qulity Resta urent Cate gory Spec ial M
eal T
imes
Custo
mer S
ervice Loca tion Atm osph ere Park ing Spec
ial s
the filtering during the interactive process. The “Describe” button provides a description of any of the selected attributes, providing any sub features of the attribute or a simple description held by the system.
Figure 9: Filtered according to ‘Popularity’, constraint - 28 records remains in the result set
After filtering based on ‘Popularity’ constraint the user can choose either to browse the results or further constrain the result set. If further filtering required, the question asking process continues until all the features with positive (greater than zero) ATR values are presented to the user as a question.
Once the user shows interest to view the results, items are displayed as in Figure 10.
Figure 10: Item display screen
The picture of the restaurant gives the user a more descriptive idea about what to expect. The presentation is personalized by showing the attributes explicitly requested by the user separately from the other attributes. User can explicitly see if his/her preferences are met by the result.
Step 3. As such, the user is allowed to change the preferences provided during system querying with minimal effort and time.
Step 5: Calculate Similarity between the Query and the Items
For simplicity, assume a domain D with only fifteen attributes (a1-a15).
A query Qu and four items to compare are presented in Figure 11. IA, IB, IC, and ID, are four items each described using 15 binary-values to indicate the presence or absence of the fifteen attributes.
In query Qu, the user shows interest in attributes a1, a3, a5, a11 and a15. Query Qu is formed starting from the initial specification and then through the steps 2, 3, and 4 of the algorithm. According to the query, U requested attributes a1, a3and a11(circled) when specifying the initial query (Step1, highest relevant attributes) and a5 and a15 (underlined) were provided as preferences during Step 4 (which are less important than a1, a3and a11).
Qu = 1 0 1 0 1 0 0 0 0 0 1 0 0 0 1
IC = 1 0 0 0 0 1 0 0 0 0 0 0 0 0 1
IB = 0 0 1 0 1 0 0 1 0 0 0 0 0 0 0
ID = 0 0 0 1 0 0 0 1 0 0 0 1 1 1 0
IA = 1 0 1 0 1 1 0 1 0 0 1 0 0 0 1
a3 a11
a1 a2 a4 a5 a6 a7 a8 a9 a10 a12 a13 a14 a15
Figure 11: Comparison of four different items IA, IB, IC, and IDto a query Qu
Each attribute has a relevance value in U’s DI layer for domain D. The relevance values of attributes a1-a15in the DI layer of a user U is as shown in Figure 12.
a1 0.69 a4 0 a7 0.46 a10 0 a13 0.24
a2 0 a5 0.18 a8 0.2 a11 0 a14 0
a3 0.42 a6 0.81 a9 0.02 a12 0.08 a15 0.27
Figure 12: Attribute relevance values for U
It
em
Init
ia
l
Query Du
rin
g
Ret
rie
val
From th
e
User Model
IA a1,a3, a11 a5, a15 a6,a8
IB a3 a5 a8
IC a1 a15 a6
ID - - a4, a8, a12, a13, a14
Table 4: Summary of attributes and their calculated relevance values
It
em
Total Similarity =
¦
n i
S
1
um psp
iq
(i)
im
(i)
Sim
(i))
(Sim
IA (1+0.69)+(1+0.42)+(1+0)+(0.75+0.18)+(0.75+0.27)+(0+0.81)+(0+ 0.2) = 7.07
IB (1+0.42)+(0.75+0.18)+ (0+ 0.2) = 2.55
IC (1+0.69)+ (0.75+0.27)+(0+0.81) = 3.52
ID (0+0)+(0+0.2)+(0+0.08)+(0+0.24)+(0+0)= 0.52
Table 5: Total similarity of each item
IB, is similar to ICwith regard to the number of attributes present. IBhas a3 from initial query whereas IC, has a1; and IBhas a5during Step 4, whereas IChas a15; they both have one more additional attribute present in them. If the relevance values from the user model are not considered, both items IBand ICends up with identical similarities, which is not true. Usually, when calculating similarity measures, methods such as cosine similarity1 or Pearson correlation2are required to avoid such errors. Due to the use of relevance values from the user model, our approach of similarity calculation does not require such methods. As mentioned previously, similarity calculations are time consuming if used with a large dataset. In PIPRP, the similarity calculation is utilized only if required, after several filtering steps. Therefore, in PIPRP similarity is calculated only for a smaller number of records that remain after previous filtering.
5 Evaluation
Evaluation of the work requires combined evaluation of the user model (LUM) and the interactive product search (PIPRP). As far as the user model is concerned, one of the most important issues is its accuracy in recommendations. Although, there is no generally accepted methodology for evaluating the performance of a user model, there are few methodologies that are introduced to the user modelling community from other backgrounds such as Artificial Intelligence (Zukerman and Albrecht 2001). Precision, Recall and F1-measure, Predicted probability and accuracy, and utility are a few of such methods. More often, the evaluation methods depend on the availability of data and testing environments.
1Cosine similarity Wikipedia URL: http://en.wikipedia.org/wiki/Jaccard_index 2Pearson Correlation Wikipedia URL:
With regard to interactive product selection processes the evaluation method varies according to the type of the system. In the literature, interactive systems are often evaluated based on the time spent to isolate manageable results set. Or, by counting the number of interactions required to obtain the final recommended product list. In interactive decision guides (Schmitt, Dopichaj et al. 2002) the number of interactions is the number of features specified by the user. In critique based systems (Burke 2002, Viappiani, Faltings et al. 2006) initial query and the number of critiques applied to direct the search becomes the total number of interactions. Both these types do not use a model of the user. In user model based systems, such as Adaptive Place Advisor (Thompson, Göker et al. 2002), the number of times explicit information acquired from the user during a transaction is considered as the number of interactions. Since our work is a combination of a user model (LUM) and an interactive product search (PIPRP) it is worth evaluating the model against criteria critical to requirements of the current eBuyer’s needs (Pu, Faltings et al. 2004). Therefore, in next section the novel model is evaluated according to a set of product selection criteria in eBuying environments.
5.1 Principles for evaluating online product selection
Work in (Pu, Faltings et al. 2004) investigated a broader spectrum of options to handle during an online interaction. These principles are based on the assumption that the user is not fully aware of his/her need to the minor detail. In (Pu, Faltings et al. 2004), to support user’s product selection process a three-way strategy has been employed:
1. Provide users with domain knowledge - provision of domain knowledge to help the user make the selections.
2. Avoid means objectives - capturing the user’s actual objectives.
3. Convince the user – provide user with verification of system selections.
The three-way strategy is enforced using a set of principles. As explained in (Pu, Faltings et al. 2004), Figure 13, shows the three aspects and the six principles defined to achieve them. For a detailed explanations and examples please see (Pu, Faltings et al. 2004).
Provide users with domain knowledge
Principle 1: Elicit preferences within context.
A search tool should ask questions with reference to a complete and realistic context, not in an abstract way.
Principle 2: Allow partial satisfaction of user preferences.
When no solutions exists that satisfy all preferences, show solutions that satisfy a maximal subset.
Avoid Means Objectives
Principle 3: Allow partial preference models.
Do not force the user to provide any specific preferences. Principle 4: Any preference
Allow users to state their preferences on any attribute rather than a fixed subset.
Principle 5: Any order
Allow users to state their preferences in any order they choose.
Convincing
the user Principle 6: Support tradeoff navigationThe search tool should provide active tradeoff support for the user to
compare examples shown.
Figure 13: Interaction principles for online product navigation given in (Pu, Faltings et al. 2004)
In (Pu, Faltings et al. 2004) the principles are implemented for Smart Client; a preference based search tool without a user model. In addition to fulfilling the above principles, PIPRP is capable of providing users with less obtrusive questioning. Here we consider;
We declare two more new principles as in Figure 14.
Principle 7: Ask meaningful questions
A search tool should ask questions with which are easy to understand and also in a meaningful sequence.
Principle 8: Minimize personal questions
A search tool should minimize the number of questions related to users’ personality. Figure 13: Additional principles
5.2 Principle based evaluation using the proposed criteria
In this section, we evaluate the new model and process against each of the above 8 principles. Principle 1: Elicit preferences within context
PIPRP provides an easy to use flexible interface, facilitating the users to specify their changing needs in a dynamic and volatile environment. In Step 1 of the algorithm, use of the interface where all the features and attributes are displayed (shown in Figure 6) helps the user to concentrate on the context. This corresponds to the above principle 1, which request user inputs to be more specific to the context. Since all the possible options are provided, specifying preferences needs less effort than providing inputs for an open-ended question. The items are thoroughly described and the options are provided to help specify the user need.
Principle 2: Allow partial satisfaction of user preferences
A search engine could often result in null retrievals: or it misses out on many good items that might suit a user. For example, strict constraints leave out closer outcomes such as slightly greater or lesser price ranges.
Since the relevance values are allocated as a fuzzy function, more than one attribute becomes relevant under the same feature (Table 6). As explained in Step 2 of the algorithm, personalized query expansion is carried out by expanding the initial query using the other relevant attributes in the user model. For example, if presented as a query, the initial attribute selection for scenario 41-e1 (see Table 3) is as follows:
“Search for the items that has price in range $15-$30, has good décor and has the atmosphere as warm spots by the fire”
At the time of the interaction the user model had more than one attribute value under each features. Therefore, the following query resulted after the personalized query expansion using the user model information in Table 6.
Feature
Name Attri-Name Init-Rel Curr-Rel
Cost $50 and more 0 0
$15 and less 0.1 0.12
$30-$50 0.45 0.88
$15-$30 0.74 1
Décor Excellent Décor 0 0
Extraordinary
Décor 0 0
Near-perfect
Décor 0 0
Poor Décor 0.08 0.15
Good Décor 0.7 0.85
Fair Décor 0.55 1
Atmosphe
re Dining Outdoors 0 0.2
Place for
Singles 0 0.04
Quiet for
Conversation 0 0.04
Table 6: A summary of user 41’s user model content
Therefore, the expanded query is capable of retrieving more items than the items fulfilling exact constraints.
The query expansion results in a larger number of outcomes reducing the chance of null retrieval. These items may not satisfy all the constraints the user specified in the initial search query, but the system still produces adequately matching outcomes. Hence the algorithm allows partial satisfaction of user preferences.
Principle 3: Allow partial preference models
PIPRP does not force the user to provide any specific preferences. In Step 1 the user can start product navigation by simply specifying the most important attributes that comes to the mind. Although system generates questions (in Step 4), users have the option to cancel any question that they are unsure about the answer or not interested in. Therefore, the system does not force the user to provide any specific preference unless user willingly provides the most important preferences. Hence the model complies with principle 3.
Principle 4: Any preference
In PIPRP users provide their inputs in two occasions; Step1 and Step4. In Step1, the flexible interface allows input of any preference, where each individual’s personal choices can be entered. We believe, if a person is looking for presence of a particular attribute, they will provide such inputs in Step1. In Step4, user provides answers for system generated questions; if a feature seems important according to the user model such features are presented to the user as questions. Again, such questions are personalized to each individual depending on the user model. However, if the presented feature is not important to the user, s/he has the ability to cancel such questions without providing an answer. Therefore, PIPRP fulfils principle 4 by allowing users to state their preferences on any attribute rather than a fixed subset.
Principle 5: Any Order
Users are also allowed to select more than one preference from the given options in both Step1 (Figure 6) and Step4 (Figure 9), where the user is not particular about a single option. All selected attributes are included in the query. After each user selection, the results set is filtered retaining the records that fulfil the user request.
Principle 6: Convincing the User and Support trade-off navigation
The search tool should provide active tradeoff support for the user to compare examples shown (Pu, Faltings et al. 2004). Most prefer to compare the final results and find the true best answer by considering any affordable tradeoffs thus verifying the quality of the results.
As previously mentioned, Step 3 results are maintained as a record set throughout the process. Therefore, if the user is not satisfied with the outcomes, it is possible to go back and invoke the same set of system questions. This allows modification of preferences to determine their effects on the results. When the attribute selection is changed, if the outcomes become different, user can compare and choose.
For example, the filtering mechanism used in Entrée, removes any un-matching items from the results set after each tweak (Burke 2002). Since the disagreeing items are removed from the result set, getting a different set of outcomes by changing the attribute values becomes very limited (apart from starting a fresh search).
Furthermore, the interface permits the user to go back and forth in the system selected result set (using ‘Next’ and ‘Back’ buttons, Figure 10). As explained previously, the system output is in the highest to least relevant order. The user can use the navigation facility to traverse the list and compare the recommendations. For example, it is possible to verify if the recommended items in the top of the list are preferred than the items later in the list.
Principle 7: Comprehensive Questions
Comprehensive nature of a question depends on not only its simple and easy-to-understand aspect but also the sequence in which they were asked. For example, static surveys include related questions in a group box or in the same page for the interviewee to understand the questions which are related to the same issue. But in dynamic dialogues, the intention of the process is only to reduce the number of questions. These systems chose the most discriminating feature among the result set and present it as a question to the user (User provides the preferred attribute value as the answer). Since the features are arbitrary this method often puzzles users with the order of their questions.
In PIPRP, the questions are generated according to the average total relevance (ATR) of a feature. Therefore, the most relevant question is first directed to the user. For example if the ATR values are 0.325 and 0.222 for cost and décor respectively, then price range is queried before asking the preference for décor. Since each user has different ATR values the question sequence is personalized; hence comprehensibility can be ensured.
Furthermore, in the design itself, we had grouped together the attributes corresponding to each feature. For example, feature ‘cost’ has four attributes. Therefore the questions are meaningful with selection of options.
Principle 8: Minimize Personal Questions
user’s income. Similarly system questions related to any PIR-attribute may look intrusive trying to capture user’s personal information. Therefore, we believe such questions should not be directed to the user unless the user specified them willingly as an initial preference. As a result PIPRP employs ‘personalized filtering’ as described in Step 3 of the algorithm. Such question reduction strategies further improves the quality of the interactions by indirectly encouraging a fewer number of questions.
6 Conclusion
We have illustrated the use of a layered user model (more specifically, LUM) for providing personalization in all three phases of an interactive online product retrieval process: requirement elicitation, product search and product presentation. Since the new technique introduced in the paper integrates a user model with a product retrieval process, evaluation requires transaction details with related user information such as demographics. There were no such benchmark datasets available and as such we have used the well-known Entrée dataset which has detailed product information. By introducing a hypothetical user with a range of interests we have managed to demonstrate the features and functionality of the new product retrieval process. Combination of the user model in interactive product retrieval has a number of benefits including:
i. the ability to expand queries in an intuitive way (using the user model in addition to the current query) when there is possibly little or no items retrieved; ii. the ability to filter results set (using the user model) when the answer set to a
query is too large;
iii. the ability to increase the chance of returning a satisfactory results set (since we have more information from the user model); and
iv. the ability to do the above three without increasing the burden of user interaction or obtrusiveness (by minimizing asking where possible by getting information from the user model, and avoiding questions with high personal information content).
Our scenario demonstrates (by example) that the method works, and we also provided a principles-based evaluation of our new process. Our research, hence, provides a new way of using user models in the interactive product retrieval process. While our domain has been restaurants, interactive retrieval of other types of product information can be similarly considered.
As future work we intend to test the system with a set of real users. Also, even though we show that LUM works in PIPRP, a similar process to PIPRP can be explored but replacing LUM with other kinds of user models.
Acknowledgement
Author thankfully acknowledges the research discussions and comments contributed to this work by Associate Professor Seng Loke, La Trobe University, Australia and Professor Arkady Zaslavsky, CSIRO, Australia.
References
Ahn, J.-w., P. Brusilovsky and S. Sosnovsky (2006 ). QuizVIBE: Accessing Educational Objects with Adaptive Relevance-Based Visualization. Proceedings of World Conference on E-Learning, Honolulu, HI, USA.
Annacker, D., S. Spiekermann and M. Strobel (2001). E-privacy: A new search cost dimension in online environments. Proceedings of 14th Bled Conference of Electronic Commerce, Bled. Slovakei.
Asuncion, A. and D. J. Newman. (2007). {UCI} Machine Learning Repository. 2008, from http://www.ics.uci.edu/$\sim$mlearn/{MLR}epository.html.
Burke, R. (2001). Ranking Algorithms for Costly Similarity Metrics. Case-Based Reasoning Research and Development 4th International Conference on Case-Based Reasoning, New York, Springer Verlag.
Burke, R. (2002). "Hybrid Reccommender Systems: Survey and Experiments." User Modelling and User-Adapted Interaction 12: 331-370.
Burke, R. (2002). "Interactive Critiquing for Catelog Navigation in E-Commmerce." Artificial Intelligence Review 18(3-4): 245-267.
Burke, R. (2007). Hybrid Web Recommender Systems. The Adaptive Web. A. K. P. Brusilovsky, and W. Nejdl Berlin Heidelberg Springer-Verlag LNCS 4321: 377 – 408. Doyle, M. and P. Cunningham (2000). A Dynamic Approach to Reducing Dialog in On-Line
Decision Guides. 5th European Workshop on Case-Based Reasoning (EWCBR 2000), Springer Verlag.
Mahmood, T. and F. Ricci (2009). Improving recommender systems with adaptive conversational strategies. Hypertext. C. Cattuto, G. Ruffo and F. Menczer, ACM: 73–82. Pazzani, M. j. and D. Billsus (2007). Content-Based Recommender Systems. The Adaptive
Web: Methods and Strategies of Web Personalization. P. Brusilovsky, A. Kobsa and W. Nejdl. Berlin Heidelberg NewYork, Springer Verlag. 4321/2007: 325-341.
Pu, P., B. Faltings and M. Torrens (2004). Effective Interaction Principles for Online Product Search Environments. Proceedings of the IEEE/WIC/ACM international Conference on Web Intelligence (WI'04). Beijing, China.
Resnick, P., N. Iacovou, M. Suchak, P. Bergstrom and J. Riedl (1994). GroupLens: An Open Architecture for Collaborative Filtering of Netnews. Conference on Computer Supported Coorperative Work. Chapel Hill, ACM: 175-186.
Schafer, J. B., D. Frankowski, J. Herlocker and S. Sen (2007). Collaborative Filtering Recommender Systems. The Adaptive Web:Methods and Strategies of Web Personalization. P. Brusilovsky, A. Kobsa and W. Nejdl. Berlin Heidelberg NewYork, Springer Verlag. 4321/2007: 291-324.
Schafer, R. (2001). Rules for Using Multi-Attribute Utility Theory for Estimating a User's Interests. 2008, from http://www.kbs.uni-hannover.de/%7Ehenze/ABIS_Workshop2001/ABIS_2001.html.
Schmitt, S., P. Dopichaj and P. Domínguez-Marín (2002). Entropy-Based vs. Similarity-Influenced: Attribute Selection Methods for Dialogs Tested on Different Electronic Commerce Domains. Proceedings of the 5th European Confernce on Case Based Reasoning (ECCBR). Aberdeen, Scotland, UK: 380-394.
Shearin, S. and H. Lieberman (2001). "Intelligent Profiling by Example." Proceedings of the International Conference on Intelligent User Interfaces (IUI 2001) ,Santa Fe, NM,: 145-152.
Smyth, B., M. Coyle and P. Briggs (2011). Communities, Collaboration, and Recommender Systems in Personalized Web Search. Recommender Systems Handbook. F. Ricci, L. Rokach, B. Shapira and P. B. Kantor, Springer US: 579-614.
Spiekermann, S., J. Grossklags and B. Berendt (2001). privacy in 2nd generation E-Commerce: Privacy Preferences versus actual Behavior. Proceedings of ACM Conference on Electronic Commerce (EC'01). Tampa, Florida.
Statistica. (2014). Statistica - Digital buyer penetration worldwide from 2011 to 2018. from http://www.statista.com/statistics/261676/digital-buyer-penetration-worldwide/. Thompson, C. A., M. Göker and P. Langley (2002). "A personalized system for conversational
recommendations." Journal of Artificial Intelligence Research. 21: 393-428.
Towle, B. and C. Quinn (2000). Knowledge Based Recommender Systems Using Explicit User Models. Knowledge-Based Electronic Markets, Papers from the AAAI Workshop, AAAI Technical Report WS-00-04. Menlo Park, CA, AAAI Press: 74-77.
Viappiani, P., B. Faltings and P. Pu (2006). "Preference-based search using example-critiquing with suggestions." Journal of Artificial Intelligence Research (JAIR) 27: 465-503. Zadeh, L. A. (1965). "Fuzzy Sets." Information and Control 8: 338-353.
Zukerman, I. and D. Albrecht (2001). "Predictive Statistical Models for User Modeling." User Modeling and User-Adapted Interaction, Invited paper 11(1-2): 5 -18.