Temperature Distribution in Copper Electrode during
Electrical Discharge Machining Process
Sulaiman Abdulkareem
1,*, Ahsan Ali Khan
2, Qasim Shah
3and Mohamed
Konneh
21Department of Mechanical Engineering, Faculty of Engineering & Technology, P.M.B. 1515, University of Ilorin. Nigeria.
2Department of Manufacturing and Materials Engineering, Kulliyyah of Engineering, International Islamic University, P.O. Box 10, 50728 Kuala Lumpur, Malaysia.
3Department of Mechanical Engineering Kulliyyah of Engineering, International Islamic University, P.O. Box 10, 50728 Kuala Lumpur, Malaysia.
Received 8 November 2016; accepted 29 March 2017, available online 29 March 2017
1. Introduction
Electrical discharge machining (EDM) is used in precise machining of both complex and non-complex objects, as an alternative to traditional machining techniques [1]. EDM process involves combination of several facets such as thermodynamic, electrodynamics, hydrodynamic and electromagnetic these make EDM process difficult to present in a simple way [2]. EDM is used in precise machining of both complex and non-complex objects (such as tool and dies, injector nozzles and turbine blades in aircraft) as an alternative to traditional machining techniques [1]. EDM process involves combination of several facets such as
thermodynamic, electrodynamics,
hydrodynamic and electromagnetic these make EDM process difficult to present in a simple way [2].
According to Yeo et al., [3] many works on the analytical modeling of the EDM process have been carried out by many researchers [4-13] through the use of electro-thermal and electro-mechanical approaches. The energy
generated by electrical discharge is shared between the cathode, anode, and the plasma column. Different heat input methods have been adopted by various researchers to predict the temperature distribution in both electrodes [5, 8, 12-16].
This study analyzed the temperature distribution in copper electrode during EDM with and without liquid nitrogen. The new thing in this paper is that the analysis was carried out by combining the heat flux equation and energy received equation for copper electrode to estimate EDM spark radius. The estimated temperature of the electrode was validated by thermal diffusivity of the electrode material. The validated result shows good agreement between the simulated and measured temperature of the electrode.
2. Heat Input
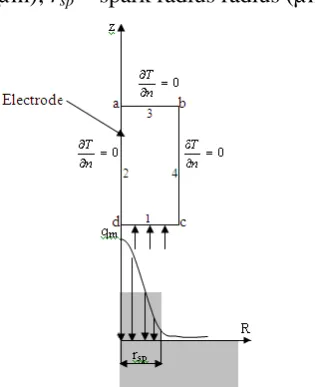
In this study, Gaussian heat input model (Fig. 1) has been used to estimate the heat from the plasma. The model gives the best approximation of EDM plasma. For Gaussian
Abstract: This paper reports on a new method used to estimate the spark radius in the gap during electrical discharge machining (EDM). This method combines the heat flux and energy equations of the copper electrode. The energy partition between workpiece and electrode (tool) due to EDM process was estimated using the ratio of thermal conductivity of the workpiece to that of the electrode. Using the energy partition between the electrode and the workpiece, temperature distribution in the electrode was established and Gaussian heat distribution was used to analyze the energy released from a single spark. The energy released due to a single spark was used to calculate the fraction of energy received by the electrode based on its thermal conductivity. The 3-D temperature distribution in the electrode was carried out using ANSYS version 11.0 and the estimated temperature of the electrode from a single spark was validated by thermal diffusivity of the electrode material. The difference of 6% was recorded between the simulated and calculated temperatures of the copper electrode. Based on the achieved percentage error, the simulated temperature on the copper electrode can be accepted as EDM process.
heat distribution, heat flux is given by Eq. 1 [5, 7-9, 11, 12].
(1)) ( 45 . 4 2 5 . 4 2 sp f r R sp M e r V I W R q flux Heat
Where qf = heat flux (W/mm2); WM = fraction
of energy utilized by the material (Watt); I = pulse current (Amp); V = gap voltage (Volt); R = radial distance from the axis of the spark (µm); rsp = spark radius radius (µm).
Fig. 1. Gaussian heat distribution for modeling the electrode.
3. Energy Release from a Single Spark
Energy Esp (watt) released from a single
spark is given by Eq. 2 [4, 5].
) 2 (
on
sp I V t
E
Where I = pulse current (Amp); V = gap voltage (Volt); ton = on-time (µs). According to [4, 5],
the total energy absorbed by any material from single spark is given by Eq. 3.
) 3 (
on M
M W I V t
E
EM = total energy receive by the material
(Watt); WM = fraction of energy absorbed by the
material (Watt). In this work, spark radius (rsp)
was calculated by combining Eq. 1 (heat flux equation) and Eq. 3 (energy absorb equation) based on the fact that plasma radius is a function of current intensity, discharge voltage, pulse duration and fraction of energy absorbed by the material [4, 5, 7, 12].
4. Energy Partition
Titanium workpiece absorbs less heat due to its lower thermal diffusivity compared to the copper electrode. In EDM modeling, many researchers used different fractions of heat distribution; ranges from 17% to 20% [4, 5, 12, and 14]. The ratio of thermal conductivity of the workpiece to that of electrode was used to obtain the percentage of energy fraction to be absorbed by the electrode.
19 : 1 19 1 19 . 401 59 .
21
electrode of ty conductivi Thermal workpiece of ty conductivi Thermal
Fraction of energy absorbed by the electrode is taken to be 0.19. This is in line with the work of [4].
5. Heat Flux
Spark radius rsp is estimated by combining
Eq. 3 and Eq. 1. The values of 5.3A, 4.3µs and 23V for the current, pulse on-time and voltage respectively were the values used for EDM machining. These values were selected based on the available variations in machine settings.
Energy received by copper (Eq. 3) = Heat flux into copper (Eq. 1)
) 4 ( ) ( 45 . 4 2 5 . 4 2
rsp
R sp cu on cu e r V I W t V I W
Wcu is fraction of energy that goes into copper, I
is current (A), V is gap voltage (V), ton is pulse
on-time (µs), R (Fig. 1) is radial distance of the point under consideration from the axis of spark (mm) and rsp is spark radius (µm). Just before
heat flux into the electrode, the value of R is zero; hence Eq. 4 reduced to:
2 ) ( 45 . 4 sp cu on cu r V I W t V I W m t r radius spark Therefore on
sp 0.574
45 . 4 ,
(1) The radial distance R from the axis of the spark is taken to be equal to spark radius of 0.0005 mm.
(2) The spark occurs within a minimum gap size of 0.1 mm [17, 18].
To ensure that heat is concentrated at a point within the gap.
5.445 2
6 5 . 4 2 W/mm 33 . 942 , 429 10 035079381 . 1 06645 . 103 ) ( 45 . 4 1 . 2 e e r V I W R q flux Heat Eq From sp f r R sp cu
The estimated heat flux into the copper electrode is 429.9 KW/mm2.
6. Temperature Modeling
Due to random and complex nature of EDM, the following assumptions were made: (i). the analysis is made for one spark, (ii). Total power of each pulse is used by one spark, (iii) Electrode domain is axisymmetric, (iv). Heat transfer to electrode is by conduction, (v). There is constant heat flux into the electrode, (vi). The temperature distribution is governed by heat conduction. Conduction heat transfer serves as the thermal boundary condition on surface 1 (Fig. 1). No heat transfer across boundaries 2, 3 and 4.
Initial condition: At time t = 0; Temperature T = T280C (ambient temperature) at electrode
domain. Boundary conditions: At time t > 0; on boundary 1, there exist:
small assumed is spark electrode betw r R if z T A K boundaries on n T time off pulse r R if q z T K sp sp R & . dist 4 & 3 , 2 0 0 ) 5 ( ) &
(A zarenegligible z T A K q From
conv
C
T 1,072.180
401 33 . 942 , 429
Temperature at point i on the copper electrode is estimated to be 1,072.180C.
7. Results
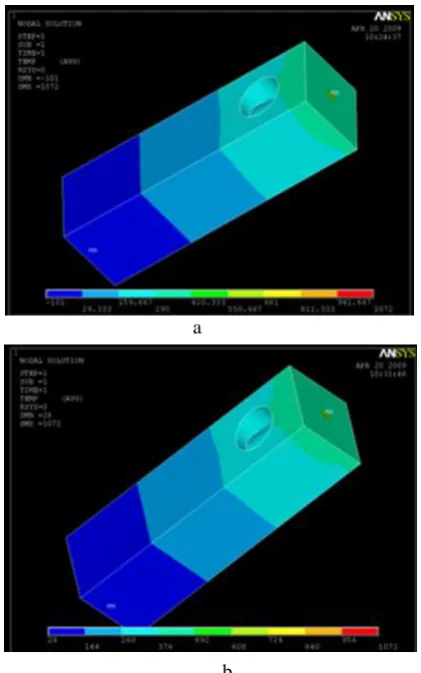
Figures 3 and 4 show the temperature variations along copper electrode when liquid
nitrogen was introduced. The exit temperature was observed for the two conditions during EDM. A rapid change in temperature is observed within a very small area in the vicinity of the applied temperature for both electrodes. As the distance x is farther away from the input temperature, there is a corresponding change in the values of the temperature along the electrode length up to the point where a temperature of -1010C and 280C were recorded for both electrodes (with and without nitrogen) respectively.
Fig. 2 Electrode heat flux with boundary conditions.
8. Temperature Validation
The temperature of 1,0720C was validated by heat equation. From Fig. 2: Point i is at temperature T1; Point j is at temperature T2 =
4300C (T1 > T2)
Distance i-j = 5mm;
T1 can be calculated from: T1 = T2 + α (Δz) (6)
α = thermal diffusivity of copper electrode (mm2/s)
Δz = distance (mm)
) 7 ( p C k by given is y diffusivit Thermal
k = thermal conductivity (W/mm) ρ = density of copper (g/mm3
) Cp = specific heat capacity (J/g 0C)
s mm / 25 . 116 385 . 0 1 96 . 8 1000 1000
401 2
From (Eq. 6) T1 = 403 + 116.25 (5) = 1,011.30C
a
b
Fig. 3 Variations in temperature distributions on the electrode: (a) EDM with nitrogen, (b) EDM without nitrogen.
9. Conclusion
The analytical results of the analysis of temperature distribution in copper electrode during EDM process have been presented. The main conclusion is that, the temperature dependency of the electrode is very important to the accuracy of the results and this gives better correlations with the simulated temperature. Furthermore, the estimated temperature of 10720C for the electrode was validated giving 6% error between the two temperatures. Since there is no much disagreement between the simulated value of 10720C and experimental value of 1,011.30C, the temperature can be accepted to close to EDM process.
References
[1] Nizar Ben Salah, Farhat Ghanem, and Kais Ben Atig, Numerical study of thermal
aspects of electric discharge machining process. Int. Jour. of Machine Tools and Manuf. 46: pp. 908-911 (2006).
[2] Boothroyd, G. G., Fundamentals of Machining and Machine Tools, 3rd ed. Florida: CRC/Taylor & Francis, Boca Raton, (2006).
[3] Yeo, H., Kurnia, W and Tan, P. C., Critical assessment and numerical comparison of electro-thermal models in EDM. Jour. of Materials Proc. Technology 203: pp. 241-251. (2008).
[4] Deepak Kumar Panda, Study of thermal stresses induced surface damage under growing plasma channel in electro-discharge machining. Jour. of Materials Proc. Technology 202 pp. 86-95. (2008). [5] Philip Allen and Xiaolin Chen. Process
simulation of micro electro-discharge machining on molybdenum. Jour. of Materials Proc. Technology 186: pp. 346-355 (2007).
[6] Marafona, J and Chousal, J.A.G., A finite element model of EDM based on the Joule effect. Int. Jour. of Machine Tools and Manuf. Vol. 46, Issue 6, pp. 595-602 (2006).
[7] Bhondwe, K. L., Vinod Yadava and Kathiresan, G. Finite element prediction of material removal rate due to electro-chemical spark machining. Int. Jour. of Machine Tools and Manuf. 46 pp. 1699 -1706 (2006).
[8] Schulze, H. P, Herms, R, Juhr, H, Schaetzing, W. and Wollenberg, G. Comparison of measured and simulated crater morphology for EDM. Jour. of Mat. Proc. Technology. 149 pp. 316-322 (2004). [9] Shuvra Das, Mathias Klotz and F. Klocke.
EDM simulation: finite element-based calculation of deformation, microstructure and residual stresses. Jour. of Materials Proc. Techn. 142: pp. 434-451 (2003). [10] Vinod Yadav. K. Vijay Jain and M. and M.
Prakash Dixit. Thermal stresses due to electrical discharge machining. Int. Jour. of Machine Tools and Manuf. Vol. 42, Issue 8, pp. 877-888 (2002).
the electro discharge machining process–a simple cathode erosion model. Jour. of Applied Physics 69: pp. 4095-4103 (1989). [12]Patel, M. R. Barrufet, M.A, Eubank, P. T
and DiBitonto, D. D. (1989). Theoretical models of the electrical discharge machining process-II: the anode model. Jour. of Applied Physics. 66: pp. 4104-4111 (1989). [13]Ikai, T and Hashigushi, K. Heat input for
crater formation in EDM. Paper presented at the International symposium for electro-machining. (1995). ISEM XI, EPFL, Lausanne, Switzerland.
[14]Salonitis, K. Stournaras, A. Stavropoulos, P and Chryssolouris, G. Thermal modeling of the material removal rate and surface roughness for die-sinking EDM. Int. Jour.
of Adv. Manuf. Technology DOI 10.1007/s00170-007-1327-y (2007).
[15]Bulent Ekmekci, Erman Tekkaya and Abdulkadir Erden. A semi-empirical approach for residual stresses in electric discharge machining (EDM). Int. Jour. of Machine Tool & Manuf. 46: pp. 858-865 (2006).
[16]Ali Ozgedik and Can Cogun. An experimental investigation of tool wears in electric discharge machining. Int. Jour. of Adv. Manuf. Techn. 27: pp. 488-500 (2006). [17]McGeough, J. A., Advanced methods of
machining (5th edn.). USA: Chapman and Hall (2003).
[18]Khanna, Production technology (9th edn.). Ohio: Tata Mc-Graw-Hill publishing company Ltd. (1993).