Modelling of Mean Drop Size in a Extraction Spray Column
and Developing a New Model
Ghorbanian, Sohrab Ali*
+; Abolghasemi, Hossein
School of Chemical Engineering, Faculty of Engineering, University of Tehran, I.R. IRAN
Radpour, Saeid Reza
Chemical and Petroleum Engineering Department, Sharif University of Technology, I.R. IRAN
ABSTRACT: Drop size distribution plays a key role in the liquid extraction systems and related hydrodynamic and mass transfer parameters. In current research work, the size of drops in an extraction spray column has been measured by direct photography method, and the Sauter mean diameter has been obtained accordingly. Then, two types of models are assessed based on using dimensionless analysis and appropriate software. The interfacial tension in used chemical system is 1.8-32 dyne/cm. In first type of models, the correlation is established based on dimensionless parameters similar to approaches defined by other researchers. In second types, dimensional parameters have been used and therefore a new model is introduced for multi-drop extraction columns. The results show that the drop size diameter has the most affect on Eötvös number (Eo) in the first type of model and the correlation based on Eo number predicts drop size diameter with 8.1% error. In the second ones, four dimensional parameters (dN, ∆ρ, σ, u) have been selected
as the most effective variables on drop size diameters and modelling results show prediction of drop size diameters with 5.82% error. In other cases, without using "u" as a variable, the amount of error has been decreased to 5.73% which shows better fitting.
KEY WORDS:Liquid extraction, Spray column, Drop diameter, Modeling.
INTRODUCTION
In extraction processes, different methods and equipments are used such as mixer-settlers, packed columns, pulsed columns and spray columns to achieve appropriate separation performance. In all of these equipments, mass transfer is occurred by dispersing one phase into another one. Generally, among many types of extractors, extraction columns are widely used in industries, because of stable operation and high efficiency per stage. On the other hand, the extractor equipments without mechanical agitation, such as spray columns or packed columns, have high level performance despite
small interfacial area between two phases because of large drop size. Extractor equipments with mechanical agitation, such as RDC columns, have high stage efficiency due to the large interfacial area, despite low level performance.
The stage efficiency depends on the interfacial area of dispersed phase, the mass transfer coefficients in the continuous phase and other properties of dispersed phase. The interfacial area increases with drop size decreasing and hold-up increasing related to dispersed phase.
Drop size has a key role on the design of liquid-liquid
*To whom correspondence should be addressed. +E-mail: [email protected]
extraction columns. It affects the dispersed-phase hold-up, the residence time of the dispersed phase, and performance. Furthermore it affects on the mass transfer interfacial area and mass transfer coefficients of continuous and dispersed phases. It is therefore important to predict the drop diameter as a function of the column geometry, agitation conditions, physical properties of the liquid-liquid system, and direction of mass transfer.
Some investigators have developed mathematical relationships to describe the effects of column operation conditions on the drop size distribution. Hayworth & Treybal (1950) and Null & Johnson (1958) have presented semi-theoretical methods for estimating drop sizes in liquid-liquid systems. The Hayworth & Treybal correlation is derived from data with high interfacial tension and a maximum nozzle velocity of 0.33 ft/s. The Null & Johnson data includes relatively low interfacial tension systems and cover a range of nozzle flow rates in which uniform drop sizes are obtained. Keith & Hixon (1955) and Christiansen & Hixson (1957) have investigated the disintegration of organic liquid jets in water for the condition in which the interfacial area produced by the drops is at a maximum [2].
In recent years, several investigators have studied drop size diameter in extraction equipments. Some investigators have studied drop size in single nozzle distributors [3-6]. Other investigators have studied drop size in multi-nozzle distributors [7-12]. Some investigators have reviewed the three available methods for drop size distribution modeling including: the maximum entropy method, the discrete probability function method and the empirical method. The study of drop formation deals with the fundamental understanding of the behavior of liquid drops under the influence of various external body as well as surface forces [13-16].
In this paper, proposed models to predict drop size distribution have been considered basically with a focus on used variables in models. Then two types of models are established based on dimensionless and dimensional parameters and therefore two models are developed for multi-nozzle spray columns.
A fair comparison of present correlations with previously published equations is not always possible, since many of them only apply over limited ranges of variables. Furthermore, some of the earlier equations are implicit, and a solution for d32 is not always possible. However results show that models, developed in this paper, predict
the mean drop size distribution with appropriate deviation of experimental data. Also present modelling has been verified with ten statistic tests and therefore it is more adaptable, compatible and reliable rather than other models obtained with other researchers.
Generally, the drops are generated in elliptical or spherical form in spray columns. Also, usually the form of small drops is spherical and with increasing the drop size, probably the form of drops will change to elliptical. In addition, drop inertial with drop size increasing will increased. The area of elliptical drops could be calculated with Eq. (1) [3].
(
)
V H
2 2
H 2
d d
A d ln E E 1
2 E 1
= + + −
− (1)
Modified correlation for equal spherical drop area calculation (or equal diameter) could be calculated via Eq. (2) [3].
(
)
2 2
3 1
2 3 e
A 1 1
E ln E E 1
A =2 +E E −1 + − (2)
Current research work has been planned and implemented to develop models to predict mean drop size in extraction spray columns to achieve more accuracy.
Apparatus and experimental method
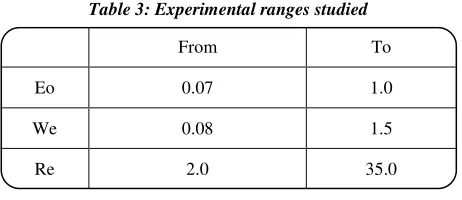
The spray column used in these experiments is made of glass in order to observe phases. The diameter and height of column is 30 cm and 200 cm respectively. A moving camera with macro lens has been adjusted through the column for photography of drops.
The volumetric flow rate of phases has been controlled with two digital measurement pumps. A drawing of spray column used in these experiments is shown in Fig. 2.
Table 1: Properties of used chemical systems.
σ (dyne/cm) µc (cp)
µd (cp)
ρc (g/cm3)
ρd (g/cm3)
1.80 1.378 1.020 0.988 0.848 Butanol-Water 25.7 0.916 0.591 0.994 0.873 Benzene-Water 30.0 0.986 0.612 0.997 0.864 Toluene-Water 32.5 0.928 0.772 0.992 0.863 Cumene-Water 36.2 0.921 0.387 0.994 0.681 Heptane-Water
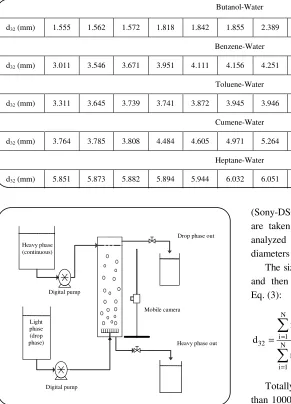
Table 2: Sauter mean diameter for chemical systems.
Butanol-Water 4.718 4.448 3.945 2.466 2.453 2.389 1.855 1.842 1.818 1.572 1.562 1.555
d32 (mm)
Benzene-Water 7.003 6.877 6.376 5.554 5.231 4.251 4.156 4.111 3.951 3.671 3.546 3.011
d32 (mm)
Toluene-Water 7.010 6.803 6.283 4.065 4.016 3.946 3.945 3.872 3.741 3.739 3.645 3.311
d32 (mm)
Cumene-Water 8.948 8.905 8.773 5.626 5.448 5.264 4.971 4.605 4.484 3.808 3.785 3.764
d32 (mm)
Heptane-Water 6.953 8.359 6.544 6.821 6.281 6.051 6.032 5.944 5.894 5.882 5.873 5.851
d32 (mm)
Fig. 2: Schematic of used spray column.
in Table 1. The temperature in all experiments is constant and equal to room temperature (25 °C).
In each experiment, the photography of drops is done through the column height. An 8 mega pixel camera
(Sony-DSC-F828) has been used and numerous photos are taken from experimental system. Then photos are analyzed with AutoCAD software and Sauter mean diameters have been calculated in each series of photos.
The size of drops is analyzed with appropriate software and then the sauter mean diameter is measured with Eq. (3): N 3 i i i 1 32 N 2 i i i 1 n d d n d = =
= (3)
Totally, 60 experiments were done and almost over than 1000 drops were analyzed. The obtained results for d32 have been shown in Table 2.
A complete model not only must be able to predict drop sizes accurately, but also must cover all governing assumptions on modeling basis after passing appropriate statistical tests. To achieve above targets, “Eviews” software version 3.1 [17] has been used.
Light Phase (Drop Phase) Digital Pump Mobile Camera Drop Phase Out Heavy Phase (Continuous) Digital Pump Heavy Phase Out Heavy phase (continuous) Light phase (drop phase) Digital pump
Drop phase out
Mobile camera
Heavy phase out
Generally, we proposed two types of models. First types of models are established based on dimensionless parameters such as We, Eo and Re. But in second types of models, we used the results of first types of models and proposed a new model based on the most effective variables. Of course, in respect of statistics, all models are optimized and several tests used for statistics accuracy such
as 2 2 adj
R , R , t-statistics, F-statistics and D.W.T(1).
Generally the drop diameter depends on interfacial tension, nozzle velocity, density and viscosity of two phases, nozzle diameter and gravity acceleration. Therefore, we can write a general correlation as:
32, c d c d N
f (d σ, u,ρ ρ ∆ρ µ µ, , , , , d , g)=0 (4)
Based on correlation 2 and pai theorem, we can defined seven dimensionless groups and we can write a correlation as below based on dimensional analysis:
32 A B C D E d F
N d c c
d
k (Eo) (We) (Re) ( ) ( ) ( )
d = (5)
The constants k, A, B, C, D, E and F can be evaluated by several different methods. In general, this model has strong statistics basis and it can predict of d32 well [9,10].
Usually, most of models consist of Eo and We. They can predict drop diameter with a low-error [8-12].
The constants are measured with regression analysis by use of Ordinary Least Square (OLS) method. In OLS method, the actual purpose is minimizing the sum of square made by differences between model and actual values. Whereas the "Eviews" software has high ability in OLS method, the analysis of models are done by this software.
In according to the method and software mentioned above, it is necessary to define some parameters, which
help in result analysis, including R2, 2 adj
R , D.W.T,
Prob(t-statistic) and Prob (F-statistic). Not only these parameters are important and effective statistic parameters in modeling, but also are defined well in "Eviews" software.
R2 and 2 adj
R are the most important parameters
to determine the model ability in fitting the variations of the models provided on the basis of experimental data. In general, the amount of these parameters is between 0.0 and 1.0 and the level of fitting increases with growing the parameters to 1.0. It must be considered that increasing
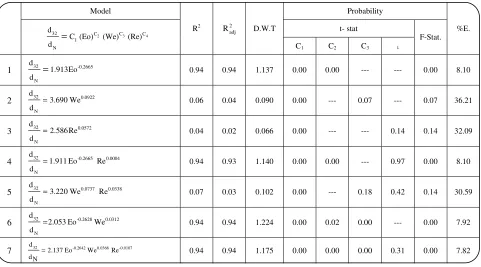
Table 3: Experimental ranges studied
From To Eo 0.07 1.0 We 0.08 1.5
Re 2.0 35.0
the number of points will hold the R2 untruly but 2 adj R
solves this problem. Thus, in the cases with enormous
experimental data, 2 adj
R is considered in analysis.
D.W.T is another parameter considering the difference between real and model amount in every point knowing as residual. In fact, this parameter assesses the relation among residual data. Relation between real and model amounts obviously decreases the validity of prepared equation in modeling. In a good model, the amount of D.W.T must be 1.0 at least, but more than 1.7 will made an appropriate model.
Prob(t-statistic) and Prob(F-statistic) are the statistical parameters to confirm the model of used independent variables and the whole format of equation respectively. In "Eviews" software, the amounts more than 0.05 for these parameters could be the results of using unnecessary variables in modelling or inaccurate format of the equation.
MODELLING RESULTS
In this paper, different types of models have been developed on the basis of related independent variables and five mentioned statistical tests, have been implemented in each ones. The experimental ranges studied are presented in Table 3.
The results of the first type models have been shown in table 4 and their assessment is as following:
• In according to the amounts of R2, 2 adj R and
D.W.T, it could be observed that the We and Re numbers aren't appropriate variable in this modeling. In addition, experimental results show an error more than 30% in these models. Thus, the models in the rows 2, 3 and 5 could not be proposed for modeling.
• In general, the amounts of Prob(t-statistic) show the importance level of the variables in modeling. As shown in table 4, the amounts of this parameter about We and Re for the models in the rows 2, 3 and 5 show that these
Table 4: Prepared models on the basis of dimensionless variable and the results of statistical tests.
Probability Model
t- stat %E.
F-Stat. C3 C2 C1 D.W.T 2 adj R R2 3 2 4
32 C C C
1 N
d
C (Eo) (We) (Re) d = 8.10 0.00 --- --- 0.00 0.00 1.137 0.94 0.94 32 -0.2665 N d 1.913Eo d = 1 36.21 0.07 --- 0.07 --- 0.00 0.090 0.04 0.06 32 0.0922 N d 3.690 We d = 2 32.09 0.14 0.14 --- --- 0.00 0.066 0.02 0.04 32 0.0572 N d 2.586Re d = 3 8.10 0.00 0.97 --- 0.00 0.00 1.140 0.93 0.94
32 -0.2665 0.0004 N
d
1.911 Eo Re d = 4 30.59 0.14 0.42 0.18 --- 0.00 0.102 0.03 0.07
32 0.0737 0.0338
N
d
3.220 We Re d = 5 7.92 0.00 --- 0.00 0.02 0.00 1.224 0.94 0.94
32 -0.2628 0.0312 N
d
2.053 Eo We d = 6 7.82 0.00 0.31 0.00 0.00 0.00 1.175 0.94 0.94
32 -0.2642 0.0368 -0.0107 d
2.137 Eo We Re d N
=
7
dimensionless parameter are not appropriate and using them in modeling causes problems in the fitting.
• As mentioned above, the amount of Prob(F-statistic) analyses the validity of the model including all of the variables. Thus the results observed in Table 4 show that the equations including Re number are not appropriate and these dimensionless number is not useful in modeling of mean drops diameter in spray columns. Also the amount of Prob(F-statistic) shows that We number is not useful lonely.
In concluding, the models in the row 2, 3, 4, 5 and 7 of Table 4 are inappropriate for mean drop size distribution modelling and the models in the rows 1 and 6 are proposed providing almost equal acceptable error. But, the complexity of a model is a criterion to select the model, thus the model in the row 6 is the best model in this field, providing required accuracy in mean drop size modelling in spray columns.
Another important result in table 4 is the negligible effect of adding dimensionless variables in modelling, decreasing error less than 0.5%.
Thus, the variable priority to use in modelling is as following:
1. Eo 2. We 3. Re
The research in this paper continued based on the results of table 4, distinguishing the effective parameters to make model. As mentioned above, Eo and We are more effective in modelling, including main variables
N , , d
σ ∆ρ and u. Thus, a new model is defined
as following:
3 5
2 C 4 C
C C
32 1 N
d =C d σ (∆ρ) u (6)
In according to the results of statistical analysis, it is better to justify C1 coefficient equal to one, to obtain appropriate accuracy in modelling.
Table 5: The output of the “Eviews” software.
Model: 0.496302 0.221950 -0.227903 0.064360 32 N
d =d (∆ρ) u
%Error: 5.8161
LOG(D32)=C(2)*LOG(DN)+C(3)*LOG(SIG)+C(4)*LOG(DRO)+C(5)
Coefficient Std. Error t-Statistic Prob.
C(2) 0.496302 0.022138 22.41868 0.0000
C(3) 0.221950 0.018452 12.02867 0.0000
C(4) -0.227903 0.028151 -8.095685 0.0000
C(5) 0.064360 0.024361 2.641928 0.0108
R-squared 0.959557 Mean dependent var -5.656403
Adjusted R-squared 0.957310 S.D. dependent var 0.566970
S.E. of regression 0.117145 Akaile info critenrion -1.384344
Sum squared resid 0.741034 Schwarz criterion -1.242244
Log likelihood 44.14597 F-statistic 427.0714
Durbin-watson stat 1.410262 Prob(F-statistic) 0.000000
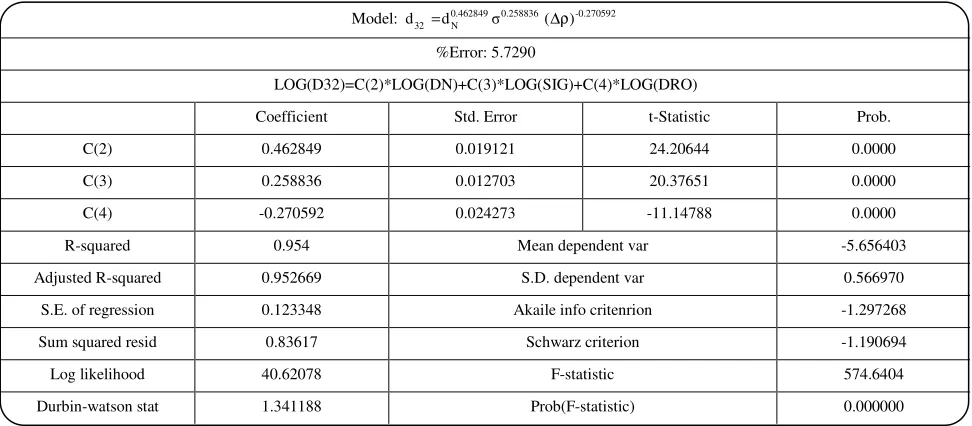
Table 6: The output of the “Eviews” software.
Model: 0.462849 0.258836 -0.270592
32 N
d =d (∆ρ)
%Error: 5.7290
LOG(D32)=C(2)*LOG(DN)+C(3)*LOG(SIG)+C(4)*LOG(DRO)
Coefficient Std. Error t-Statistic Prob.
C(2) 0.462849 0.019121 24.20644 0.0000
C(3) 0.258836 0.012703 20.37651 0.0000
C(4) -0.270592 0.024273 -11.14788 0.0000
R-squared 0.954 Mean dependent var -5.656403
Adjusted R-squared 0.952669 S.D. dependent var 0.566970
S.E. of regression 0.123348 Akaile info critenrion -1.297268
Sum squared resid 0.83617 Schwarz criterion -1.190694
Log likelihood 40.62078 F-statistic 574.6404
Durbin-watson stat 1.341188 Prob(F-statistic) 0.000000
CONCLUSIONS
In according to the obtained results, we can conclude that for first type models:
• The simple and appropriate model to predict the mean drops diameter in a spray column with dimensionless variables is based on the Eo number with 8.1% error. In addition, using this model in the high velocity systems could be strongly proposed.
• The priority of dimensionless parameters for modelling in this field is Eo, We and Re respectively.
For second type models:
• The best and appropriate model in this case is an equation including σ ∆ρ, , dN and u as independent
variables. However, if the data for u is not reliable, the model shown in table 6 (the model without u) could be proposed.
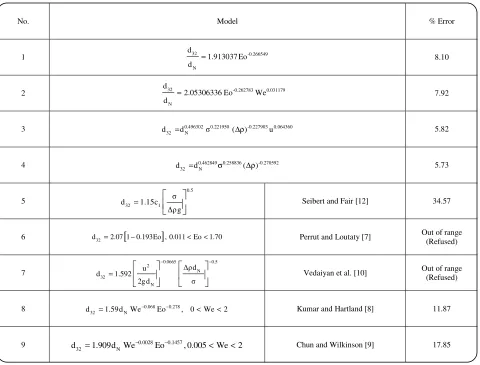
Table 7: Selected correlations for drop size distribution in the spray columns.
% Error Model
No.
8.10
32 -0.266549
N
d
1.913037 Eo d =
1
7.92
32 -0.262783 0.031179
N
d
2.05306336 Eo We d =
2
5.82
0.496302 0.221950 -0.227903 0.064360 32 N
d =d (∆ρ) u
3
5.73
0.462849 0.258836 -0.270592 32 N
d =d σ (∆ρ)
4
34.57 Seibert and Fair [12]
0.5
32 1
d 1.15c g
=
5
Out of range (Refused) Perrut and Loutaty [7]
[
]
32
d =2.07 1 0.193Eo , 0.011− <Eo<1.70
6
Out of range (Refused) Vedaiyan et al. [10]
0.0665 0.5
2
N 32
N
d u
d 1.592 2g d
− −
=
7
11.87 Kumar and Hartland [8]
0.068 0.278
32 N
d =1.59d We− Eo− , 0<We<2
8
17.85 Chun and Wilkinson [9]
0.0028 0.1457
32 N
d =1.909d We− Eo− , 0.005<We<2
9
• In according to the error results, the best and appropriate model is an equation based on the dN, σ and
∆ρ with 5.73% error (according to table 6).
• Based on the results of statistical analysis, it is proposed to justify C1 coefficient in Eq. 4 equal to one, to obtain appropriate accuracy in modelling of these models.
Nomenclature
c1 Drop size correction factor in Siebert’s correlation (=1) d32 Sauter mean drop diameter, mm d Drop diameter, mm di i th drop, mm E Drop Inertia g Gravity, m/s2 n Number of drops in the sample u Nozzle velocity, mm/s
Greek Symbols
∆ρ Density difference between phases, g/cm3 µc Continuous phase viscosity, cp
µd Dispersed phase viscosity, cp
ρc Continuous phase density, g/cm 3
ρd Dispersed phase density, g/cm3
σ Interfacial tension, dyne/cm
Dimensionless Numbers
We “Weber” dimensionless number, 2 N d u
Re “Reynolds” dimensionless number, u dN µ
Eo “Eotvos” dimensionless number, 2 N d g
REFERENCES
[1] Katsuroku Takahashi, Susumu NII, Behavior of Multistage Mixer-Settler extraction Column, Memoirs of the School of Engineering Nagoya University, 51(1), (1999).
[2] Hughmark G.A., Liquid-Liquid Spray Column Drop Size, Hold-up, and Continuous Phase Mass Transfer, I & EC Fundamentals, 6(3), p. 408 (1967).
[3] Kumar A., Hartland S., Unified Correlations for the Prediction of Drop Size in Liquid-Liquid Extraction Columns, Ind. Eng. Chem. Res., 35, p. 2682 (1996). [4] Desnoyer C., Masbernat O., Gourdon C.,
Experimental Study of Drop Size Distributions at High Phase Ratio in Liquid-Liquid Dispersions, Chemical Engineering Science, 58, p. 1353 (2003). [5] Harold R., Null and Horner F. Johnson, Drop
Formation in Liquid-Liquid System from Single Nozzles, AICHE Journal, 4(3), p. 273 (1958). [6] Brodkorb M.J., Bosse D., Reden C., Gorak, A., Slater, M.J.,
Single Drop Mass Transfer in Ternary and Quaternary Liquid/Liquid Extraction Systems, Chemical Engineering and Processing, 42, p. 825 (2003). [7] Michel Perrut, Jean-Yves Clavier, Supercritical Fluid
Formulation: Process Choice and Scale-up, Ind. Eng. Chem. Res., 42, p. 6375 (2003).
[8] Perrut M., Loutaty R., Drop Size in a Liquid-Liquid Dispersion: Formation in Jet Break-up, Chem. Eng. J., 3(3), p. 286 (1972).
[9] Kumar A., Hartland S., Prediction of Drop Size Produced by a Multiorifice Distributor, Trans. Inst. Chem. Eng., 60, p. 35 (1982).
[10] Chun B. S., Wilkinson G. T., Drop Size and Hold-up in Countercurrent Extraction with Supercritical CO2 in Spray Column, Ind. Eng. Chem. Res., 39, p. 4673 (2000).
[11] Vedaiyan S., Degaleesan T. E., Laddha G. S., Mean Drop Size & Characteristic Velocity of Drop Swarm in Spray Column, Indian J. Technol., 12, p. 135 (1974).
[12] Seibert A. F., Fair J. R., Hydrodynamics and Mass Transfer in Spray and Packed Liquid-Liquid Extraction Columns, Ind. Eng. Chem. Res., 27, p. 470 (1998).
[13] Sudheer K.P., Panda R.K., "Digital Image Processing for Determining Drop Sizes from Irrigation Spray Nozzles, Agricultural Water Management, 45, p. 159 (2000).
[14] Barhate R.S., Ganapathi P., Srinivas1 N.D., Raghavarao K.S.M.S., Drop Formation in Aqueous Two-Phase Systems, Journal of Chromatography A, 1023, p. 197 (2004).
[15] Nandkishor K. Nere, Doraiswami Ramkrishna, Evolution of Drop Size Distributions in Fully Developed Turbulent Pipe Flow of a Liquid-Liquid Dispersion by Breakage, Ind. Eng. Chem. Res., 44, p. 1187 (2005)
[16] Babinsky E., Sojka P.E., Modeling Drop Size Distribution, Progress in Energy and Combustion Science, 28, p. 303 (2002)