R E S E A R C H
Open Access
Research on establishing numerical model
of geo material based on CT image analysis
Gang Luo
1*, Shaokang Pan
1, Yulong Zhang
1, Hanghang Jia
1and Liang Chen
2Abstract
Geotechnical engineering material is a kind of heterogeneous composite material. The stone, mineral, gravel, hole, and crack contained in it have different physical and mechanical properties, and their responses to external forces are very different. For example, stress distribution, crack propagation, and failure mode are closely related to material heterogeneity and microstructure. This paper presents a finite element model method for processing CT images of geotechnical materials by using digital image technology. This paper presents a finite element model method for processing CT images of geotechnical materials by using digital image technology. The theory of digital image processing is applied to geotechnical CT image processing to realize pseudo-color enhancement of CT image, and the histograms of different geotechnical CT numbers are obtained. Canny operator is used to detect the edge of geotechnical CT image, and the binary image of geotechnical microstructure is obtained. According to the color change of pseudo-color enhanced image and CT histogram, the meso-structure and variation of rock and soil can be quantitatively analyzed. The finite element model established by this method can fully consider the heterogeneity of geotechnical materials, especially the effect of void distribution on the mechanical properties of geotechnical materials.
Keywords:CT image, Image processing, Geo material, Numerical modeling
1 Introduction
With the in-depth study of geotechnical mechanical prop-erties, scholars pay more and more attention to the study of its meso-mechanical properties, resulting in a variety of meso-structural finite element models, such as lattice model, beam-particle model, random aggregate model, and random mechanical properties model [1]. Most of the above models are based on random sampling method and statistical knowledge. Although the aggregate distribution and shape of the model has been more and more close to the real structure of rock and soil, but inevitably there are differences with the real meso-structure of rock and soil. Studying the rupture process of geotechnical materials has important theoretical significance and practical value for evaluating the safety state of geotechnical engineering, un-derstanding the stability of geotechnical engineering
struc-ture, taking reasonable supporting measures, and
improving the design level of geotechnical and under-ground structural engineering. The nonlinearity of
macroscopic mechanical behavior of geotechnical mate-rials in the process of fracture is due to the heterogeneity of their meso-structure [2–4]. Under the same experimen-tal and loading conditions, the true microstructure and the mechanical properties of various meso-media play a decisive role in the stress and deformation responses of the specimens. Therefore, further research on the effective methods to measure the spatial distribution of the meso-media in geotechnical materials determines the con-stitutive relations and descriptive parameters of each medium and introduces them into the numerical model, so as to study and observe the mechanical properties and failure laws of geotechnical materials more comprehen-sively and more in accordance with the natural laws [5,6]. With the development of digital image processing tech-nology, digital image processing technology is introduced to study the internal structure of rock and soil. Digital image processing technology provides convenience for computer reconstruction, processing, and simulation of image data. The application of digital image processing technology to study the damage characteristics of rock and soil, especially the damage characteristics of rock and * Correspondence:[email protected]
1School of Highway, Chang’an University, Xi’an, Shaanxi, China
Full list of author information is available at the end of the article
soil, can be the development of related research fields. The effective testing technology [7–10] is provided, and the freeze-thaw rock mass can be described and described more accurately by means of numerical simulation, which reflects the actual stress of rock and soil. The finite elem-ent method based on digital image processing provides a new way to study the mechanical properties of geotech-nical materials under freeze-thaw environment. Digital image processing (DIP) coupled with finite element method (FEM) is another effective way to correlate the fine microstructure of geotechnical materials with the macroscopic mechanical response [11, 12]. Yuezhongqi proposed the digital image finite element analysis method (DIP-based FEM) for geotechnical engineering materials. This method integrates digital image processing theory, geometric vector conversion technology, and finite elem-ent mesh automatic generation principle [13–16]. Firstly, the real meso-structure of material is obtained by digital image algorithm, and then vectorized. The finite element mesh of material meso-structure is generated by
auto-matic mesh generation technology. The effect of
meso-structure on stress distribution is studied by finite element method. But in this method, the digital image processing technology is only aimed at grayscale image [17,18].
Later, Chen Sha improved Yue’s method [19–21], used the variation of values in the HSI (hue, saturation, inten-sity) color space to obtain the meso-structure of the
ma-terial, and combined with FDM to analyze the
mechanics of heterogeneous materials; the failure modes of granite under uniaxial compression and uniaxial dir-ect tensile loading are simulated. Then, some scholars apply digital image processing technology to seepage analysis, Sheng et al. [22]. By processing the digital image of rock mass, the relationship between the value and the distribution of permeability coefficients of differ-ent structures of rock mass is established based on the different brightness values of the image corresponding to different structures of rock mass, and the distribution of physical parameters is input into the developed nu-merical model of multi-physical hazard of rock mass based on FEMLAB. The unsteady seepage process in fractured rock mass is analyzed. Compared with the stat-istical sampling method, this method has obvious advan-tages, and the results can better reflect the real physical phenomena. J. Su and Z. Liu et al. [23, 24] used the method of digital image processing to characterize the heterogeneity of rock and soil by using the value in the color space of the moon sign. The whole process of the heterogeneous rock and soil rupture under the com-bined action of external load and seepage disaster was studied. The strength and overall permeability of the specimen showed obvious anisotropy in macroscopic. Niknejad et al. [25] used image processing methods such
as image segmentation and edge detection to process small-scale crystalline rock images, obtained the trans-granular and intertrans-granular micro-cracks, characterized the network of micro-cracks in rock and soil, and solved the permeability coefficient of samples; the effects of transgranular crack network and intergranular fracture network on the permeability of samples were studied. Y. Liu et al. [26] established the discrete element calcula-tion model by using the CT image of the subgrade material. Sanchez-Romero et al. [27] established the con-cept model of the soil-rock mixture microstructure by using the digital image processing technology and estab-lished the numerical model by the vector method. L. Tan et al. [28] studied the three-dimensional microstruc-ture of the rock and soil based on the CT image,
com-bined with ANSYS, and a simplified numerical
calculation model is established. L.I. Meng-Yi and J. Sheng et al [29–31] applied CT images to establish the finite element plane model of asphalt mixture.
According to past experience, this paper takes self-made porous rock and soil materials and aggregate rock and soil materials, for example, obtains its internal structure image by CT technology, studies the method of image feature in-formation extraction and bitmap vectorization, and estab-lishes its numerical calculation model. The theory of digital image processing is applied to geotechnical CT image processing to realize pseudo-color enhancement of CT image, and the histograms of different geotechnical CT numbers are obtained. Canny operator is used to detect the edge of geotechnical CT image, and the binary
image of geotechnical microstructure is obtained.
Pseudo-color enhancement of geotechnical CT image can improve the resolution of CT image and reduce the error of visual judgment. According to the color change of pseudo-color enhancement image and CT number histo-gram, the meso-structure and variation of geotechnical can be quantitatively analyzed.
2 Proposed method 2.1 Digital image processing
The methods of digital image processing are divided into two categories: the airspace method and the transform domain method. Space-domain method is to treat the image as a set of pixels in the plane and directly operate the pixels in the space where the
image is located, that is, directly process the
The transform domain method is to transform the image orthogonally. The image is processed indirectly in the transform domain of the image and then inversely transformed into the spatial domain. Because the trans-form domain algorithm has higher requirement for sys-tem memory, this paper only uses the airspace method. In the following processes of image enhancement and image segmentation, spatial filtering is used. Spatial fil-tering algorithm is essentially a convolution operator for image processing and is a small area of local image pro-cessing operations. Convolution operation is a transform domain method, which modifies the Fourier transform of the image to realize the image processing. Setting the original imageF, the processed image isH,Gis a convo-lution operator, and m×n is an array; the array Gand digital imagesFof the convolution processing is defined as:
H=F*G(* represents convolution)
H ið Þ ¼;j X XF mð ;nÞG ið−m;j−nÞ ð1Þ
In order to make the calculation intuitive and simple, the convolution operation is generally converted from the operation in the transform domain to the operation in the spatial domain. The concrete method is to trans-form the convolution operation into the trans-form of multi-plication of two matrices. The edge of an operator is odd, and inG, the elements are symmetrically located in the center of the operator; in practice, the filter matrix with smaller order convolution operator G is the tem-plate used in detection, also known as convolution kernel.
The characteristics of digital image processing are as follows:
1. Good reproducibility
As long as the input image and processing method re-main unchanged, the digital image processing results will not change, can be well reproduced, and have good re-peatability. There is no randomness in visual processing.
2. High accuracy
Current technology can transform a digital image into a two-dimensional array of arbitrary size. For a com-puter, no matter the size of the array or the number of bits of pixels, its processing program is the same. That is to say, as long as the array parameters in the program
are changed, the processing of any number of
high-precision images can be realized in principle.
3. Quantification
Digital image processing is easy to obtain quantitative results, which is an incomparable advantage of other processing methods.
4. Flexibility
Digital image processing can not only complete linear operations but also complete nonlinear operations. All operations that can be expressed by mathematical for-mulas or logical expressions can be implemented by digital processing.
2.2 CT scanning principle
CT recognition technology is an advanced nondestructive testing technology to reconstruct CT images by transmit-ting X-rays to rotate around objects and collectransmit-ting attenu-ation informattenu-ation of X-rays. The working principle of CT identification technology can be expressed as fixing X-ray source and detection receiver on the same rack, synchron-ously scanning them with the detected object, and scan-ning the scanner rack at each angle of rotation; after each scan, the scanner rack rotates to the next angle for the next scan, so repeating the process repeatedly, you can collect many sets of scan data. If the scanner frame is shifted every time and scanned once, 256 data can be obtained. Then, the scanner frame is scanned once for every rotation of 1°. If the scanner frame is rotated 180°, 256 × 180 = 46,080 data can be obtained. Finally, the scan-ner information is processed, and a real digital image of a scanned object can be obtained.
The mathematical basis and principle of CT nonde-structive identification technology can be described as CT scanning equipment mainly consists of radioactive sources and detectors. The X-ray emitted by the source can penetrate any non-metallic material, and the pene-tration ability of the X-ray is different when the wave-length of the X-ray is different. The absorptive capacity of different non-metallic materials to X-ray wavelength at the same wavelength is also different. Generally, the higher the density of matter, the higher the atomic num-ber of matter, the stronger the absorption of X-ray. When the X-ray emitted by the radiation source in the CT machine penetrates the detected object, the intensity of the X-ray attenuates because it is absorbed by the ob-ject. The attenuation follows the equation:
I¼I0e−μx¼I0e−μmρx¼
Z Emax
0
I0ð ÞE e−
Rd
0μð ÞEdsdE ð2Þ
In the form:I0isXradiation which penetrates the light intensity of the detected substance (ev/m2·s), I is X
density of measured substances (g/cm3); x is the X ray penetration length (cm).
Generally speaking, the absorption coefficient per unit mass of the object to be detected is related to the wave-length of the radiation emitted by the source. If the radi-ation X is constant, the wavelength is also fixed. Therefore, the absorption coefficient per unit mass and the density of the substance to be measured can be com-bined together, that is, the absorption coefficient per unit volume:
μ¼μmρ ð3Þ
Formula: for the measured object to X-ray absorption coefficient per unit volume; for water 0.1, its absorption coefficient isM. During the scanning process, projection valuePis used to record and expressX radial initial ray intensity I0and X, the relationship between the attenu-ation I value of the rays passing through the measured object. The computer Xattenuation information of the ray projection valuePfollows the pattern:
P¼1nI0
I ¼μmρX ¼
Xn
i¼1
μiρiXi ð4Þ
In the form: Xi is the X of every interval of the ray path. μi is the local attenuation coefficient, and the total attenuation of the X rays depends on the local attenu-ation coefficient. μis the line integral for scanning path. When the interval of the scanning path is accumulated, the small thicknessXishould be taken into account. CT scanning is essentially a process of accurately measuring many line integrals. Therefore, in order to obtain satis-factory scanning image quality, it is necessary to record enough projection values and measure them within 180°.
2.3 Gray histogram
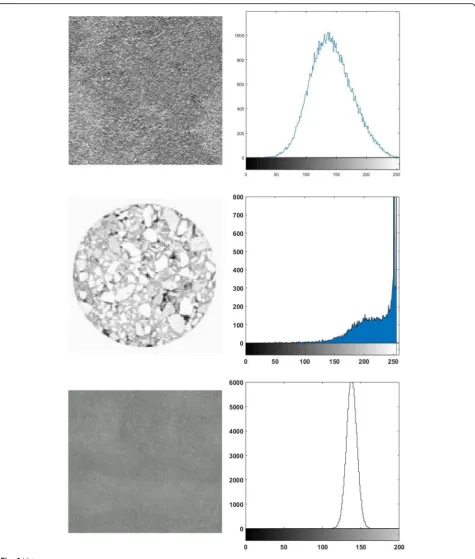
Gray histogram is the probability density distribution function (PDF) of gray level, and its integral function (or area function) is the cumulative distribution function (CDF), which reflects the relationship between gray level and frequency of gray level in an image. In the gray histogram, the abscissa is the gray level, and the ordinate is the frequency (pixel number) of the gray level appear-ing in the image.
The mathematical expression of grayscale histogram can be written as:
P Sð Þ ¼k
nk
nk¼0;1;⋯L−1 ð5Þ
The upper levelSkis thekgray level of the imagef(x,
y), and the number of pixels nk in the middle of f(x,y) gray valuek.nis the total number of pixels in the image. From the definition, an estimate of the frequency of Sk
occurrence is given byP(Sk), so the histogram shows the distribution of the gray value in the image.
CT scanning image is a gray image composed of a large number of projection data to solve the density dis-tribution functionf(x,y) of the detected material. Essen-tially, it is a gray image composed of CT numbers reflecting the change of the density inside the rock mass. The distribution of different materials inside the rock mass can be reproduced in the image through the change of the gray value of the image. The evolution of meso-damage of rock and soil during loading process will cause the change of internal structure of rock and soil, and the change of gray value appears on CT image. Therefore, we can study the evolution process of rock and soil damage based on the gray histogram of image.
The gray scale of the image, the average brightness, and contrast of the whole image are the important basis for further processing. At the initial stage of loading, the gray distribution of CT images is relatively narrow, caus-ing the details of the image to be unclear. Gray histo-gram correction technology can make the gray distance of the image open or make the gray distribution uni-form, thereby increasing the contrast and achieving the purpose of image enhancement. The principle is to normalize the histogram first and normalize the original gray scale [Z1,Zk]; it is [0, 1]. Set any one of the grayscale
Znormalization tor, any gray levelZ'of the transformed image is normalized to S. r, s satisfy 0≤r≤1, 0≤s≤1.
Histogram correction is the calculation of the follow-ing formula:
ð6Þ
Formula:T(r) is a transformation function; the follow-ing conditions must be satisfied:
1. T(r) is in the interval of 0≤r≤1;T(r) is a single valued function and monotonically increases. 2. T(r) in 0≤r≤1 satisfies 0≤T(r)≤1.
The first condition guarantees that the order of the gray level of the image from white to black remains un-changed. The second condition guarantees that the gray value of the pixel after mapping is within the allowable range.
the effect of enhancing the overall contrast of the image. Probability theory has proved that any cumulative bution function (CDF) obeys normalized uniform distri-bution. This conclusion makes the gray equalization algorithm evolve into integral form.
T rð Þ ¼L A
Z r
0
h xð Þdx ð7Þ
Formula:h(x) is the gray frequency functionAfor the image area, that is, the total pixelLis the maximum gray level, generally take 255. For discrete images, the upper form evolves into the following summation form:
T rð Þ ¼L A
Xr
i¼0
hi ð8Þ
The general steps of grayscale equalization are:
1. The gray levelSk(k= 0, 1, …,L−1) of the original
image is counted, and the number of pixelsnkof
each gray level is calculated.
2. The gray histogram of the original image is calculated byPðSkÞ ¼nnk k¼0;1;⋯L−1 3. Calculate the cumulative histogram of the original
image.
tk ¼
Pk
i¼0nni¼
Pk
i¼0PsðSiÞ0≤Sk≤1k= 0, 1,…,L−1
4. Rounding calculation:tk¼ int½ðL−1ÞtkþkL 5. Mapping relations:Sk→tk
6. Count the number of pixelsnkof the new histogram gray level and calculate the new histogramPðtkÞ ¼nnk
2.4 Image edge processing
The edge of an image is the reflection of discontinuous gray change and texture structure change of local charac-teristics. It marks the end of one region and the beginning of another region. It is the collection of pixels with step change or roof change in the gray level of surrounding pixels. Edge is the place where the gray level changes most dramatically. Traditional edge detection is to use this fea-ture to differentiate or calculate the second-order differen-tial of each pixel to determine the edge pixels. The peak value of the first-order differential image corresponds to the edge point of the image, and the zero-crossing point of the second-order differential image corresponds to the edge point of the image. For simple first-order derivative operation of image, it can only detect edges in specific di-rections because of its fixed orientation, so it is not univer-sal. In order to overcome the disadvantage of first derivative, image gradient operator is used to calculate the image. The gradient corresponds to the information of the
first derivative, and the gradient operator is the first de-rivative operator. For a continuous imagef(x,y), the gradi-ent at the point (x,y) can be expressed as a vector. SupposeGx,Gy, it is used to representf(x,y), along the dir-ectionxand directionygradient, and the gradient vector can be expressed as:
∇f xð ;yÞ ¼ Gx Gy
¼
∂f xð ;yÞ ∂x ∂f xð ;yÞ
∂y 2 6 6 4 3 7 7
5 ð9Þ
The gradient direction is the fastest change direction of the image gray value.θgindicates gradient direction:
θg ¼ tan−1 fy
fx ð10Þ
The rate of change in direction θg (the magnitude of the gradient) is:
g xð ;yÞ ¼j∇f xð ;yÞj
¼
ffiffiffiffiffiffiffiffiffiffiffiffiffiffiffiffiffiffiffiffiffiffiffiffiffiffiffiffiffiffiffiffiffiffiffiffiffiffiffiffiffiffiffiffiffiffiffiffiffiffiffiffiffiffiffi
∂f xð ;yÞ ∂x
2
þ ∂f xð∂y;yÞ
2
s
ð11Þ
gis a gradient operator, and the amplitude calculation is modular to 2 (corresponding to Euclidean distance). The equivalent norm can also be used.
g xð ;yÞ ¼ ∂f xð ;yÞ ∂x
þ ∂f xð∂;yÞ y
ð12Þ
Or the infinite norm is used:
g xð ;yÞ ¼ max ∂f xð ;yÞ
∂x
; ∂f xð∂;yÞ y
ð13Þ
According to the actual situation in the field of digital image processing to use discrete form, the above differ-ential difference is used instead of:
fxðx;yÞ ¼ f xð ;yÞ−f xð −1;yÞ ð14Þ
fyðx;yÞ ¼f xð ;yÞ−f xð −y−1Þ ð15Þ
The second derivative information is a sign of the change of the first derivative. In some cases, if the gray level changes uniformly, the boundary may not be found by using the first derivative only, then the second deriva-tive can provide useful information. The two derivaderiva-tive information is generally based on formulas in the field of digital image processing.
∇2f ¼∂ 2
f ∂x2þ
∂2 f
∂y2 ð16Þ
feature. There are several operators which use the first derivative extremum detection as follows:
(a) Roberts operator: A template as shown in Fig. 1. Edge detection based on this operator is generally very sensitive to noise.
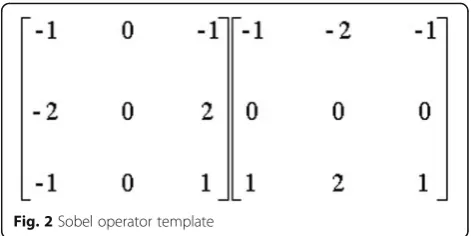
(b) Sobel operator: A template as shown in Fig. 2 is convoluted vertically and horizontally to obtain lumi-nance difference. Different pixel positions are weighted. Generally, edge detection based on this operator is not accurate.
(c) Prewitt operator: Two templates, as shown in Fig.3, are used to convolute the two templates, the upper and lower neighbors in the vertical direction and the left and right neighbors in the horizontal direction.
Canny algorithm is used in many operations in this paper. Canny operator is a multi-scale spatial edge de-tection operator. It determines the image edge by finding the local maximum of the image gradient. The Canny operator can suppress noise, and there will not be many isolated edge pixels. The specific steps are as follows:
1. First, two dimensional Gauss filter templates are used to filter the image to eliminate noise. 2. Find the sum of the partial derivativesGxandGy
along the two directions of the image gray level by using the differential operator and get the direction of the gradient.
3. The gradient direction of the edge is roughly divided into four kinds (horizontal, vertical, 45°, and 135° directions). Each direction is compared with different neighboring pixels to determine local maxima. If the gray value of a pixel is not the largest compared with the gray value of the two pixels before and after the gradient direction, then the pixel value is set to 0, that is, not the edge. 4. Use histogram to calculate the two thresholds. If
the detection result is larger than the low threshold but smaller than the high threshold, it is necessary to see if there are edge pixels in the neighborhood pixels of this pixel that exceed the high threshold: if there is, it is the edge;
otherwise, it is not the edge.
Comparing the edge detection results of several exist-ing operators, Roberts operator can only roughly detect the outline, because this operator is very sensitive to gra-dient, so it produces some isolated points, which make the edge connection discontinuous and more discon-tinuous; Sobel operator and Prewitt operator do not detect the edge in some directions, and there is a con-siderable length of the break. This is because the two operators are not isotropic; Laplacian operator is a lin-ear, isotropic second-order differential operator; the detection effect is relatively clear, but the detection re-sults of the boundary are too wide, and the positioning accuracy of the edge is not high. Canny operator sup-presses noise, and there are no isolated edge pixels. The location is accurate and the detection effect is the best. Therefore, the Canny operator is used to realize the edge detection of frozen soil CT images.
3 Experimental results and discussion
Due to the limitation of the experimental conditions, the size of the specimen is 2550 mm. During the processing, some large aggregate will be cut off. In order to under-stand the actual size distribution of the rock and soil in-side the specimen, the rock and soil in the CT image of the specimen in the initial state are identified and ana-lyzed statistically. The purpose of determining the basic dimensions of research objects is to understand the na-ture of the research questions. Fracna-ture of geotechnical materials is an evolutionary problem, and its mechanism cannot be understood thoroughly only by macroscopic phenomenological method. At the same time, the
Fig. 1Roberts operator template
Fig. 2Sobel operator template
microscopic or microscopic mechanisms of many com-plex phenomena are much simpler, and their combin-ation and interaction can show complex behavior. Through the CT scanning experiment, the CT scanning images (two-dimensional images) of a certain scanning plane of rock and soil can be obtained. A set of parallel two-dimensional scanning CT images can be obtained by multiple parallel scanning, and the cross-sectional images of meso-structure of frozen rock and soil in different posi-tions can be obtained. These two-dimensional scanning CT images can be observed. Three-dimensional recon-struction of fault sequence images is realized by MATLAB. MATLAB software provides a variety of matrix operations, image manipulation, image display functions, and image processing tools and has been widely used in image processing. MATLAB has many functions that can be used for image processing. MATLAB’s powerful image processing function makes image processing more con-venient. This paper uses the regionprops function in MATLAB to obtain the pore structure parameters, such as equal area circle radius, shape center coordinates, equal area ellipse long and short axis, and long axis angle. Be-cause the maximum value of the pore shape coefficient is 0.87, the minimum value is 0.64, the average value is 0.72, and the pore shape is more regular, using equal area circle respectively. The two models were meshed with the same accuracy, and the number of grids was 1207 and 1202 respectively.
Heterogeneous distribution of aggregates, cement slurry, and pores in rock and soil forms different speckle structures. The non-linearity of macroscopic mechanical behavior of rock and soil under load is due to the het-erogeneity of its meso-structure. In the process of non-linear evolution, the disorder of the internal struc-ture of rock and soil may be strongly amplified and ul-timately show significant macroscopic differences. Under basically the same experimental and loading conditions, the real meso-structure of rock samples and the mech-anical properties of various meso-media play a decisive
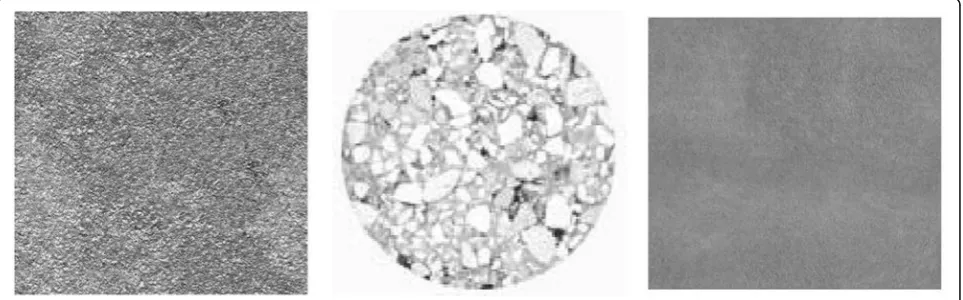
role in the stress and deformation response of the speci-men. The CT image of porous materials in Fig.4 has a typical structural diagram, which can be directly set threshold value for segmentation and extraction of pores, the original gray scale image is transformed into binary image, and the image is scanned by CT. Different geotechnical materials are shown in Fig. 4, and the CT scanning image is obtained.
The size of each voxel in the CT image is 40 × 40 × 40μm3, and there are still micro-pores in the voxel. The gray value of each voxel reflects its internal structure. When the fracture or pore size is smaller than the spatial resolution, that is, the micro-crack or pore exists in the voxel, this part of the pore cannot be distinguished on the pixel scale, but these micro-cracks or pore changes will lead to the change of voxel density.
It can be seen that there is a large number of micro-pores smaller than CT resolution in voxels. In the above statistical analysis of gray value, before the appearance of cracks larger than CT resolution scale, the change of gray value is mainly caused by micro-cracks or pores in voxels. It can be seen that the interface between aggre-gate and matrix is easy to be destroyed with the increase of load when there is a large stress value at the interface between aggregate and matrix. For the above porous ma-terials, vectorization method can also be used to model, but if the extracted pore edge is not smoothed, it will lead to excessive number of elements and increase the amount of calculation.
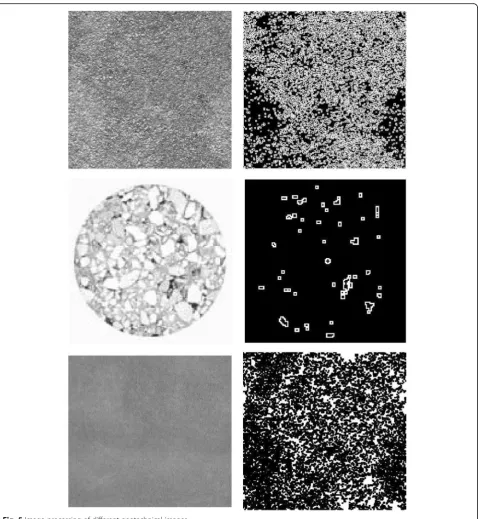
The edge image is vectorized by software. As shown in Fig.5, the thresholds are selected to segment the aggre-gate and pore regions. Fracture or pore size extracted from CT images should be larger than the spatial reso-lution of CT, so the extraction of fracture or pore is more limited by the spatial resolution of the system.
Because the gray value between the crack or pore and the matrix has a certain transition, it is not a sharp boundary, and the boundary is not just right for the whole pixel, as well as part of the volume effect; when
the threshold is selected for image segmentation, there will always be some voxels, their porosity is high, resulting in the gray value to reach the thresh-old value. It is divided into pores larger than CT resolution scale. If a single threshold is chosen, some crack details may be lost. In order to extract cracks more accurately, the segmentation of images with dif-ferent sizes or in difdif-ferent regions can be carried out by using multi-threshold method. However, extracting
cracks from a series of three-dimensional CT images will be a time-consuming task. The larger the fracture size, the easier it is to extract. Based on this, the method of fracture extraction is more suitable for analysis of cracks larger than CT resolution scale. In addition, it should be noted that the porosity calcu-lated from CT images is less than that measured by mercury injection and helium gas injection due to the limitation of the resolution of CT images.
At this time, the numerical model can be established by vectorization of the feature area edge. The grayscale histogram is shown in Fig.5.
According to Fig. 6, the meso-structure image of rock and soil is a binary image, and the closed interface
generation, each pixel will become a node of finite elem-ent, so that the generated mesh will be too dense and the finite element model will be generated. This is very difficult and will lead to the failure of further finite elem-ent numerical analysis. Therefore, mesoscopic structure images can not directly generate finite element meshes. In order to realize the next step of mechanical analysis, the discrete pixel data of mesoscopic structure images must be transformed into geometric vector information to realize the generation of finite element meshes.
4 Conclusions
Taking rock and soil as the research object, combining with micromechanics, experimental mechanics, statis-tical theory, industrial CT technology, and finite element numerical simulation method, the evolution process of internal damage of rock and soil under uniaxial com-pression is studied. The generation and development process of strain localization before failure is analyzed by strain field. The main work and understanding are as follows:
1. The damage variable and damage constitutive model of concrete are further studied. Based on the meso-test of damage evolution characteristics of concrete, different damage variables of concrete materials are defined by different methods, and corresponding damage evolution equations are established. The damage constitutive rela-tion is established on the basis of the piecewise damage evolution equation established by the number change. The damage evolution equation and damage constitutive relation established by the change of density damage number are related to the deterioration of macroscopic mechanical properties.
2. The difference of gray mean and mean square de-viation of CT images of different layers under differ-ent stress states reflects the inhomogeneity of the specimen. With the increase of load, the change of specimen volume causes the change of gray value. The gray mean value of the whole image goes through a process of increasing first and then de-creasing, while the gray variance decreases first and then increases correspondingly. Both of them change nonlinearly with the deformation of specimen. The percentage distribution of cracks in the specimen under different stress states was obtained, and the change of micro-cracks in voxels at the interface be-tween aggregate and cement slurry was obvious.
3. The larger the fracture size, the easier it is to ex-tract. Based on this, the method of fracture extraction is more suitable for analysis of cracks larger than CT reso-lution scale. In addition, it should be noted that the por-osity calculated from CT images is less than that measured by mercury injection and helium gas injection due to the limitation of the resolution of CT images.
Abbreviations
CDF:Cumulative distribution function; FEM: Finite element method; PDF: Probability density distribution function
Acknowledgements Not applicable.
About the authors
Gang Luo(corresponding author, e-mail:[email protected]) received the Ph.D. degree in tunnel and underground engineering from Southwest Jiao-tong University, Chengdu, China. He is currently a teacher in the School of Highway, Chang’an University, Xi’an, China. His research interests include sub-merged floating tunnel, controlled blasting technology and tunnel engineering.
Shaokang Panreceived the bachelor’s degree in civil engineering from Yangtze University, Jingzhou, China. He is graduate student in the School of Highway, Chang’an University, Xi’an, China. His research direction is tunnel engineering.
Yulong Zhangreceived the bachelor’s degree in civil engineering from Huaiyin Institute of Technology, Jiangsu, China. He is graduate student in the School of Highway, Chang’an University, Xi’an, China. His research direction is tunnel engineering.
Hanghang Jiareceived the bachelor’s degree in civil engineering from Tianjin Chengjian University, Tianjin, China. He is graduate student in the School of Highway, Chang’an University, Xi’an, China. His research direction is tunnel engineering.
Liang Chenreceived the bachelor’s degree in civil engineering from Chengdu University of Technology, Chengdu, China. He received the master’s degree and Ph.D in bridge and tunnel engineering from Southwest Jiaotong University, Chengdu, China. He is currently a engineer in Guangxi Communications Investment Group Co., Ltd., Nanning, China. His research direction is tunnel engineering.
Funding
This work was supported by national natural science foundation of China (No.51708042, 51508037).
Availability of data and materials Please contact author for data requests.
Authors’contributions
All authors take part in the discussion of the work described in this paper. Author GL wrote the first version of the paper. Authors SP, YZ, and HJ did part experiments of the paper, and LC proposed some modifications. All authors read and approved the final manuscript.
Competing interests
The authors declare that they have no competing interests.
Publisher’s Note
Springer Nature remains neutral with regard to jurisdictional claims in published maps and institutional affiliations.
Author details 1
School of Highway, Chang’an University, Xi’an, Shaanxi, China.2Guangxi Communications Investment Group Co., Ltd., Nanning, Guangxi, China.
Received: 29 October 2018 Accepted: 10 January 2019
References
1. Q.L. Yu, P.G. Ranjith, H.Y. Liu, et al., A mesostructure-based damage model for thermal cracking analysis and application in granite at elevated temperatures. Rock Mechanics & Rock Engineering48(6), 2263–2282 (2015) 2. A.A. Avramenko, A.I. Tyrinov, I.V. Shevchuk, et al., Dean instability of
nanofluids with radial temperature and concentration non-uniformity. Physics of Fluids28(3), 432–460 (2016)
4. A.G. Jara Chavez, F.O. Torres Vicencio, Acceleration algorithm for constant-statistics method applied to the nonuniformity correction of infrared sequences. Opto-Electronics Review23(1), 118–121 (2015)
5. A.W. Momber, Effects of target material properties on solid particle erosion of geomaterials at different impingement velocities. Wear319(1–2), 69–83 (2014)
6. M. Kumar, Y.H. Mao, Y.H. Wang, T.R. Qiu, C. Yang, W.P. Zhang, Fuzzy theoretic approach to signals and systems: static systems. Information Sciences418, 668–702 (2017)
7. Y. Wang, X. Li, Experimental study on cracking damage characteristics of a soil and rock mixture by UPV testing. Bulletin of Engineering Geology & the Environment74(3), 1–14 (2015)
8. H. Liu, G. Yang, W. Ye, et al., Analysis of ice content and damage characteristics of frozen rock based on pseudo-color enhanced CT image. Chinese Journal of Underground Space & Engineering12(4), 912-919 (2016) 9. Y. Zhang, L.I. Bin, G. Zhao, et al., Experimental research on acoustic emission
characteristics of plastic materials in microscopic damage process. China Measurement & Test41(1), 115-119 (2015)
10. W.P. Zhang, J.Z. Yang, Y.L. Fang, H.Y. Chen, Y.H. Mao, M. Kumar, Analytical fuzzy approach to biological data analysis. Saudi Journal Of Biological Sciences24(3), 563–573 (2017)
11. I. Keita, B. Sorgho, C. Dembele, et al., Ageing of clay and clay–tannin geomaterials for building. Construction & Building Materials61(7), 114–119 (2014)
12. W.Q. Shen, J.F. Shao, Some micromechanical models of elastoplastic behaviors of porous geomaterials. Journal of Rock Mechanics and Geotechnical Engineering9(1), 1–17 (2017)
13. Z. Yue, Digital representation of meso-geomaterial spatial distribution and associated numerical analysis of geomechanics: methods, applications and developments. Frontiers of Architecture & Civil Engineering in China1(1), 80–93 (2006)
14. Z. Zhu, Z. Dongb, Y. Wangc, Security analysis of a password-based authentication protocol proposed to IEEE 1363. Theoretical Computer Science352(1), 280–287 (2012)
15. O. Kardani, M. Nazem, M. Kardani, et al, On the application of the maximum entropy meshfree method for elastoplastic geotechnical analysis[J]. Computers & Geotechnics84, 68-77 (2017)
16. L. Sun, Y. Xie, H. Xiao, et al., Analysis of crack problems in layered half-spaces subject to uniform loadings over boundary surface. Chinese Journal of Applied Mechanics34(5), 862-868 (2017)
17. A. Fujiwara, T. Masuzawa, H. Fujiwara, Parallel algorithms for connected-component problems of gray-scale images. Systems & Computers in Japan 28(1), 74–86 (2015)
18. W.S. Tang, S.H. Jiang, S.L. Wang, Gray scale potential: a new feature for sparse image. Neurocomputing116(10), 112–121 (2013)
19. D. Dong, L. Shu, D. Wang, et al., Establishment of swine-penetrating craniocerebral gunshot wound model[J]. Journal of Surgical Research 199(2), 698-706 (2017)
20. S.H. Lee, C.W. Li, C. H. Liau, et al. Establishment of an Agrobacterium -mediated genetic transformation procedure for the experimental model orchid Erycina pusilla[J]. Plant Cell Tissue & Organ Culture120(1), 211-220 (2015)
21. Y. Qin, P. Tian, Y.U. Jiang, et al., Digital image model analysis of recycled concrete in meso-level. Journal of Henan University of Science & Technology38(2), 54-58 (2017)
22. J. Sheng, L.I. Fengbin, D. Yao, et al., Experimental study of seepage properties in rocks fracture under coupled hydro-mechanochemical process. Chinese Journal of Rock Mechanics & Engineering31(5), 1016–1025 (2012) 23. J. Su, W. Zhou, Y. Liu, et al., Effect of carbon black on dielectric and
microwave absorption properties of carbon black/cordierite plasma-sprayed coatings. Journal of Thermal Spray Technology24(5), 826–835 (2015) 24. Z. Liu, H. Zhu, L.U. Mingda, et al., Synthesis and catalytic activity of a
Strandberg-type molybdophosphate modified by organic cations. Chinese Journal of Applied Chemistry32(2), 214–220 (2014)
25. S. Niknejad, S. Esmaeili, N.Y. Zhou, The role of double twinning on transgranular fracture in magnesium AZ61 in a localized stress field. Acta Mater.102, 1–16 (2016)
26. Y. Liu, X. Zhou, Z. You, et al., Discrete element modeling of realistic particle shapes in stone-based mixtures through MATLAB-based imaging process. Construction & Building Materials143, 169–178 (2017)
27. A. Sanchezromero, J.A. González, J. Calbó, et al., Using digital image processing to characterize the Campbell-Stokes sunshine recorder and to derive high-temporal resolution direct solar irradiance. Atmospheric Measurement Techniques8(1), 183–194 (2015)
28. L. Tan, B. Zhu, S. Cao, et al., Influence of blade wrap angle on centrifugal pump performance by numerical and experimental study. Chinese Journal of Mechanical Engineering27(1), 171–177 (2014)
29. L.I. Meng-Yi, Creep characteristics analysis of asphalt mixture in meso-scale based on Drucker-Prager model. Journal of North China Institute of Science & Technology14(6), 96-100 (2017)
30. T.F. Fathani, D. Legono, D. Karnawati, A Numerical Model for the Analysis of Rapid Landslide Motion[J]. Geotechnical & Geological Engineering35(2), 1-16 (2017)