R E S E A R C H
Open Access
Exploring variation in measurement as a
foundation for statistical thinking in the
elementary school
Lyn D English
1*and Jane M Watson
2Abstract
Background:This study was based on the premise that variation is the foundation of statistics and statistical investigations. The study followed the development of fourth-grade students' understanding of variation through participation in a sequence of two lessons based on measurement. In the first lesson all students measured the arm span of one student, revealing pathways students follow in developing understanding of variation and linear measurement (related to research question 1). In the second lesson each student's arm span was measured once, introducing a different aspect of variation for students to observe and contrast. From this second lesson, students' development of the ability to compare their representations for the two scenarios and explain differences in terms of variation was explored (research question 2). Students' documentation, in both workbook and software formats, enabled us to monitor their engagement and identify their increasing appreciation of the need to observe, represent, and contrast the variation in the data. Following the lessons, a written student assessment was used for judging retention of understanding of variation developed through the lessons and the degree of transfer of understanding to a different scenario (research question 3).
Results:The results were based either on the application of the hierarchical SOLO model or on non-hierarchical clustering of responses to individual questions in the student workbooks. Students' progress throughout the lessons displayed a wide range of explanations for the estimate of a single student's arm span, general surprise at the variation in measurements, and a large variety of hand-drawn representations based on the values or frequencies of measurements. Many different representations were also created in the software for the single student measurements and for the comparison of measurements for the two scenarios. Although the students' interpretations of their plots were generally more basic than sophisticated, the results of the assessment indicated that many students had developed the ability to transfer their appreciation of variation to another context and could clearly explain the meaning of variation.
Conclusions:The findings highlight the importance of an early focus on variation and distribution, with meaningful activities that motivate students to conduct and observe measurements, together with creating both hand-drawn and software representations to relate their experiences.
Keywords:Elementary school; Graphical representations; Measurement; Statistical thinking; Variation
Background
Since the introduction of statistics into school mathem-atics curricula about 25 years ago (e.g. Australian Educa-tion Council 1991; NaEduca-tional Council of Teachers of Mathematics, 1989), there has been a growing awareness of the inadequacy of focusing solely on a procedural
ability to calculate statistics. In particular, informal in-ference, a precursor to formal inin-ference, has been highlighted as a foundational component that has not re-ceived the required attention especially in the elementary grades (Makar, in press). As described by Makar and Rubin (2009), informal inference is the process of using the evidence provided by data to answer questions beyond the data, acknowledging the uncertainty associated with the conclusion reached. Variation is the key to accepting a * Correspondence:[email protected]
1
Faculty of Education, Queensland University of Technology, Victoria Park Road, Kelvin Grove, Brisbane, Queensland, 4059, Australia
Full list of author information is available at the end of the article
conclusion with some degree of certainty (Franklin et al., 2007, p. 18).
Variation is in fact such a fundamental concept that gen-erally in the literature it is taken as an undefined term, as does Moore (1990). Variation and its associated form vari-ability, however, are complex words for fourth-grade stu-dents and need to be described in ways that allow stustu-dents to develop an understanding of the concept. Variation emerges when young students collect data and all of the values are not the same or when they plot the data andsee
that there are changes in the shape of the plot with gaps be-tween and clusters of points/values. At a basic level, statis-tical variation may be regarded as the difference in data values and spread seen in data representations. Once vari-ation is acknowledged, however, the purpose of a statistical investigation is to understand it, represent it, summarise it and perhaps control it (Franklin et al., 2007; Moore, 1990).
Acknowledging the importance of variation in informal inference, this study sought to expose fourth-grade students to the concept of variation through a measurement activity that would reveal two different types of variation: variation as ‘error’ in the repeated measurement of a single stu-dent's arm span and variation as the difference observed in single measurements of arm spans of a class of dents. In the first scenario, all students measured one stu-dent's arm span where the sources of variation did not lie in the entity itself (one arm span), rather in the measurers, the measurement processes and the instruments used. In the second scenario, variation arose from the entities be-ing measured (all students' arm spans), together with the measurers, their measurement processes and instru-ments. Students' documentation of their measurements, their explanations of the variations they observed, and their hand-drawn and software representations display-ing the variations formed the data for addressdisplay-ing our research questions.
In the first scenario, we primarily explored students' levels of development in detecting, representing (by hand and with technology) and explaining variation in linear measurement values. In the second scenario, our major research focus was on the plots students created with soft-ware and their ability to compare and explain differences between their representations in the two scenarios. Finally, to determine the success of the activity in terms of stu-dents' understanding of variation and their ability to apply this learning to a slightly different scenario, we adminis-tered an assessment 1 to 3 months after activity comple-tion. Specifically, our research questions were:
1. What are students' levels of development in detecting, representing and explaining variation in linear measure-ment values?
2. How do students develop the ability to compare and explain differences between representations in the two scenarios?
3. Do students demonstrate understanding of variation and transfer of that understanding through delayed as-sessment questions?
In addressing the background literature for the study, we consider the variation component of statistical thinking and inference, including its presence in na-tional curriculum documents. We then examine the role of variation in linear measurement and conclude with a review of the emergence of variation in statistical representation.
Variation
Variation lies at the heart of statistical reasoning - with-out it, statistics would not exist (Moore, 1990). Variation is linked to all aspects of statistical investigations (Cobb and Moore, 1997; Garfield and Ben-Zvi, 2007; Konold and Pollatsek 2002; Watson, 2006). Indeed, as Watson (2006) indicated, the reason data are collected, graphs are created and averages are computed is to ‘manage variation and draw conclusions in relation to questions based on phenomena that vary’(p. 21). Variation as the foundation of statistics provides the basis from which in-ferences can be drawn during statistical decision making. The confidence with which one can make a decision, however, depends on creating a balance between vari-ation and expectvari-ation (Watson, 2005). This balance is expressed in tests of significance or confidence intervals in senior secondary school courses, but learning to ap-preciate variation and its relationship to expectation (in this study prediction) needs to begin very early with ap-propriate hands-on experiences and student/teacher questioning.
the United States, the Common Core State Standards Ini-tiative (CCSSI) (2010)) introduces variation in the sixth grade, the first year where a concentrated focus on Prob-ability and Statistics is included in its curriculum. These curriculum recommendations are the result of earlier re-search and provide the motivation for further rere-search.
There has been substantial research on older students' and adults' awareness of variation (e.g. Makar and Confrey, 2005; Reading, 2004; Wild and Pfannkuch, 1999) but less so on how this understanding can be developed with young children. As numerous researchers have lamented, this neglect is a major concern especially given that secondary school and university students are usually ‘drilled’ in the use of statistical techniques without appreciating or under-standing why, when or how these are applied sensibly to a range of situations (Bakker, 2004; Garfield and Ben-Zvi, 2005; Reading, 2004). The sentiments of Pfannkuch (2005) encapsulate these concerns: ‘Teaching has not focused on enculturating students into variation-type thinking and reasoning approaches. Much needs to be learnt about how to cultivate and develop this type of reasoning in students’(p. 84).
The studies on young learners' awareness of variation have indicated the presence of a primitive understanding that needs to be integrated, revisited and emphasised in statistics learning from the earliest grade levels (Garfield and Ben-Zvi, 2007; Lehrer and Kim, 2009; Lehrer et al., 2011; Watson and Kelly, 2002a, 2002b). The research-based classroom suggestions from these studies, how-ever, are not being adopted in many classrooms because teachers lack the pedagogical content knowledge to make specific links to variation when they implement activities in data and chance (Watson, 2013). Explicit discussion of variation and its application across the cur-riculum is needed throughout the elementary school years, before students meet formal measures such as standard deviation in the secondary school years. In-structional approaches to developing an understanding of variation in the earlier grades have received limited attention. As Garfield and Ben-Zvi (2005) noted, design-ing a long-term program that will nurture this under-standing is a complex and challenging endeavour. Their suggestions for intervention were considered in planning the present classroom activity.
Assessing the overall outcomes of instructional ap-proaches has also received limited attention. Watson et al., (2003) developed a survey instrument in the con-text of a study involving lessons emphasising variation in grade levels 3, 5, 7, 9 (Watson and Kelly, 2002a, 2002b). The outcomes suggested four levels of increasing appreciation of variation: ‘prerequisites,’ including inter-preting the context, simple graph reading and intuitive chance reasoning;‘partial recognition,’ including putting ideas in context but focusing on single aspects and
neglecting others; ‘applications,’ including consolidating ideas in context but inconsistency on the most salient features; and‘critical aspects,’employing complex justifi-cation or critical reasoning. Although assessment in the present study was more general than that of the Watson et al. survey, their research suggests levels of develop-ment that are useful for assessing learning outcomes.
Variation in linear measurement
In basic terms, linear measurement may be viewed as ‘a comparative property of objects that embodies the amount of one-dimensional space between endpoints of the ob-jects, which can be compared or quantified’(Szilagyi et al., 2013, p. 583). Drawing on the literature, Szilagyi et al. cited numerous competencies needed for length measurement, including awareness of attribute, unit-attribute relations, unit iteration, proportionality and the relation between number and measurement. Transitivity and conservation are also important features. Apart from Lehrer's research (e.g. Lehrer et al., 2011), which we subsequently address, the focus on the important role of statistical foundations in the development of understanding of length measurement has been largely neglected.
The lack of measurement connectivity across other strands of the mathematics curriculum has been la-mented by Australian educators (Lowrie et al., 2012) with respect to the recently implemented curriculum,The Australian Curriculum: Mathematics(Australian Curricu-lum, Assessment and Reporting Authority 2013b). Their concerns reflect repeated calls for more links within and across topics and disciplines with similar conceptual underpinnings (e.g. Bobis et al., 2009). Although meas-urement understandings have been linked to the devel-opment of geometry, number and algebra (e.g. Booker and Windsor, 2010; Bragg and Outhred, 2004), few studies have addressed connections with statistical liter-acy. Lehrer's research (e.g. Lehrer, 2007; Lehrer and Kim, 2009; Lehrer et al., 2011), however, has used measurement in developing students' appreciation of measures of centre and of variability. As an initial step in developing statistical reasoning, Lehrer and his colleagues engaged students in generating variability through measurement error. The findings of their research highlighted the importance of student interactions, where they made visible their argu-ments for a measure's validity and considered situations where such measures might be insufficient.
Ministry of Education, 2009), it does not appear in relation to measurement. This is surprising given that variation is inherent in the entire measurement process - in the entity being measured, how the measurer undertakes the measur-ing process, the instruments used and how the measure-ments are interpreted. As a core understanding in the development of statistical literacy, variation includes inter-preting and critically assessing various forms of measure-ment data. One of the goals of the present activity was the development of an appreciation of variation in measuring and measurements, and of the need for accuracy in meas-urement. Children need to understand what it means to make an accurate measurement, why accuracy is import-ant, and the variation that can be expected in a measure-ment, especially if it is repeated (Lehrer, 2007; Watson and Wright, 2008).
The last understanding, of accuracy of measurement, is rarely addressed in the elementary curriculum yet as Konold and Pollatsek (2002) emphasised, it is an import-ant context for various interpretations of average, an in-terpretation they refer to as ‘signal in noise’ (p. 268). From this perspective, each measurement is an estimate of an unknown yet specific value. We argue that con-necting statistical and measurement topics can provide a powerful tool for targeting these currently neglected core understandings in the elementary curriculum and for addressing the long-standing concerns regarding stu-dents' difficulties with measurement (Smith et al., 2011).
Representing variation
Representing data in the elementary school years is typic-ally limited to a few traditional graph types considered manageable by young students, such as picture graphs and simple column graphs, although recently using tech-nology to produce these graphs has been suggested (see Australian Curriculum, Assessment and Reporting Authority 2013b, year 3). The focus has been largely on what types of graphs should be taught and when (e.g. Friel et al., 2001) and on appropriate scaling, labelling and directionality of plots (e.g. Leinhardt et al., 1990; Mevarech and Kramarsky, 1997). The ability of young students to create a wide range of representations of their own choosing is frequently underestimated (English, 2012, 2014; Russell, 1991). With a greater variety of graphs and other displays appearing in the media and elsewhere (e.g. Wall and Benson, 2009), students are being exposed more than ever to statistical representations that must be interpreted critically, where questions should be asked of the reliability of any claims made. This expos-ure is especially prevalent with the increased availability of technology, where students might create a range of representations without giving consideration to their appropriateness for the data being used (Konold, 2007).
Until recently, the explicit consideration of variation in relation to graphical representations has not been a feature of research. Yet, a key component of students' long-term development of statistical literacy is being able to interpret a message from a context with a distribution that displays variation, clustering, middles and unex-pected values; this might not involve conventional text-book types of graphs (Lehrer, 2007; Wall and Benson, 2009; Watson et al., 2008). Early experiences with a range of representations that effectively display variation in data sets are important but have remained largely neglected in many elementary curricula until recently. Greater insights are needed into how young learners deal with variation in an immersive classroom environ-ment including across disciplines (Watson, 2012), how they represent data in new ways of their own choosing, how they answer questions on comparing variation in different data sets and how they identify and justify the sources of variation they encounter.
In summary, this study addresses three underrepre-sented components of statistical development in the elementary grades. First, in integrating the strands of statistics and measurement in the curriculum, the study targets the neglected factor of variation in linear meas-urement. Second, the study highlights the importance of students' awareness, creation and understanding of vari-ation in data representvari-ations, in contrast to traditional approaches where ‘information’ is simply read from a graph without being interpreted, analysed and ques-tioned. Third, it focuses on an understanding and appre-ciation of informal inference, in this instance related to predicting a student's arm span length from data exhibit-ing variation, which is critical in interpretexhibit-ing data and distributions and making informed decisions.
Methods
Participants
Four year 4 (fourth grade) classes and one year 4/5 class from a large, middle socio-economic school participated during the first year of a 3-year longitudinal study (2012 to 2014). We focus only on the year 4 students (N= 115; mean age = 9.5 years) in the reporting of our findings, 43% of whom were classified as learners with English as their second language (ESL).
Design
primary responsibility for implementing the instructional program within their own classrooms. In this article, we only consider one comprehensive activity from the first year of the study, although the learning progression we developed across the 3 years was informed by the out-comes of each successive activity in which the students were engaged.
Preparation phase: designing the activities
In the first year of the study we designed, in conjunction with the teachers' input, three sets of activities, namely, a preliminary benchmarking activity where the students created, implemented and analysed a playground survey (English and Watson, in press). The purpose of this benchmarking activity was to provide the research team with starting points for the main activities for the begin-ning year. This was followed by the measurement activ-ity (‘Measuring a Person's Arm Span’), which is the focus of this article. In the latter part of the first year, we implemented a multi-lesson probability activity that ex-plored variation and expectation (English and Watson, in press).
In developing the activities, we drew upon a range of research but focused our attention primarily on the components of Garfield and Ben-Zvi's (2005) epistemo-logical model for developing an in-depth understanding of variation, together with recommendations from the work of Lehrer and his colleagues (Lehrer, 2007; Lehrer et al., 2011), and previous positive outcomes with students in years 3 and 5 (Watson and Kelly, 2002a, 2002b). In par-ticular, the suggestions of Garfield and Ben-Zvi were use-ful. Although their key ideas in each of the seven areas of knowledge of variability cover all years of schooling, the first three were especially relevant to our study, as was the last: (i) developing intuitive ideas of variation; (ii) describ-ing and representdescrib-ing variability; (iii) usdescrib-ing variability to make comparisons and (vii) considering variability as part of statistical thinking. These key ideas were the foundation of our planning for the activity conducted in year 4.
It was important in designing our program that it aligned with the school curriculum to ensure that the ac-tivities formed a core component rather than ‘add-on’ learning experiences. The teacher preparatory meetings conducted for each activity were thus vital in informing our design, as well as in enabling us to provide important professional development on the core statistical ideas to be developed. The present activity was designed in line with theAustralian Curriculum: Mathematics(Australian Curriculum, Assessment and Reporting Authority 2013b), where the year 4 measurement strand states that stu-dents should ‘Use scaled instruments to measure and compare lengths’ (p. 43). For the data strand in year 4, the curriculum states that students should ‘Select and trial methods for data collection … Construct
suitable data displays, with and without the use of digital technologies … Include tables, column graphs … Evaluate the effectiveness of different displays in illus-trating data features including variability’ (p. 45). Be-cause one of the general capabilities of the Australian curriculum is Information and Communication Tech-nology (ICT), which includes ‘Investigation, Creating and Communicating with ICT’(Australian Curriculum, Assessment and Reporting Authority 2013a, p. 53), the software TinkerPlots(Konold and Miller, 2011) was in-troduced as the digital technology to‘construct suitable data displays’. The school was operating under this cur-riculum through the state education authority, where column graphs and picture graphs were specifically mentioned for year 4.
We targeted numerous learning objectives in designing the activity, not all of which are addressed in the re-search we report here. These objectives included devel-oping students' appreciation of the need for accuracy in measurement and to pay careful attention to scale, com-petence in representing variation in measurement values and describing the shapes of data sets, confidence in predicting a representative measurement and skills in explaining variation in data sets. Learning to create vari-ous data displays in TinkerPlotsand identify which dis-plays best show the variation in a data set were also key objectives. An important learning feature was students' consideration of the most effective displays for showing the variation in the data sets, with the emerging under-standing that there is very likely to be measurement error in the first scenario and, hence, the measurement in the second scenario is an approximation.
The creation of the activity involved several design it-erations to ensure each component met our learning ob-jectives and would generate adequate and appropriate data to gain insights into the students' learning. The au-thors and the senior research assistant worked on refin-ing the activity, seekrefin-ing teacher feedback as needed. Comprehensive teaching notes and corresponding stu-dent workbooks were developed, the latter serving as a core data source when completed by students.
and communicate their thinking to others. The groups were of mixed achievement levels.
The teacher commenced the activity with a class dis-cussion on how accurately ‘we’ can measure, different units of length we might use, and on ways length can be measured. The students were asked,‘If we all measure the same object will we get the same answer for its length?’ On discussing issues of accuracy in this situ-ation it was explained for the first scenario that,‘We are all going to measure the arm span of the same person and see if we get the same value. We will consider how to display and compare these values and see if we can make a“best guess”as to the person's arm span. We will then discuss how confident we feel about having exactly the right value.’
Once all the measurements had been recorded, the students were asked to suggest other methods of orga-nising the data other than the list on the whiteboard. The students then completed three questions in their workbooks about the recorded measurement values, reflecting Garfield and Ben-Zvi's (2005) development of intuitive ideas of variability and describing variability (phase (i)):
1. Were all of the values the same? Why or why not? 2. Were you surprised at some of the values? Which
ones? Why?
3. Write a summary of how accurate you think the measurements in the table are. What is your‘best guess’of the arm span of the person the class measured? How confident are you of this value?’
The language of the classroom often translated ‘best guess’to prediction, a difficult word for some of the ESL students.
The students subsequently discussed in their groups different ways to create a representation that they con-sidered ‘best tells the story of the class measurements.’ No direction was given as to what type of representation to construct. Each student, however, created his/her own representation in the workbook. The next question asked students to‘Write a summary statement about what your representation shows about the measurements your class made of the arm span of the person you measured’. The students were reminded to‘Think about the variation that is seen in your plot or picture,’ reflecting Garfield and Ben-Zvi's (2005) ability to represent and describe variabil-ity (phase (ii)).
A whole-class stacked dot plot was then created on the white board. Students recorded their names and measured arm span values on PostIt notes and placed them in the correct positions on a horizontal axis drawn on the white board. The students were asked about the variation in values they observed and what they might
expect if the arm spans of all students in the class were measured, as a prelude to the second measurement sce-nario. Prior to this second scenario, the students created their own dot plots of the single student's arm span measurements using the TinkerPlots software program. They were to include a textbox that explained the fea-tures of their graph, noting any clusters, gaps and out-liers that might have occurred, again reinforcing the representing and describing of variation (Garfield and Ben-Zvi, 2005).
In the second scenario, the students were to measure and plot the arm span of all members of the class and record these measurements on the whiteboard. Due to time limitations, in most instances the researchers had to assist in taking these measurements. Prior to the mea-surements being taken, the students recorded their re-sponses to two questions, namely:
1. Do you think all the values will be the same? Why/ why not?
2. How accurate do you expect your results to be compared to our last lesson?
After recording their measurements on the white board, the student groups entered the data into a new data collection in theirTinkerPlotsfiles, which still con-tained their plots of the single student's arm span mea-surements. They were then to create a plot ‘that best describes the [new] data set and tells the story.’This was to be accompanied by a text box containing a summary statement of what the plot shows and ‘at least two sen-tences that describe the differences between this plot and the earlier one,’ reflecting Garfield and Ben-Zvi's (2005) component of using variability to make compari-sons (phase (iii)).
The activity concluded with a class discussion that highlighted the differences between the two scenarios and the variation in the two plots. The students were asked:
1. Why is there a difference in the spread/range for the two activities (scenarios)?
2. How confident are we of the values that we plotted in the second graph for each class member, having experienced the variation we found in the earlier plot for a single person?
3. Would it have been better to have made two or three or four measurements on each person and picked a‘typical’one?
Retrospective analyses
The data to be used in the retrospective analyses were drawn from multiple sources. In each class, we selected two focus groups for in-depth analysis, where their work was video- and audio-recorded and subsequently tran-scribed. All whole class discussions were also recorded and transcribed, and all of the students' workbooks were scanned for analysis. Between 1 and 3 months after com-pletion of the activity, an assessment was implemented in all classes except the year 4/5 class whose timetable prevented their completion of the assessment. Two of the classes had 30 students undertake the assessment a month after completing the activity. Of these students, many were classified as ESL and/or low-achieving. Of the other two classes, streamed as high achieving, 36 students completed the assessment after 3 months. Al-though some were classified as ESL, many of these had high levels of English. The teachers of the two classes with the longer delay did not review the activity with the students before completing the assessment. Although there was a difference in performance between the two groups of two classes, favouring the class with the longer delay, it was believed to be the result of streaming the classes, and the data were combined for analysis of all year 4 students. The work of any students without par-ental consent was not recorded and not included in the analysis.
The data addressed here are drawn from the students' completed workbooks, their TinkerPlots creations and accompanying textbox descriptions, the transcriptions of whole class and focus group discussions and the assess-ment. Codes were checked by each author and refined, with the senior research assistant undertaking a final overview; consensus was reached on all coding.
In analysing the responses of students in their work-books and in creating plots in TinkerPlots with accom-panying text in text boxes, two kinds of criteria were used. In one situation, students were providing descrip-tions or reasons associated with observadescrip-tions or conjec-tures. These differed somewhat between classes because of the data collected or the way the teacher handled the discussion. It was of interest to categorise these re-sponses to gain an appreciation of the diversity of think-ing in the measurement context, but the responses were not considered to be hierarchical in nature. For these data, we employed content analysis (Patton, 2002). A de-scription of the categories and the percentages of re-sponses in each are presented in tables in the ‘Results’ section. In other situations where students were con-structing representations or more complex arguments, it was possible to suggest a hierarchical cognitive structure reflecting increasing use of the elements available for the response. The criteria for levels of response are reflective of levels of the SOLO model (Biggs and Collis, 1982)
where code 1 generally is assigned to employing a single element or aspect from the context of the question (a unistructural response). At code 2, several elements may be used, usually presented in sequence (a multistructural response) and, at code 3, relationships are demonstrated among the elements (a relational response). The particu-lar descriptions of these levels where applicable are pre-sented in the tables in the Results section.
The assessment began with straightforward questions based on a screen dump from the software for two rea-sons. The first was to confirm the students had picked up the basics of interpreting the information in the Tin-kerPlots format, and the second was to provide easy questions at the start of the assessment. The coding values for the instrument are given in the Additional file 1 with the questions asked, along with the rubric provided to teachers. Of interest is the total score obtained as it re-flects the overall understanding of students in adapting to
TinkerPlots as a context for reaching the learning objec-tives of the measurement activity. Further, the responses to questions 10 to 15, including a request for the definition of variation, throw light on the degree of application of ideas associated with variation in the classroom scenarios, as well as in a related context.
Although this study was not accompanied by extensive surveying that could lead to the type of Rasch analysis reported by Watson et al. (2003), it is possible to con-sider descriptively whether the responses provided by students, first in their workbooks, second in class discus-sions, and later in a limited assessment situation, exhib-ited the type of thinking typical of the four levels of their developmental hierarchy of understanding variation. Be-cause of the specific scenarios of the classroom activity and the interaction of the teacher and students, it is as-sumed that the students understood the measurement environment for the activity. Although some were classi-fied as ESL students with little English, there was no in-dication from the video of the classroom that any student was unaware of the task of measuring one stu-dent's arm span. They had also created graphs through previous classroom experiences, and it was assumed that all students had reached level 1 of the developmental hierarchy, Prerequisites for Variation.
We report the results in terms of the three research questions cited previously, namely, (1) What are stu-dents' levels of development in detecting, representing and explaining variation in linear measurement values? (2) How do students develop the ability to compare and explain differences between representations in the two scenarios? (3) Do students demonstrate understanding of variation and transfer of that understanding through delayed assessment questions?
directly to level 2 of the developmental hierarchy, Partial Recognition of Variation, which involves putting ideas in context and focusing on a single element. The context is the consideration of variation in length measurements, repeated for a single student. The second research ques-tion is related to students' understanding of comparing variation in the two scenarios and ability to represent it in a visual way and then explain the meaning. This is one of the types of consolidation of ideas expected at level 3 of the developmental hierarchy, Application of Variation, where perhaps not all significant features are recognised. The third research question is related to crit-ically interpreting the variation seen within and between the data distributions and transferring this to another context. This is the sort of complex justification ex-pected at level 4 of the developmental hierarchy, Critical Aspects of Variation.
Results
In reporting the results of the study in relation to the re-search questions, we first consider the outcomes from the classroom that are associated with the first two research questions. The third research question is addressed by the post-activity questions in the class assessment.
Research question 1: in the first scenario, what are students' levels of development in detecting, representing, and explaining variation in linear measurement values? To determine the students' detection of variation and ac-curacy in their measurement values for the first scenario (measuring just one designated person in the class), we analysed their responses from the first three workbook questions (some of these responses were reported briefly in a conference paper of English and Watson, 2013). We identified different non-hierarchical categories of re-sponses to each workbook question, with some students' responses encompassing more than one category, and some responses incomplete; hence the number of re-sponses reported varies across the questions.
Workbook question 1: were all of the values the same? Why or why not?
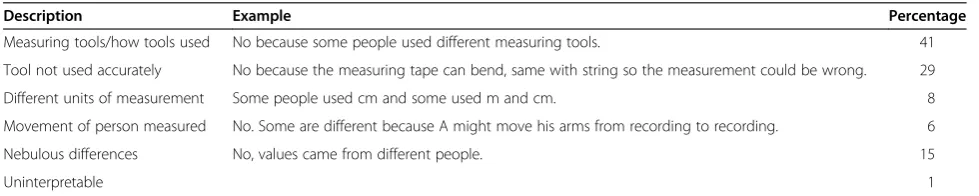
Five main categories of responses were identified in the analysis of the first question. Although some responses were vague in presenting justifications for the different values, most students across the classes focused on the measuring tools and how they were used or their accur-acy. Fewer students suggested measuring in different units, or the fact that the student being measured might have moved, as a reason for different values. The percent-ages for each category are given in Table 1.
Workbook question 2: were you surprised at some of the values? Which ones? Why?
Analysis of the children's responses (N= 95) to the question about surprising values yielded four categories (in addition to a category of four irrelevant or non-interpretable responses). Overwhelmingly, students identi-fied an outlier or extreme/unusual value and included why it had occurred. Some students mentioned variation with-out focusing on a particular value, whereas others, espe-cially in one class where there were no apparent outliers, noted the lack of variation, hence lack of surprise. The percentages are given in Table 2.
Workbook question 3: write a summary of how accurate you think the measurements in the table are. What is your
‘best guess’of the arm span of the person the class measured? How confident are you of this value?
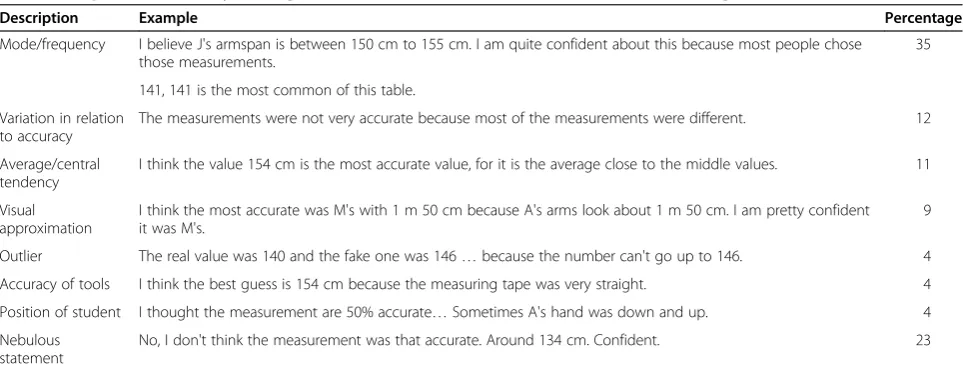
In analysing the students' assessment of the accuracy of their measurements, 101 responses were classified into eight groupings. The most frequently occurring category contained responses related to a modal idea, although the term mode was not used. Some other students fo-cused on the idea of middle in choosing their prediction. Outside of these categories, students mentioned vari-ation in the data, visual intuitions and reasons expressed for earlier questions. Outcomes are shown in Table 3.
Students' representations The students created repre-sentations in two ways for the data collected in the first
Table 1 Responses: were all of the values the same?
Description Example Percentage
Measuring tools/how tools used No because some people used different measuring tools. 41
Tool not used accurately No because the measuring tape can bend, same with string so the measurement could be wrong. 29
Different units of measurement Some people used cm and some used m and cm. 8
Movement of person measured No. Some are different because A might move his arms from recording to recording. 6
Nebulous differences No, values came from different people. 15
Uninterpretable 1
scenario, namely, constructing a hand-drawn representa-tion on a blank page in their workbooks and then later using the TinkerPlots software to represent their data. For both formats, the students were to record a sum-mary statement about what their representations showed about the measurements, keeping in mind variation seen in the plot. First we consider the students' hand-drawn representations and the associated explanations.
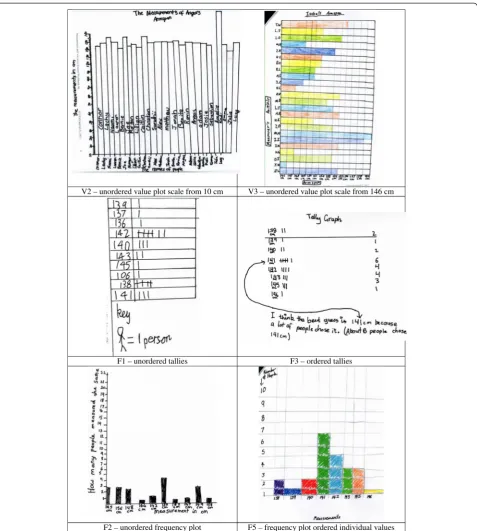
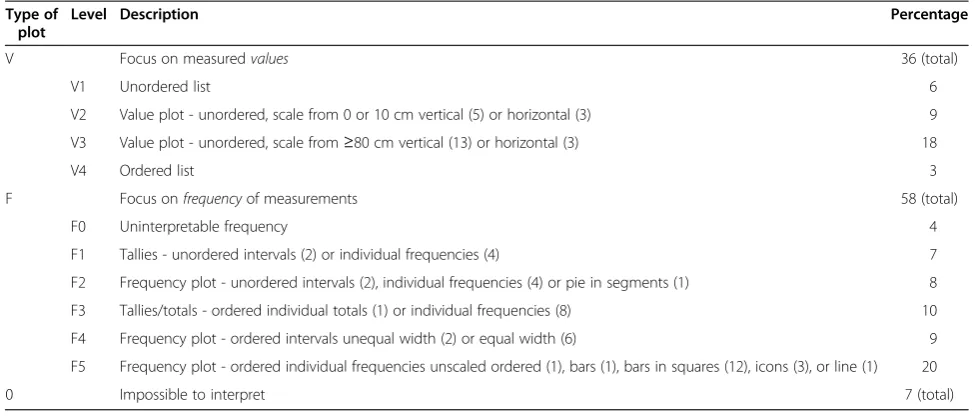
Students' hand-drawn representations and summary statements For the hand-drawn representations, of the 84 students who completed this task, 6 students created two representations, making a total of 90. Of the 90 rep-resentations, 7% could not be interpreted, 36% focused on the actual measured values (V) and 58% focused on the frequency (F) with which the measured values oc-curred. Within these two types (measured values and frequency), it was possible to rank the representations based on their statistical appropriateness. For represen-tations of value, it was considered that unordered lists were the most difficult to interpret, followed by un-ordered value plots with scales beginning at 0 or 10 (ex-ample V2 in Figure 1). Plots with scales beginning with a value of 80 or more (example V3 in Figure 1) were
considered easier to interpret visually, whereas an or-dered list was consior-dered the most interpretable of rep-resentations of values.
For frequency representations, again order was consid-ered more appropriate than non-ordconsid-ered data as was a graphical presentation over tallies. Several of the plots appeared to represent frequency but were impossible to interpret (F0). Of the unordered representations, those based on tallies (example F1 in Figure 1) were consid-ered more difficult to understand than those displaying frequency visually (example F2 in Figure 1). Of the rep-resentations that ordered the data, those based on tallies or totals (example F3 in Figure 1) were considered more difficult to interpret than those displaying frequency in plots. Further, the plots showing individual frequencies (example F5 in Figure 1), were thought more interpret-able than those using intervals. Percentages of all levels are given in Table 4, with examples of some of the levels presented in Figure 1.
In writing a summary statement of what their hand-drawn representation conveyed about their data, of the 84 responses, some were not actually related to the data, such as mentioning colour or describing people. It was possible to employ a hierarchical coding of the responses
Table 2 Responses: were you surprised at some of the values?
Description Example Percentage
Identifying extreme/ unusual value
I was surprised at the fact that somebody's value was 159 for it was much larger than the other values. 63
I was surprised with 106 because it was too small and A is the largest person in the class.
Variation in values 146 and 159 the differences is big, it is 13. 19
Yes, I was surprised at the 146 measurement and the 150 measurement because of the veration [variation].
Lack of surprise I was not surprised because at the values because they looked like it was around where A's armspan would be. 13
Nothing surprised me.
Uninterpretable 4
Which ones? Why? (n= 95) (summarised from English and Watson,2013).
Table 3 Responses: summary,‘best guess,’and confidence (n= 101) (summarised from English and Watson, 2013)
Description Example Percentage
Mode/frequency I believe J's armspan is between 150 cm to 155 cm. I am quite confident about this because most people chose those measurements.
35
141, 141 is the most common of this table.
Variation in relation to accuracy
The measurements were not very accurate because most of the measurements were different. 12
Average/central tendency
I think the value 154 cm is the most accurate value, for it is the average close to the middle values. 11
Visual approximation
I think the most accurate was M's with 1 m 50 cm because A's arms look about 1 m 50 cm. I am pretty confident it was M's.
9
Outlier The real value was 140 and the fake one was 146…because the number can't go up to 146. 4
Accuracy of tools I think the best guess is 154 cm because the measuring tape was very straight. 4
Position of student I thought the measurement are 50% accurate…Sometimes A's hand was down and up. 4
Nebulous statement
linked to the SOLO model, with responses not related to the representation considered pre-structural and coded 0. A single acknowledgement of the graph as a focus was considered unistructural and coded 1. Putting to-gether a description of either variation or expectation linked to the graph was considered multistructural (code 2), whereas linking both variation and expectation to the
plot was considered relational (code 3) as this included the fundamental ingredients of a statistical analysis in making an ‘informal inference’acknowledging variation. The most frequent response was to provide only a gen-eral description of the representation rather than its message. Table 5 reports the percentages of responses at each level with examples.
V2 – unordered value plot scale from 10 cm V3 – unordered value plot scale from 146 cm
F1 – unordered tallies F3 – ordered tallies
F2 – unordered frequency plot F5 – frequency plot ordered individual values
Students' TinkerPlots representations and summary statements Students worked in pairs to create Tinker-Plots graphs for the measurement of a single student. Thirty-six groups created plots and text boxes for this task. The codes for levels of understanding displayed again reflected the SOLO hierarchy with some groups not providing interpretable text (code 0), some groups focusing on single isolated aspects of their plots (code 1), other groups describing sequentially several aspects of their plots appropriately (code 2) and one group going further to relate the information in an argument (code 3). Descriptions and the percentages of groups with each code are given in Table 6. One or two examples of each code are shown in Figure 2.
Research question 2: how do students develop the ability to compare and explain differences between
representations in the two scenarios?
Rather than create hand-drawn graphs of class data, stu-dents were asked to use TinkerPlots to compare and contrast the two data sets for the single student and the
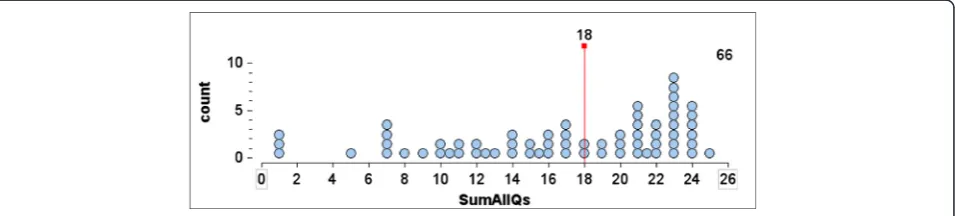
class. Thirty-one pairs of students produced plots and text boxes for this part of the activity. The hierarchical coding levels are listed in Table 7, with code 0 files not addressing the question or including any further advance on the previous question. At code 1, groups gave evi-dence of considering the class data only, not comparing it to the individual student data, whereas at code 2, groups made basic statements comparing the plots for the two situations (individual student and class). At code 3, two or more of the comparison statements were linked to give reasons for the differences in the two plots. Examples for codes 1 to 3, including the plots and text, are shown in Figure 3.
Insights into the students' thinking in comparing the representations between scenarios were gleaned from the class and focus-group transcripts. For example, dur-ing a class discussion on the differences between the two plots, Neil explained,‘Shanna's was based on the same person and the other one was based on different [people], and it would be different measurement,’ and ‘Um, Shanna's arm span there's not like as much options
Table 4 Hand drawn representations of single student context (n= 90)
Type of plot
Level Description Percentage
V Focus on measuredvalues 36 (total)
V1 Unordered list 6
V2 Value plot - unordered, scale from 0 or 10 cm vertical (5) or horizontal (3) 9
V3 Value plot - unordered, scale from≥80 cm vertical (13) or horizontal (3) 18
V4 Ordered list 3
F Focus onfrequencyof measurements 58 (total)
F0 Uninterpretable frequency 4
F1 Tallies - unordered intervals (2) or individual frequencies (4) 7
F2 Frequency plot - unordered intervals (2), individual frequencies (4) or pie in segments (1) 8
F3 Tallies/totals - ordered individual totals (1) or individual frequencies (8) 10
F4 Frequency plot - ordered intervals unequal width (2) or equal width (6) 9
F5 Frequency plot - ordered individual frequencies unscaled ordered (1), bars (1), bars in squares (12), icons (3), or line (1) 20
0 Impossible to interpret 7 (total)
Table 5 Responses: interpreting the representations for the single student context (n= 84)
Code Description Example Percentage
0 Description not related to the data
The way people measure. 8
No response (although drew representation)
6
1 Strict description of graph (no summary of message)
I used a bar graph to show V's arm span. 35
2 Description of variation My graph shows the amount of difference with different tools and their measurements, the variation: 26 people, 13 different answers.
27
Description of expectation The graph shows us that 141 cm is most likely to be S. 7
3 Description of both expectation and variation
In the variation of guesses their [there] were a lot of guesses around 1 m 50 cm so the answer would probably be around 1 m 50 cm. I also think this because it is not to[o] big or small.
in measurement, you can just do like one type cause it's her. Lots of people measure her and some people could get a not exact [measurement]’. In further discussion, another student explained why the two distributions differed, namely,‘Shanna's would be more squished be-cause the numbers would be closer together be-cause it's the same person and in, at the class, we're all different so it's all further apart’.
Students' expectation of accuracy in the second scenario In the second scenario, while collecting measurements of all class members, students were to respond to the
workbook question,‘How accurate do you expect your results to be compared to our last lesson?’As the data from each class were genuine, two classes had values that would be classified as outliers, two classes showed a large degree of variation, but no ‘certain’ outliers, and one class had very consistent measurements.
Six levels of responses (N= 85) were identified for this question. Those with no reference to criteria were coded 0. Some responses made reference to the measurement task without further explanation (code 1), whereas most of the students drew connections with descriptions of events dur-ing the activity that could affect accuracy (code 2). The
Table 6 Responses: plots and text boxes inTinkerPlotsfor measurement of one student (n= 36)*
Code Description Percentage
0 Not interpretable; not addressing the question; no text box. 8
1 Literal reporting of aspects of the plot, for example, what variable the graph displays, labels on the axis, number of data values. 50
2 Description of explicit information read from the graph, for example, 1 or 2 of the following types of comment: specific measurements such as range, most frequent (popular) values, outlier.
39
3 Additional information beyond, but including, the types of comments in code 2, for example, at least 3 comments of the following type: specific measurements such as range, most frequent (popular) values, outlier, percent values in the plot, intervals, averages.
3
*If multiple plots and text were produced by a group, the highest code assessed is reported in the table.
Code 0 Code 1
Code 2 Code 3
most frequent percentage of responses again mentioned the measuring tools and how they were used. Other responses featured the accuracy of the person measuring (because in several classes the researchers collected the data due to time constraints), the greater experience of the students, and rather nebulous comments on‘different’people meas-uring. There was only one response (code 3) that related the critical issue of the number of measurements made on the individual student compared to the single measure-ments on the class. Although this issue was discussed with the class before the class measurements occurred, and again in discussion following students' completion of their representations (as we illustrate next), there were other is-sues that attracted the attention of the students. The per-centages for each level of response are given in Table 8.
Students' assessment of accuracy in second representation Despite only one written response indicating an aware-ness of the role of repeated measurements in assessing accuracy between scenarios, there was evidence of this understanding in class discussion following students' completion of the two plots. Given the variation in values the students identified in the first representation, they were asked to consider their confidence level in the values displayed in their second representation. Viviane, for example, explained,‘I don't think they're exactly [ac-curate] because with S, in S's arm span we got lots of an-swers of the whole class and if, I think if we measured each of the person [second scenario] lots of times we would get different answers.’Inta added to this point by commenting that it‘would be better to do it three times because it would be like, once it could be 142, then the next one could be a different number and then the next one…’Another student further commented that,‘If you had three goes you could see, if you had 142 the first time, then 142 the next time, a different number the third time, you could estimate the 142 is the most popu-lar, then you could do it again and see if it is the same.’ Reference to this approach being ‘a good idea’ was emphasised by another student, explaining that,‘because …the one that is the most [frequently occurring value] will be good and all the ones in the middle will be best and if one's too small and one's too high, you don't [use
them], you'd usually use the bigger ones [more fre-quently occurring value/s].
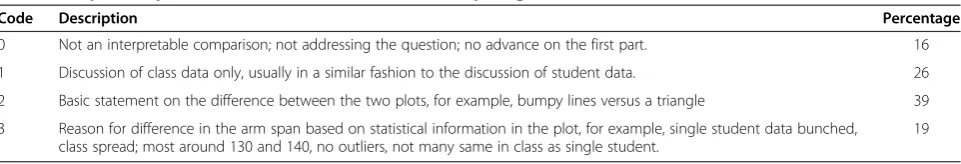
Research question 3: do students demonstrate understanding of variation and transfer of that understanding through the assessment questions? There were 26 marks possible on the assessment questions (Additional file 1). The distribution of scores for the 66 stu-dents who completed the questions is shown in Figure 4, where the median score is seen to be 18. The distribution is somewhat skewed, with a mean of 16.7 because of the three very low scores of students who spoke virtually no English. Without those three scores, the median becomes 19 and the mean becomes 17.5, which seems a reasonable reflection of the performance of the students. The teachers were pleased that half of their students had achieved scores of 69% or more.
In further evaluating the students' understanding of variation and distribution within and across data rep-resentations, we consider their responses to the as-sessment items Q10 through Q15 (Additional file 1).
In reviewing the results for Q10 (associated with the figure at the beginning of the Additional file 1), on de-scribing the plot shown (‘What it tells you about the people in the data set’), the maximum score was 4 for providing a meaningful and accurate account of the in-formation in the plot. Although 20% of students did not score on Q10, 32% achieved a score of 4. The mean score across the students was 2.3 with 70% of the stu-dents achieving half marks or better.
Students scoring 1 provided very limited information on the plot, for example,‘The shape of the plot is like building in the path’and‘It tells me in the data set that the people are quite old.’ Students scoring 2 gave some interpretation of the shape of the plot, with a sequence of observations: ‘There are more in the middle and are kind of spreader (sic.) on the out sides’ and‘There are seven people are taller than 170 cm, eight people who are shorter than 164 cm and there are nearly 50% of people in the centre’.
Scores of 3 reflected both the content and some lim-ited comments on shape:‘It tells you 30 people heights. It shows a lot of option and goes from 146 cm to 188 cm.’ ‘It tells me about the people that their heights are all
Table 7 Responses: plots and text boxes inTinkerPlotscomparing measurements for one student and class (n= 31)*
Code Description Percentage
0 Not an interpretable comparison; not addressing the question; no advance on the first part. 16
1 Discussion of class data only, usually in a similar fashion to the discussion of student data. 26
2 Basic statement on the difference between the two plots, for example, bumpy lines versus a triangle 39
3 Reason for difference in the arm span based on statistical information in the plot, for example, single student data bunched, class spread; most around 130 and 140, no outliers, not many same in class as single student.
19
different. Some people are small’. Students who scored 4 provided meaningful links to a summary of the data. These included ‘It shows the average is about 164 to 170 cm which is in the middle and it is irregular with ran-dom bumps’ and ‘The shape is a bit of a triangle. This means it starts small on the edges and goes up to centre. Centre = 164 to 170 14 people are in the centre. There are eight people around the edges. The average person is about 167 cm’.
Q11 aligned with the classroom activity, asking stu-dents to distinguish between arm span measurements
for a single student (lower plot) and a class (upper plot) (see Additional file 1), followed by the reason for being able to distinguish correctly. Seventy-seven percent of responses correctly distinguished the plots, 3% had label-ling difficulties, and 20% either did not answer or did not use the labels provided. For Q12 where students ex-plained how they decided which plot was which, 20% of students could not answer the question but 62% scored the maximum of 4, reflecting a good understanding of the classroom activity, as indicated in the sample re-sponses below for a score of 4.
Code 1
Code 2
Code 3
this plot shows directly how much everyones arm span is
this plot shows what the average is (140-150). And what percentage of the class guessed Antonio armspan was more than 140 and who guessed it
We choose this plot because it is easy to read and understand. We think this plot is better than the pie graph we did for Isabel’s armspan because it’s easier to understand.
When we compared the personal armspans graph and
found out that different
This plot shows the names of my classmates and their measure of their proper armspan.
because people always some are bigger and some smaller. The second graph is vitorias armspan and the persons balls are more squishi because it was just the measurement of 1 person and the first is different peoples armspan. That’s why the first one is separate and the second one is more squishi.
was less.
to 30 cm difference.
people’s armspans can have up the Isabel’s armspan graph, we
The personal is more separedly
The top one was the 19 students armspan because there was a lot of difference and the bottom one was Leo's armspan because it was all cramped up together. Leo's armspan didn't have a lot of variation because it is only one arm to measure and it should be nearly the same. While the 19 students one had alot of spread because its unlikely that one person could have a range of armspands [arm spans].
If Leo's plot was the top one it would be impossible because Leo can't have that many armspans. If it was 19 people everyone would most likely have a different range. The top one has a bigger variation.
Responses that were scored 2 marks (11%) only con-sidered one plot for the reasoning, for example,‘I know the second plot is Leo's Armspan because its bunch[ed] up in one place’and‘I think the bottom one is Leos (sic) because the scores are mostly the same and Leo only has one armspan.’
Q13 and Q14 were based on a plot that compared arm span measurements for two grades rather than one
student and a class. Students were asked if there were an overall difference in the arm spans of these grade 6 and grade 7 students. The plot is shown above Q13 in the Additional file 1. Q13 asked for their answers and Q14 asked for two reasons for the decision. For Q13 (not scored), one student did not answer, 82% said‘Yes’, 12% said‘Not sure’and 5% said‘No’.
Two marks were possible for each reason in Q14, and there was an indication that students did slightly better for the first reason than the second. This is likely to have oc-curred because it is more difficult to think of two reasons than one. Overall, for both reasons, the mean score was 1.2. If a reason was repeated with little change, no mark was given for the second. The ‘not sure’ responses were generally followed by‘I don't know’or a blank. Some rea-sons for ‘Yes’answers did not provide any specific infor-mation from the plot (score of 0), e.g. ‘Yes, because you can see it’and‘People have differnet [different] heights in diff[e]rent age groups.’ Scores of 1 generally only men-tioned a single feature of the plot or a general recognition of the context:‘If you look at the top of the graph there is one dot in the very end’and ‘Yes because normally Year
Table 8 Responses: accuracy between contexts (one student or class) (n= 85)
Code Description Example Percentage
0 Uninterpretable Good enough. 14
1 Nebulous comments on difference
No because people kept getting measured and it was different each time. 12
Unexplained numerical values
At least 95%. 4
2 Measuring tools and how used
I think the [class] results are accurate because we were measuring on a flat surface and the tape was put in place accurat[e]ly.
33
Reliability of person measuring
Yes they [the class] will be [more accurate] because the teachers measured it in the second lesson. 26
Experience gained Yes, I think they will be because now we have had practice at measuring we might be more accurate than last time.
10
We have learnt more about measurement.
3 Number of measurements*
I think it [class] wasn't really accurate because we measured S. a lot of times and for our class we only measured ourselfs [ourselves] 1 time.
1
*Most appropriate statistical response.
7's have bigger armspans (sic.) and I've seen it.’Responses that scored 2 marks displayed a general recognition of dif-ference in shape, as in,‘Because one is more to the right and one more to the left’and ‘Because the graph shows that grade 6's are bunched up at the small end’. Two of the‘No’responses actually gave a reason for the classes to be different whereas the only valid reason supporting no difference was the following:‘I gave my answer no because the difference between the armspan (sic.) is not big (it is medium not big).’
For the final question, Q15, asking for the meaning of vari-ation (worth 2 marks), the mean score was 1.4 with 64% of students achieving a score of 2. Many of the 26% of re-sponses that were scored 0 were of the form,‘I don't know.’ Others reflected an understanding of the context but not the nature of variation, such as,‘Long of armspan’or‘The num-ber of people.’Responses with a score of 1 often used a word with the same root as variation, for example,‘I think it means varity [variety]’and‘Varying the amount by which something varies.’The concept of difference among some things being measured was reflected in score 2 responses: ‘Variation means difference or many things, a variety for example, Sam's 131 cm and Jonah is 156 cm that's the variation’;‘It means how different things are (comparing);’and‘The diff[e] rences or similaritys [similarities] with something’.
The mean score (out of 16) for the scored items Q10 to Q15 was 10.3, with a median of 12, suggesting that the students had developed a reasonable understanding of the core concepts that were targeted in the activity. In particular, the students appeared to have developed a basic understanding of variation (Q15), scoring a mean of 1.4 out of 2. This understanding was borne out in stu-dents' responses to Q10 where well over half the class could describe and interpret the shape of the plot of heights. Likewise, for Q11 and Q12, the majority of stu-dents could identify the correct labels for the two arm span plots and could explain why this was the case.
Discussion
In reflecting on our findings, we address each research question in turn, beginning with the students' develop-ments in detecting, representing and explaining variation in linear measurement values. We next consider their learning as they compared and explained differences between repre-sentations in the two measurement scenarios, including identifying variation and distributions, judging measure-ment accuracy and appreciating the role of repeated mea-surements. Finally, we review the students' retention and transfer of variation and distribution, including describing plots and their shape and identifying value clusters and out-liers. In reflecting on our findings we touch upon the issue of how students conceive of variation and distribution, in terms of whether the former is seen as generating the latter or vice versa.
Detecting, representing and explaining variation in linear measurement values
With respect to the first research question (measuring one designated class member), the students recognised that the use of different measuring tools and how accur-ately they were used led to variation in values obtained and difficulty in predicting the student's actual arm span. Any outliers that occurred were readily detected and, if no such values existed, the students considered their cluster of values to predict the approximate arm span of the student. This reference to a modal notion was evi-dent in the stuevi-dents' reflections on their accuracy, with recognition of the ‘most popular’ value/s as the likely arm span measurement. Variation in values, however, was considered by some to indicate less accuracy, as was the way in which the measuring tools were used. Al-though the language of informal inference was not used at this grade level, the students' best guesses or predic-tions were made with implicit acknowledgement of the uncertainty associated with the presence of variation.
The use of a real-world measurement activity, in which variation is a naturally occurring feature, provided a rich context for students' appreciation of phenomena that vary. As Lehrer's research has indicated (e.g. Lehrer et al., 2011), engaging young students in creating vari-ability through measurement error is a powerful way of making visible the impreciseness in measuring - from the tools chosen, how they are manipulated and how measurements are recorded and interpreted. Experiences in undertaking repeated measurements are especially important here as they reveal the inherent variation more explicitly and convincingly. Furthermore, as ob-served by Lehrer et al. (2011), as students attempt to take repeated measures they became more aware of the phenomenon being measured and how any changes in that phenomenon would impact on the measurements generated. What the present activity provided was a hands-on experience of variation in a context designed to build beginning recognition of variation. In terms of the Watson et al. (2003) developmental hierarchy, this early identification of variation represents at least the second level of development for nearly all students, whereas many students reached the third level for this component of informal inference.
a sense of the ‘signal in noise’ (Konold and Pollatsek, 2002, p. 268) in their data, that is, an indication of what the actual arm span measurement of the designated per-son might be.
Although the ordering of values and the creation of frequency plots with meaningful scales were prevalent in these hand-drawn representations, many (approximately one third) featured less sophisticated displays of actual measured values. Although our analysis focused on the statistical sophistication of the students' data displays ra-ther than the type of representation, it is worth noting that a wide range of representations was produced. There was the use of lists, tally marks, bar graphs, circle graphs, dot plots, and histograms, with some students creating more than one representational form.
In contrast to this representational diversity were the somewhat limited descriptions of what the representa-tions conveyed about the data. Nearly half of the re-sponses provided only a general description of the representation rather than its message, typical of partial recognition of variation (level 2). Nevertheless, approxi-mately a third of responses made reference to the variation and expectation that their hand-drawn representation revealed.
The students displayed similar responses in their text box explanations of their software representations, with a simple reporting of the plot features prevalent. Al-though there was some reference to data distribution features such as the range and most frequent values, it appeared that interpreting representations beyond a lit-eral reading (cf. Curcio, 2010) was a new experience for the students and that more attention is required here, especially given young students' competence in generat-ing a range of representational types (English, 2013).
Comparing and explaining differences between representations in two scenarios
The comparison of data from the two scenarios provided the opportunity for students to develop and display a consolidation of ideas related to variation in a realistic context. Identifying variation across these data sets rep-resented development at level 3 of the Watson et al. (2003) hierarchy, although there were some inconsisten-cies in the presentation of arguments as evident in the students' written responses on accuracy. The class dis-cussion transcripts, however, indicated some students could express in colloquial language ideas that they found difficult to express in written language in their workbooks.
The observed outcomes in the classroom suggested that a focus on developing students' ‘ metarepresenta-tional competence’ is needed, a term that diSessa and his colleagues (e.g. diSessa, 2004; diSessa et al., 1991) proposed to indicate the range of students' capabilities
in constructing and using external representations prior to direct instruction - and even independently of it. This metarepresentational competence, however, needs to be accompanied by the development of conceptual compe-tence (diSessa, 2004); specifically, students should be able to interpret and explain the statistical features dis-played by their representations. As diSessa noted, re-search is limited here, and the role of student-created representations in conceptual development is complex. Further investigation is needed on how certain strengths or limits of metarepresentational competence might ad-vance or hinder conceptual competence, especially as students move from non-software to software-generated representations. At the same time, it is necessary to ad-dress whether metarepresentational competence and conceptual competence grow together as students de-velop the statistical competencies we have explored here (English, 2013).
Although we cannot answer these questions directly from our results, students' comparisons of their software generated representations for the two measurement sce-narios appeared to indicate concurrent conceptual and metarepresentational development. Over half of the stu-dent pairs could detect distribution differences, with some responses more sophisticated than others. Drawing analogies between familiar shapes (e.g. triangle) and the data distribution display was common, but reference to specific statistical information (e.g. clusters of values, variation) was not as prevalent.
In terms of judging measurement accuracy between the two scenarios, the majority of students recognised variation in the tools used and the reliability with which they were used. A few commented on the learning they had gained from the first scenario as a reason for im-proved accuracy in the second, suggesting a metacogni-tive awareness of the knowledge they had developed. This awareness has not received the attention it war-rants, as both Lester (2013) and Schoenfeld (2013) have emphasised. Indeed, very little is known about how to develop students' metacognitive abilities even though they play a critical role in mathematical problem solving and learning in general.