O R I G I N A L A R T I C L E
Evaluating the effect of heat treating temperature and duration
on selected wood properties using comprehensive cluster analysis
Fei Guo•Rongfeng Huang•Jianxiong Lu•
Zhangjing Chen•Yongjian Cao
Received: 28 February 2014 / Accepted: 23 April 2014 / Published online: 23 May 2014
ÓThe Japan Wood Research Society 2014
Abstract In this study, twenty-five heat treatments were conducted at the various treating conditions of five tem-peratures and five durations. At each treatment, 15 poplar specimens were used. Twelve variables that represented wood color, physical and mechanical properties and dura-bility were measured for both treated and untreated speci-mens. To evaluate the effect of heat treatment on the wood performance, a comprehensive cluster analysis was applied to the measured variables of treated and untreated speci-mens. Cluster analysis showed that treating and control specimens can be distinctly classified into 2, 3 or 4 clusters according to the intended purposes. Two clusters can rep-resent the control group and twenty-five testing groups. Four clusters represented the control group and three groups of testing specimens having mild, moderate and severe treating conditions, respectively. At the mild treat-ment, modulus of rupture (MOR) was reduced\11 %. Wood durability increased to moderate resistant. At the moderate treatment, EMC decreased by 28 %, and MOR was decreased by more than 12 %. In the severe treatment,
wood durability increased to resistant or highly resistant; however, its MOR was reduced half.
Keywords Cluster analysisFactor analysisPopulous tomentosaThermal treatmentWood properties
Introduction
Heat treatment improves wood durability [1, 2] and its dimensional stability [3–5]. Heat-treated wood is darker and more uniform in color, which is preferred in many European countries [6–8]. However, heat treatment can also cause some unfavorable changes. Mass loss, reduced strength and increased brittleness, especially in high tem-perature, limit its application in structural area [4, 6, 9]. The volume of heat-treated lumber is increasing and the commercialization of heat-treated wood is also growing. It is essential to know the correlations among wood proper-ties so that treating conditions can be effectively selected and controlled.
Heat treating condition includes treating temperature and duration, which affect the properties of heat-treated wood. MOR and hardness of Chinese fir decreased slightly when it was heat treated at 170 and 185°C. At the tem-perature above 200°C, MOR and hardness decreased rapidly [10]. Main compositions of wood, hemicellulose, cellulose and lignin, undergo different complex chemical transformations as temperature increases [11]. Chemical reaction rates of wood constituents vary with treating temperature. Therefore, heat treatment can be divided into different levels.
Classification and quality control of heat treatment have been studied over the last few decades [12–14]. Finnish Wood Preserving Association classified heat-treated wood F. GuoR. Huang (&)J. Lu
Key Laboratory of Wood Science and Technology of State Forestry Administration, Research Institute of Wood Industry, Chinese Academy of Forestry, Beijing 100091,
People’s Republic of China e-mail: [email protected]
Z. Chen
Dept. of Sustainable Biomaterials, Brooks Forest Products Center, Virginia Polytechnic Institute and State University, Blacksburg, USA
Y. Cao
Guangdong Academy of Forestry, Guangzhou, People’s Republic of China
into three heat treatment classes based on their durability according to EN 335-1 [12]. In this study, we applied cluster analysis to classify heat-treated wood with various properties into consideration in addition to the durability.
Cluster analysis is a statistical technique to group a set of objects according to their similarity. Similarity can be computed based on several specific variables. The cluster analysis has been widely applied to wood researches [13,
15]. For example, it was used to process the data from infrared spectroscopy or near infrared spectroscopy for species identification [16].
Many researchers had successfully separated the treat-ment intensities of unknown samples based on some non-destructive methods, such as color measurement and NIR spectroscopy. Schnabel et al. [17] measured the color of beech wood from 3 different heat treatments and control group. They classified those samples into 4 groups using cluster analysis based on wood color. However, classifi-cation of heat-treated wood only with color has certain limit, because other properties, such as wood physical and mechanical properties, are crucial for the end use. Bachle et al. [14] successfully classified some samples according to their treatment intensities using SIMCA classification method based on NIR spectroscopy. These researches defined classes by treatment intensities in advance, and then sorted some unknown samples into corresponding classes to prove their methods are feasible. This study aims to divide treatment intensities into different levels according to their comprehensive properties.
In this study, the relationships among heat-treated wood properties were analyzed. Comprehensive cluster analysis on effect of the heat treating temperatures and duration on wood properties was conducted to establish a novel approach of grading heat treatments according to the selected properties of heat-treated wood.
Experimental
Materials and heat treating process
Fifteen 20-year old white poplar (Populous tomentosa) trees were harvested from a planted forest in Shandong province, China. Clear samples were cut into size of 25 mm950 mm 9500 mm (radial9tangential9 lon-gitudinal). Twenty-five heat treatments were carried out at five treating temperatures and five treating durations. The five temperatures were 170, 185, 200, 215 and 230°C and five treating duration were 1, 2, 3, 4 and 5 h. A control group of fifteen untreated specimens were used and not treated. To get reliable results, fifteen replicates from fif-teen different trees were used for each treatment condition. Twenty-six clear specimens from each tree were randomly
selected for twenty-five treatments and control group. The specimens were dried to 8 % moisture contents (MC) before they were treated. Steam heat treatments were conducted in an experimental kiln equipped with an elec-trical heating system and a zirconia oxygen analyzer. Steam was used to replace the oxygen. By regulating the amount of steam, the oxygen content in the kiln was con-trolled under 2 % during the treatment.
Measurement of specimen properties
The objective of heat treatment is to minimize wood dimensional change, increase wood durability and modify wood color during thermal treatment. Twelve wood prop-erty variables were measured to evaluate the effect of heat treatment on wood properties. Eight indicators are related to wood physical and mechanical properties, such as oven-dry density (Den), volumetric shrinkage from water-swol-len to air-dry condition (SH-air), volumetric shrinkage from
water-swollen to oven-dry condition (SH-ov), volumetric
swelling from oven-dry to water-swollen condition (SW -ov), volumetric swelling from air-dry to water-swollen
condition (SW-air), equilibrium moisture content (EMC) at
20°C and 65 % relative humidity, modulus of rupture (MOR), modulus of elasticity (MOE). The measurements were made according to ISO standards [18,19].
Wood color was determined using a colorimeter (CR-300, Konica Minolta) according to CIE LAB color space established by the Commission International de Enlumin-ure [17]. Prior to cutting other specimens, 15 samples of each treatment were scanned on tangential section after heat treatment. For control group, wood color is also recorded. The scanning area is a circle with diameter of 8 mm. Three color parameters were collected including lightness (L*), chromatic coordinates on the green–red axis (a*), chromatic coordinates on the blue-yellow axis (b*). For each sample, the mean values of 3 points evenly dis-tributed on the tangential section were recorded.
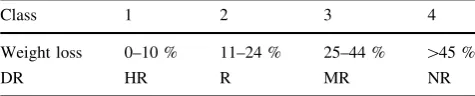
Wood durability was measured after heat treatment. A brown-rot fungi species (Gloeophyllum trabeum) was used to evaluate the decay resistance (DR). The test samples with size of 20 mm920 mm910 mm (radial9 tan-gential9longitudinal) were sawn from the specimens of treatment and control groups. After 12-week exposure to Table 1 Classes of decay resistance used in this study
Class 1 2 3 4
Weight loss 0–10 % 11–24 % 25–44 % [45 %
DR HR R MR NR
fungi, test samples were weighed to calculate the percent weight losses (WL). Weight loss of each treatment was the average value of 15 samples. Four DR classes (Table1) were used as described in ASTM D2017 [20]. Twenty-six test results were classified accordingly.
Data analysis
Using IBM SPSS Statistics 19.0, twenty-six observations with twelve factors were analyzed for data dimensionality reduction. Average values of 15 replicates for each observation were reserved for further analysis. In factor analysis, principal component method was used for data extraction, varimax method for rotation and regression method for computing factor scores. Factor scores for 26
observations were then utilized in the cluster analysis. Hierarchical cluster analysis was performed using between-group linkage method, and data were standardized by Zscores method to compute the squared Euclid distances.
Results and discussion
Property changes of heat-treated wood
Table2 shows the average values of wood properties of 390 specimens from twenty-five treatments and control group. The results indicated that volumetric shrinkage, volumetric swelling, equilibrium moisture content, density and lightness decreased and decay resistance increased Table 2 Measured properties of heat-treated and control poplar woods by treating temperature and duration
Treating Temp. Treating duration (h)
SH-air SH-ov SW-air SW-ov EMC MOR MOE Den Color DR
L* a* b* (%) (%) (%) (%) (%) (Mpa) (Gpa) (g/m3) (%) (%) (%)
Control 6.47 10.98 2.63 11.52 10.23 73.32 10.20 0.446 89.53 0.92 19.14 NR
170°C 1 6.41 10.87 2.53 11.21 8.74 78.17 11.71 0.443 77.11 5.36 23.86 NR 2 6.36 10.82 2.49 10.84 8.85 78.83 11.81 0.442 72.89 6.41 24.47 MR
3 6.27 10.75 2.37 10.69 8.64 81.59 11.67 0.437 69.86 7.27 24.72 MR
4 6.01 10.34 1.93 10.53 8.45 76.99 11.35 0.434 68.51 7.34 25.52 MR
5 5.82 10.21 1.82 10.29 8.27 76.48 11.30 0.430 65.91 7.73 25.98 MR
185°C 1 6.36 10.77 1.99 10.66 8.43 80.30 11.43 0.441 72.36 6.14 25.17 MR 2 5.95 10.39 1.86 9.60 8.13 73.89 11.23 0.432 68.93 6.54 25.20 MR
3 5.71 9.90 1.65 9.53 7.74 73.14 11.08 0.429 63.25 7.69 25.56 MR
4 5.45 9.19 1.52 9.20 7.57 66.48 10.95 0.424 62.51 7.86 25.81 MR
5 5.40 8.96 1.48 9.11 7.41 66.17 10.74 0.421 61.77 8.03 26.06 MR
200°C 1 6.16 10.08 1.79 9.11 7.34 64.44 11.49 0.433 57.68 8.72 24.42 MR 2 5.14 8.56 1.77 8.16 6.31 59.63 11.43 0.427 48.70 9.66 22.99 MR
3 4.50 7.84 1.51 7.75 5.82 51.71 11.38 0.424 43.68 9.64 21.42 MR
4 4.25 7.54 1.44 7.39 5.82 48.71 11.27 0.416 42.05 9.83 21.25 MR
5 4.17 7.32 1.39 6.70 5.44 47.51 11.04 0.411 40.49 9.74 20.45 R
215°C 1 4.50 8.09 1.48 7.76 5.56 54.88 11.48 0.424 43.62 9.48 21.31 MR 2 3.25 6.63 1.38 6.84 5.60 49.10 11.35 0.417 40.66 9.15 19.89 R
3 3.18 6.37 1.27 6.12 5.39 47.18 11.21 0.413 45.83 8.66 21.65 R
4 3.02 6.10 1.21 5.97 5.10 41.63 10.95 0.409 31.27 5.38 16.10 R
5 2.53 5.47 1.14 5.81 5.02 36.97 10.69 0.396 30.58 7.60 14.01 R
230°C 1 3.29 6.14 1.39 6.59 5.03 43.32 11.22 0.412 33.27 8.06 15.87 R 2 2.66 5.33 1.33 5.70 4.76 42.25 11.10 0.411 39.32 7.80 18.07 HR
3 2.43 5.20 1.25 5.53 4.89 37.69 10.81 0.397 29.17 6.88 12.75 HR
4 2.34 5.21 1.21 5.22 4.67 36.01 10.70 0.392 29.39 6.84 12.81 HR
5 2.12 4.89 1.09 5.02 4.77 33.58 10.48 0.385 28.30 6.82 12.45 HR
DR, HR, R, MR, NR are defined in Table1
consistently as treatment temperature and duration increased. Chromatic coordinates (a*, b*) increased to the maximum and then gradually declined during the treat-ment. These results were consistent with many studies reported in a review [11].
MOE showed an increase compared with untreated specimens. MOR rose initially and declined afterwards. Shi et al. [21] studied the mechanical behavior of aspen (Populus spp.) after heat treatment using ThermoWood process. Their research showed that after a treatment at 200°C for 3 h, MOR decreased by 35 % and MOE increased by 15 %. For a same temperature and duration, MOR decreased by 29 % and MOE increased by 12 % in this present study. Heat-treated specimens had a higher strength than control specimens (untreated wood) when the specimens were treated at the temperature at or below 185°C for no more than 2 h. Many researchers also found the increase in MOR at moderate treatments [22,23]. The reasons for the initial improvement in mechanical proper-ties are attributed to the increased cellulose crystallinity. Another important reason is that lower equilibrium mois-ture content of heat-treated wood when placed in service conditions, since mechanical properties increase with decreasing moisture content [24].
Twelve variables changed differently during heat treatment. Plus, treatment temperature and duration have an interaction on the wood properties. Treatment at 215°C for 1 h or treatment at 200°C for 3 h has the same effect on the most wood properties, as presented in Table2. The effect of the treating conditions on the wood properties is complicated and can be classified using cluster analysis.
Correlations between variables
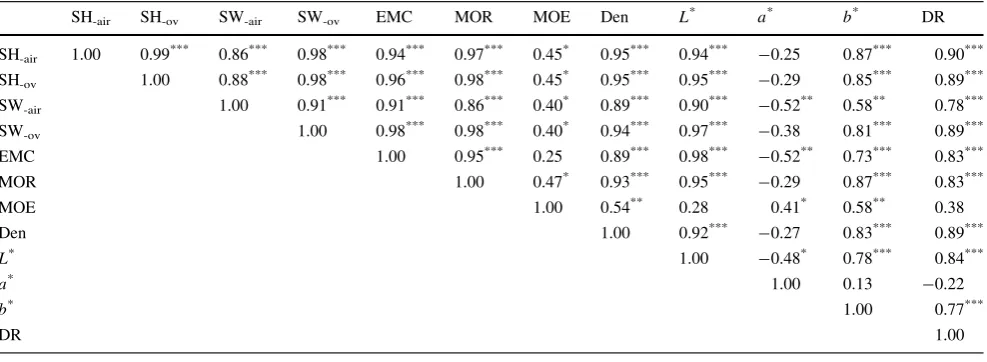
Pearson correlation coefficients between above twelve variables are presented in Table3. It proved out clearly that nine variables (EMC,L*, SW-air, SH-ov, SW-ov, MOR,
DR, SH-airand Den) are highly correlated with one another
at a significant level of 0.001 (correlation coeffi-cient[0.77). Similar results were reported by Robert Welzbacher et al. [25] that durability of beech wood cor-related well withL*, EMC, dimensional stability, etc. The other three variables, MOE,a*,b*, are poorly correlated. This suggested that with a known property among the nine variables, other properties can be calculated. L* can be easily obtained; therefore, it has the potential to be used to predict other properties. The feasibility of predicting wood properties using lightness has been discussed by Gonza´lez-Pen˜a and Hale [26].
Factor analysis
Factor analysis was used for evaluating the relations among the observed variables. Factor analysis of the data from Table2 can interpret 92.17 % of the total variance. After rotation, Factor 1 and Factor 2 account for 77.64 and 14.53 % of the total variance, respectively (Table4). Table5 shows the factor loadings for twelve variables. Each variable can be expressed by a formula of the extracted factors and factor loadings. For instance, SH-air
can be calculated using the formula, 0.976Factor 1 ?0.142Factor 2.
Figure1shows the distribution of variables on the factor loading plot. In the figure, EMC,L*, SW-air, SH-ov, SW-ov,
Table 3 Correlation coefficients and significance levels among measured twelve variables corresponding to the wood properties of poplar specimens
SH-air SH-ov SW-air SW-ov EMC MOR MOE Den L* a* b* DR
SH-air 1.00 0.99*** 0.86*** 0.98*** 0.94*** 0.97*** 0.45* 0.95*** 0.94*** -0.25 0.87*** 0.90***
SH-ov 1.00 0.88*** 0.98*** 0.96*** 0.98*** 0.45* 0.95*** 0.95*** -0.29 0.85*** 0.89***
SW-air 1.00 0.91*** 0.91*** 0.86*** 0.40* 0.89*** 0.90*** -0.52** 0.58** 0.78***
SW-ov 1.00 0.98*** 0.98*** 0.40* 0.94*** 0.97*** -0.38 0.81*** 0.89***
EMC 1.00 0.95*** 0.25 0.89*** 0.98*** -0.52** 0.73*** 0.83***
MOR 1.00 0.47* 0.93*** 0.95*** -0.29 0.87*** 0.83***
MOE 1.00 0.54** 0.28 0.41* 0.58** 0.38
Den 1.00 0.92*** -0.27 0.83*** 0.89***
L* 1.00 -0.48* 0.78*** 0.84***
a* 1.00 0.13 -0.22
b* 1.00 0.77***
DR 1.00
Variables are defined in Table2
MOR, DR, SH-air and Den distributed heavily and had
strong positive loadings on Factor 1. This indicated that these variables were highly linear correlated with one another and Factor 1 had major effect on these properties. The other three variables, MOE,a*andb*, were compar-atively scattered and had strong loadings on Factor 2. Their variation was different from other nine variables.
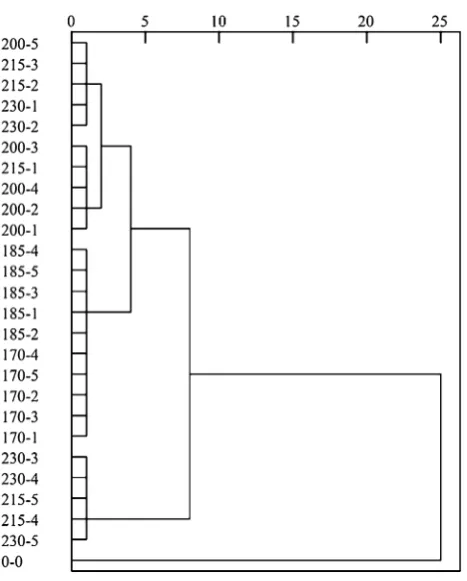
Cluster analysis with twelve measured variables
Cluster analysis of twenty-five treatments and the control samples was done based on computed factor scores. Fig-ure2 exhibited the dendrogram of those clusters. Treat-ments are represented as ‘‘Temperature-duration’’. For instance, ‘‘170-1’’ means treatment at 170°C for 1 h; ‘‘0-0’’ symbolized the control group. According to cluster distances, treated specimens were divided into 2, 3 or 4 clusters.
Specimens could be divided into 2 clusters: one cluster consisted of the control specimens and another cluster consisted of specimens in twenty-five treatments. This classification differentiates untreated wood from heat-treated wood. The result showed that the heat treatment has significant effect on wood properties.
If the specimens were divided into 3 clusters, one cluster consisted of the specimens in the control group, another cluster the specimens from five treatments of higher tem-perature and longer duration (at 215°C for 4–5 h or 230 °C for 3–5 h) and last cluster of specimens from the remaining twenty heat treatments of lower intensities. The result suggested that the treatments of higher temperature above 215°C and duration influenced wood properties dramatically. The treatments significantly increased Table 4 Variance explained after extracted two factors and rotated using varimax method
Factor Initial variance explained Extraction sums of squared loadings Rotated sums of squared loadings
Total % of Variance Cumulative (%) Total % of Variance Cumulative (%) Total % of Variance Cumulative (%)
1 9.368 78.07 78.07 9.368 78.07 78.07 9.317 77.64 77.64
2 1.693 14.11 92.17 1.693 14.11 92.17 1.744 14.53 92.17
3 0.486 4.05 96.22
4 0.236 1.97 98.19
5 0.088 0.73 98.92
6 0.059 0.49 99.41
7 0.035 0.29 99.70
8 0.017 0.14 99.85
9 0.008 0.07 99.92
10 0.005 0.04 99.96
11 0.004 0.03 99.99
12 0.001 0.01 100.00
Table 5 Loadings on factor 1 and factor 2 for twelve measured variables
Factor 1 Factor 2
SH-air 0.976 0.142
SH-ov 0.986 0.106
SW-air 0.923 -0.122
SW-ov 0.994 0.018
EMC 0.978 -0.152
MOR 0.974 0.118
MOE 0.397 0.782
Den 0.958 0.161
L* 0.981 -0.105
a* -0.406 0.873
b* 0.806 0.483
DR 0.891 0.126
dimensional stability, darkened wood, increased decay resistance, but decreased bending strength (about 50 % in this study).
If the specimens were divided into 4 clusters, Cluster 1 consisted of the specimens from control group. Cluster 2 had the specimens from ten treatments at the lower tem-perature of 170 and 185°C. Cluster 3 had specimens from ten mild treatments, with five treatments at 200°C, and the other five treatments at the temperature and duration of 215°C, 1–3 h and 230°C, 1–2 h. Cluster 4 had specimens from the remaining five treatments with higher temperature
and longer duration of 215°C, 4–5 h and 230°C, 3–5 h. Clustering results of these four clusters are presented in Table6.
Wood properties of the specimens in each cluster are listed in Table7. MOE of the specimens from three tested clusters showed an increase \17 %. For the specimens from cluster 2, EMC declined by 13–28 %, and the dura-bility increased from nonresistant to moderate (except for the treatment at 170 °C for 1 h). In the cluster 2 MOR changed within ±11 %. In cluster 3, EMC decreased by more than 28 %, and the durability ranged from moderate to highly resistant. In cluster 3, MOR decreased by more than 12 %. In cluster 4, EMC decreased by more than 50 % and the durability changed to resistant or highly resistant. However, MOR reduced by 54 %. Lumber with severe treatments, as in cluster 4, can be applied in outdoor environment and not suggested for in the structural uses.
Specimens from treatments were grouped into other clusters when temperature surpassed 200°C. The results indicated that wood properties changed significantly when the treating temperature exceeded 200°C. This critical temperature was also identified in the previous research [10]. Wood properties significantly change at the temper-ature above 200 °C [27].
The results of cluster analysis provided evidence for classification of heat-treated wood with similar properties. According to the classification, treating temperature and duration can be selected for different end uses.
Cluster analysis with the selected variables
Previous cluster analysis with twelve wood properties produced a good result. However, large amount of data were collected. It is possible that fewer representative wood properties can be selected and the information loss can be minimized to obtain a reliable cluster analysis result. The result of factor analysis can be used for the selection of variables. In view of variable distribution in Fig.1, twelve wood properties can be classified into four Fig. 2 Cluster dendrogram based on twelve measured variables. The
horizontal axis shows the distances of clusters; the vertical axis represents twenty-five treatments and the control group
Table 6 Clustering results of 4
clusters 0 h 1 h 2 h 3 h 4 h 5 h
170 °C
Control 185 °C
200 °C
215 °C
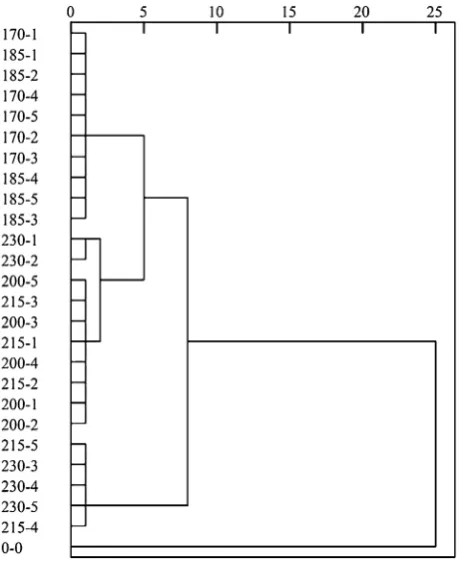
categories. One category is nine densely distributed vari-ables, and other variables belonged to other three catego-ries separately. To reduce information loss, selected variables should contain variables of the four categories, that is, a*, b*, MOE and at least one of the above nine densely distributed variables.
Variable cluster analysis can be another useful tool by classifying variables according to their correlations. Using IBM SPSS Statistics 19.0, variable cluster analysis was conducted with data in Table2. The result showed that nine highly correlated variables (SH-air, SH-ov, SW-ov,
MOR, Dens, DR, EMC, L* and SW-air) can be grouped
together, the other 3 variables belonged to different groups, which is consistent with results from factor analysis. MOR is an indication of the strength and EMC is associated with
the moisture exchange within the environment. EMC is also associated with the swelling and shrinkage variables (Table3). From the factor analysis and variable cluster analysis, five representative variables were selected as follows: MOR, EMC, a*, b*, MOE. Factor analysis and cluster analysis of specimens from 25 treatments and control group were conducted with the five variables and results are shown in Fig.3.
Figure3 shows that clustering results using selected variables were same as those from previous analysis when divided into 2, 3 and 4 clusters. This result suggested that for the evaluation and classification of heat-treated wood, only using wood properties of MOR, EMC, a*, b* and MOE can show the changes in all other wood properties after heat treatment. Cluster analysis is a useful tool for classification and evaluation of heat-treated wood.
Conclusions
The white poplar wood specimens were heat treated at five treating temperatures and five treating durations. Twelve wood property indicators representing color, durability, physical and mechanical properties were measured. Cluster analysis was used for the classification of heat-treated wood. The conclusions of the study are as follows. 1. The statistical analysis showed that variables, such as
volumetric swelling, volumetric shrinkage, equilibrium moisture content, decay resistance, lightness, modulus of rupture and oven-dry density, can be grouped with high correlation with one another after heat treatment. Other variables, such as a*,b*, MOE, have relatively poor correlation and were enlisted as the separated group.
2. Cluster analysis can classify 26 treated and untreated groups into 2, 3 or 4 clusters. In 2 clusters, it can distinguish control specimens from heat-treated spec-imens. In 3 clusters, heat treatments are further divided into two intensities. In 4 clusters, four groups can represent the non-treated samples, samples with mild, moderate and severe treating conditions. At the mild Table 7 Properties’ changes of heat-treatedPopulous tomentosawood in the divided clusters
EMC (%) MOR (%) MOE (%) DE* DR
Cluster 1 0 0 0 0 NR
Cluster 2 -(13–28) (?11 to-10) ?(5–16) 14–38 NR–MR
Cluster 3 -(28–53) -(12–42) ?(8–13) 34–56 MR–HR
Cluster 4 -(50–54) -(43–54) ?(3–7) 59–62 R–HR
‘‘%’’ is the change rate compared to control group, ‘‘?’’ means increase, ‘‘-’’ means decrease,DE*is total color difference, EMC, MOR, MOE and DR are the same in Table2
treatment, MOR was reduced\11 %. Wood durability increased to moderate resistant. At the moderate treatment, EMC decreased by 28 %, and MOR was decreased by more than 12 %. In the severe treatment, wood durability increased to resistant or highly resistant; however, its MOR was reduced half.
Acknowledgments This work was supported by the key project of ‘‘Twelfth Five-year Plan’’ of National Science and Technology (Grant No. 2012BAD24B02).
References
1. Kamdem DP, Pizzi A, Jermannaud A (2002) Durability of heat-treated wood. Holz Roh Werkst 60:1–6
2. Cao Y, Lu J, Huang R, Zhao Y, Wu Y (2011) Evaluation of decay resistance for steam-heat-treated wood. Bioresources 6:4696–4704
3. Wang JY, Cooper PA (2005) Effect of oil type, temperature and time on moisture properties of hot oil-treated wood. Holz Roh Werkst 63:417–422
4. Esteves B, Marques AV, Domingos I, Pereira H (2007) Influence of steam heating on the properties of pine (Pinus pinaster) and eucalypt (Eucalyptus globulus) wood. Wood Sci Technol 41:193–207
5. Cao Y, Lu J, Huang R, Jiang J (2012) Increased dimensional stability of Chinese fir through steam-heat treatment. Eur J Wood Wood Prod 70:441–444
6. Bekhta P, Niemz P (2003) Effect of high temperature on the change in color, dimensional stability and mechanical properties of spruce wood. Holzforschung 57:539–546
7. Esteves B, Marques AV, Domingos I, Pereira H (2008) Heat-induced colour changes of pine (Pinus pinaster) and eucalypt (Eucalyptus globulus) wood. Wood Sci Technol 42:369–384 8. Gonza´lez-Pen˜a MM, Hale MD (2009) Color in thermally
modi-fied wood of beech, Norway spruce and Scots pine. Part 1: color evolution and color changes. Holzforschung 63:385–393 9. Widmann R, Fernandez-Cabo JL, Steiger R (2012) Mechanical
properties of thermally modified beech timber for structural purposes. Eur J Wood Wood Prod 70:775–784
10. Cao Y, Jiang JH, Lu JX, Huang RF (2012) Effect of steam-heat treatment on mechanical properties of Chinese fir. Bioresources 7:1123–1133
11. Esteves B, Pereira H (2009) Wood modification by heat treat-ment: a review. Bioresources 4:370–404
12. Syrjanen T, Oy K (2001) Production and classification of heat treated wood in Finland. In: Review on heat treatments of wood. Proceedings of the special seminar held in Antibes, pp 7–16
13. Hinterstoisser B, Schwanninger M, Stefke B, Stingl R, Patzelt M (2003) Surface analysis of chemically and thermally modified wood by FT-NIR. In: Acker J, Hill ASC (eds) The first European conference on wood modification: ECWM 2003, Ghent, Belgium, 3–4 April 2003, University Laboratory of Wood Technology, pp 65–70
14. Ba¨chle H, Zimmer B, Wegener G (2012) Classification of ther-mally modified wood by FT-NIR spectroscopy and SIMCA. Wood Sci Technol 46:1181–1192
15. Taghiyari HR, Talaei A, Karimi A (2011) A correlation between the gas and liquid permeabilities of beech wood heat-treated in hot water and steam mediums. Maderas CiencTecnol 13:329–336 16. Sandak A, Sandak J, Pradzynski W, Zborowska M, Negri M (2009) Near infrared spectroscopy as a tool for characterization of wood surface. Folia For Pol Ser B 40:31–40
17. Schnabel T, Zimmer B (2007) An approach to classify thermally modified hardwoods by color. For Prod J 57:105–110
18. Pometti CL, Pizzo B, Brunetti M, Macchioni N, Ewens M, Saidman BO (2009) Argentinean native wood species: physical and mechanical characterization of some Prosopis species and Acacia aroma(Leguminosae; Mimosoideae). Bioresour Technol 100:1999–2004
19. Du¨ndar T, Bu¨yu¨ksarıU¨ , AvcıE, Akkılıc¸ H (2012) Effect of heat treatment on the physical and mechanical properties of com-pression and opposite wood of black pine. Bioresources 7:5009–5018
20. ASTM D2017-05 (2005) Standard test method of accelerated laboratory test of natural decay resistance of woods. American Society for Testing and Materials, West Conshohocken, PA 21. Shi JL, Kocaefe D, Zhang J (2007) Mechanical behaviour of
Que´bec wood species heat-treated using ThermoWood process. Holz Roh Werkst 65:255–259
22. Kubojima Y, Okano T, Ohta M (2000) Bending strength and toughness of heat-treated wood. J Wood Sci 46:8–15
23. Kocaefe D, Poncsak S, Boluk Y (2008) Effect of thermal treat-ment on the chemical composition and mechanical properties of birch and aspen. Bioresources 3:517–537
24. Borrega M, Ka¨renlampi PP (2008) Mechanical behavior of heat-treated spruce (Picea abies) wood at constant moisture content and ambient humidity. Holz Roh Werkst 66:63–69
25. Robert Welzbacher C, Brischke C, Otto Rapp A (2007) Influence of treatment temperature and duration on selected biological, mechanical, physical and optical properties of thermally modified timber. Wood Mater Sci Eng 2:66–76
26. Gonza´lez-Pen˜a MM, Hale MD (2009) Color in thermally modi-fied wood of beech, Norway spruce and Scots pine. Part 2: property predictions from color changes. Holzforschung 63:394–401