doi:10.1155/2011/164956
Research Article
A Low-Complexity Algorithm for Static Background Estimation
from Cluttered Image Sequences in Surveillance Contexts
Vikas Reddy,
1, 2Conrad Sanderson,
1, 2and Brian C. Lovell
1, 21NICTA, P.O. Box 6020, St Lucia, QLD 4067, Australia
2School of ITEE, The University of Queensland, QLD 4072, Australia
Correspondence should be addressed to Conrad Sanderson,[email protected]
Received 27 April 2010; Revised 23 August 2010; Accepted 26 October 2010
Academic Editor: Carlo Regazzoni
Copyright © 2011 Vikas Reddy et al. This is an open access article distributed under the Creative Commons Attribution License, which permits unrestricted use, distribution, and reproduction in any medium, provided the original work is properly cited.
For the purposes of foreground estimation, the true background model is unavailable in many practical circumstances and needs to be estimated from cluttered image sequences. We propose a sequential technique for static background estimation in such conditions, with low computational and memory requirements. Image sequences are analysed on a block-by-block basis. For each block location a representative set is maintained which contains distinct blocks obtained along its temporal line. The background estimation is carried out in a Markov Random Field framework, where the optimal labelling solution is computed using iterated conditional modes. The clique potentials are computed based on the combined frequency response of the candidate block and its neighbourhood. It is assumed that the most appropriate block results in the smoothest response, indirectly enforcing the spatial continuity of structures within a scene. Experiments on real-life surveillance videos demonstrate that the proposed method obtains considerably better background estimates (both qualitatively and quantitatively) than median filtering and the recently proposed “intervals of stable intensity” method. Further experiments on the Wallflower dataset suggest that the combination of the proposed method with a foreground segmentation algorithm results in improved foreground segmentation.
1. Introduction
Intelligent surveillance systems can be used effectively for monitoring critical infrastructure such as banks, airports, and railway stations [1]. Some of the key tasks of these systems are real-time segmentation, tracking and analysis of foreground objects of interest [2, 3]. Many approaches for detecting and tracking objects are based on background subtraction techniques, where each frame is compared against a background model for foreground object detection. The majority of background subtraction methods adap-tively model and update the background for every new input frame. Surveys on this class of algorithms are found in [4,5]. However, most methods presume that the training image sequence used to model the background is free from foreground objects [6–8]. This assumption is often not true in the case of uncontrolled environments such as train stations and airports, where directly obtaining a clear background is almost impossible. Furthermore, in certain situations a strong illumination change can render
the existing background model ineffective, thereby forcing us to compute a new background model. In such circumstances, it becomes inevitable to estimate the background using cluttered sequences (i.e., where parts of the background are occluded). A good background estimate will complement the succeeding background subtraction process, which can result in improved detection of foreground objects.
Existing background estimation techniques, such as simple median filtering, typically require the storage of all the input frames in memory before estimating the background. This increases memory requirements immensely. In this paper, we propose a robust background estimation algorithm in a Markov Random Field (MRF) framework. It operates on the input frames sequentially, avoiding the need to store all the frames. It is also computationally less intensive, enabling the system to achieve real-time performance—this aspect is critical in video surveillance applications. This paper is a thoroughly revised and extended version of our previous work [10].
We continue as follows. Section 2 gives an overview of existing methods for background estimation. Section 3
describes the proposed algorithm in detail. Results from experiments on real-life surveillance videos are given in Section4, followed by the main findings in Section5.
2. Previous Work
Existing methods to address the cluttered background esti-mation problem can be broadly classified into three cate-gories: (i) pixel-level processing, (ii) region-level processing, and (iii) a hybrid of the first two. It must be noted that all methods assume the background to be static. The three categories are overviewed in the sections below.
2.1. Pixel-Level Processing. In the first category, the simplest techniques are based on applying a median filter on pixels at each location across all the frames. Lo and Velastin [11] apply this method to obtain reference background for detecting congestion on underground train platforms. However, its limitation is that the background is estimated correctly only if it is exposed for more than 50% of the time. Long and Yang [12] propose an algorithm that finds pixel intervals of stable intensity in the image sequence, then heuristically chooses the value of the longest stable interval to most likely represent the background. Bevilacqua [13] applies Bayes’ theorem in his proposed approach. For every pixel, it estimates the intensity value to which that pixel has the maximum posterior probability.
Wang and Suter [14] employ a two-staged approach. The first stage is similar to that of [12], followed by choosing background pixel values whose interval maximises an objective function. It is defined as Nlk/Slk where Nlk and Slk are the length and standard variance of the kth interval of pixel sequencel. The method proposed by Kim et al. [15] quantises the temporal values of each pixel into distinct bins called codewords. For each codeword, it keeps a record of the maximum time interval during which it has not recurred. If this time period is greater than N/2, whereNis the total number of frames in the sequence, the corresponding codeword is discarded as foreground pixel. The system recently proposed by Chiu et al. [16] estimates the background and utilises it for object segmentation. Pixels obtained from each location along its time axis are clustered based on a threshold. The pixel corresponding to the cluster
having the maximum probability and greater than a time-varying threshold is extracted as background pixel.
All these pixel-based techniques can perform well when the foreground objects are moving, but are likely to fail when the time interval of exposure of the background is less than that of the foreground.
2.2. Region-Level Processing. In the second category, the method proposed by Farin et al. [17] performs a rough seg-mentation of input frames into foreground and background regions. To achieve this, each frame is divided into blocks, the temporal sum of absolute differences (SAD) of the colocated blocks is calculated, and a block similarity matrix is formed. The matrix elements that correspond to small SAD values are considered as stationary elements and high SAD values correspond to nonstationary elements. A median filter is applied only on the blocks classified as background. The algorithm works well in most scenarios, however, the spatial correlation of a given block with its neighbouring blocks already filled by background is not exploited, which can result in estimation errors if the objects are quasistationary for extended periods.
In the method proposed by Colombari et al. [18], each frame is divided into blocks of size N ×N overlapping by 50% in both dimensions. These blocks are clustered using single linkage agglomerative clustering along their time-line. In the following step, the background is built iteratively by selecting the best continuation block for the current background using the principles of visual grouping. The spatial correlations that naturally exist within small regions of the background image are considered during the estimation process. The algorithm can have problems with blending of the foreground and background due to slow moving or quasistationary objects. Furthermore, the algorithm is unlikely to achieve real-time performance due to its complexity.
2.3. Hybrid Approaches. In the third category, the algorithm presented by Gutchess et al. [19] has two stages. The first stage is similar to that of [12], with the second stage estimating the likelihood of background visibility by computing the optical flow of blocks between successive frames. The motion information helps classify an intensity transition as background to foreground or vice versa. The results are typically good, but the usage of optical flow for each pixel makes it computationally intensive.
In [20], Cohen views the problem of estimating the background as an optimal labelling problem. The method defines an energy function which is minimised to achieve an optimal solution at each pixel location. It consists of
(a) (b)
Figure1: Typical example of estimating the background from an cluttered image sequence: (a) input frames cluttered with foreground objects, where only parts of the background are visible; (b) estimated background.
robust estimates, however, their main drawback is large computational complexity to process a small number of input frames. For instance, in [22] the authors report a prototype of the algorithm on Matlab takes about 2.5 minutes to estimate the background from a set of only 10 images of QVGA resolution (320×240).
3. Proposed Algorithm
We propose a computationally efficient, region-level algo-rithm that aims to address the problems described in the previous section. It has several additional advantages as well as novelties, including the following.
(i) The background estimation problem is recast into an MRF scheme, providing a theoretical framework. (ii) Unlike the techniques mentioned in Section2, it does
not expect all frames of the sequence to be stored in memory simultaneously—instead, it processes frames sequentially, which results in a low memory footprint.
(iii) The formulation of the clique potential in the MRF scheme is based on the combined frequency response of the candidate block and its neighbourhood. It is assumed that the most appropriate configuration results in the smoothest response (minimum energy), indirectly exploiting the spatial correlations within small regions of a scene.
(iv) Robustness against high frequency image noise. In the calculation of the energy potential, we compute 2D Discrete Cosine Transform (DCT) of the clique. The high frequency DCT coefficients are ignored in the analysis as they typically represent image noise.
3.1. Overview of the Algorithm. In the text below, we first provide an overview of the proposed algorithm, followed by a detailed description of its components (Sections3.2to3.5). It is assumed that at each block location: (i) the background is static and is revealed at some point in the training sequence for a short interval and (ii) the camera is stationary. The
background is estimated by recasting it as a labelling problem in an MRF framework. The algorithm has three stages.
Let the resolution of the greyscale image sequenceI be W×H. In the first stage, the frames are viewed as instances of an undirected graph, where the nodes of the graph are blocks of sizeN×Npixels (for implementation purposes, each block location and its instances at every frame are treated as a node and its labels, resp.). We denote the nodes of the graph by N(i,j) fori=0, 1, 2,. . ., (W/N)−1,j=0, 1, 2,. . ., (H/N)− 1. LetIf be thefth frame of the training image sequence and let its corresponding node labels be denoted byLf(i,j), and f = 1, 2,. . .,F, whereFis the total number of frames. For convenience, each node labelLf(i,j) is vectorised into an N2dimensional vectorl
f(i,j).
At each node location (i,j), a representative setR(i,j) is maintained. It contains distinct labels that were obtained along its temporal line. Two labels are considered as distinct (visually different) if they fail to adhere to one of the constraints described in Section 3.2. Let these unique representative labels be denoted byrk(i,j) fork=1, 2,. . .,S (with S ≤ F), whererk denotes the mean of all the labels which were considered as similar to each other (mean of the cluster). Each label rk has an associated weight Wk which denotes its number of occurrences in the sequence, that is, the number of labels at location (i,j) which are deemed to be the same asrk(i,j). For every such match, the correspondingrk(i,j) and its associated variance,Σk(i,j), are updated recursively as given below:
rnewk =roldk + 1
Wk+ 1
lf −roldk
, (1)
Σnew
k =
Wk−1
Wk Σ
old k +
1
Wk+ 1
lf−rold
k
lf−rold k
, (2)
(a) (b) (c) (d)
Figure2: (a) Example frame from an image sequence, (b) partial background initialisation (afterStage 2), (c) remaining background estimation in progress (Stage 3), (d) estimated background.
In the second stage, representative sets R(i,j) having just one label are used to initialise the corresponding node locationsB(i,j) in the backgroundB.
In the third stage, the remainder of the background is estimated iteratively. An optimal labelling solution is calculated by considering the likelihood of each of its labels along with the a priori knowledge of the local spatial neighbourhood modelled as an MRF. Iterated conditional mode (ICM), a deterministic relaxation technique, performs the optimisation. The framework is described in detail in Section 3.3. The strategy for selecting the location of an empty background node to initialise a label is described in Section3.4. The procedure for calculating the energy poten-tials, a prerequisite in determining thea prioriprobability, is described in Section3.5.
The overall pseudocode of the algorithm is given in Algorithm1 and an example of the algorithm in action is shown in Figure2.
3.2. Similarity Criteria for Labels. We assert that two labels lf(i,j) andrk(i,j) are similar if the following two constraints are satisfied:
rki,j−μrk
i,jlfi,j−μlf
i,j
σrkσlf >T1
, (3)
1
N2
N2−1
n=0 dkn
i,j<T2. (4)
Equations (3) and (4), respectively, evaluate the correlation coefficient and the mean of absolute differences (MAD) between the two labels, with the latter constraint ensuring that the labels are close inN2dimensional space.μ
rk,μlf and σrk,σlf are the mean and standard deviation of the elements of labels rk and lf, respectively, whiledk(i,j) = lf(i,j)− rk(i,j).
T1is selected empirically (see Section4), to ensure that two visually identical labels are not treated as being different due to image noise.T2is proportional to image noise and is found automatically as follows. Using a short training video, the MAD between colocated labels of successive frames is calculated. Let the number of frames beLand letNbbe the number of labels per frame. The total MAD points obtained will be (L−1)Nb. These points are sorted in ascending order
and divided into quartiles. The points lying between quartiles Q3 and Q1 are considered. Their mean, μQ31 and standard
deviation,σQ31, are used to estimateT2as 2×(μQ31+ 2σQ31).
This ensures that low MAD values (close or equal to zero) and high MAD values (arising due to movement of objects) are ignored (i.e., treated as outliers).
We note that both constraints (3) and (4) are nec-essary. As an example, two vectors [1, 2,. . ., 16] and [101, 102,. . ., 116] have a perfect correlation of 1 but their MAD will be higher thanT2. On the other hand, if a thin edge of the foreground object is contained in one of the labels, their MAD may be well withinT2. However, (3) will be low enough to indicate the dissimilarity of the labels. In contrast, we note that in [18] the similarity criteria are just based on the sum of squared distances between the two blocks.
3.3. Markov Random Field (MRF) Framework. Markov ran-dom field/probabilistic undirected graphical model theory provides a coherent way of modelling context-dependent entities such as pixels or edges of an image. It has a set of nodes, each of which corresponds to a variable or a group of variables, and set of links each of which connects a pair of nodes. In the field of image processing it has been widely employed to address many problems, that can be modelled as labelling problem with contextual information [23,24].
LetXbe a 2D random field, where each random variate X(i,j)(∀i,j) takes values in discretestate spaceΛ. Letω∈Ω be aconfigurationof the variates inX, and letΩbe the set of all such configurations. The joint probability distribution of Xis considered Markov if
p(X=ω)>0, ∀ω∈Ω,
pX(i,j)|X(p,q),
i,j=/p,q=pX(i,j)|XN(i,j)
,
(5)
whereXN(i,j)refers to the localneighbourhood systemofX(i,j).
Unfortunately, the theoretical factorisation of the joint probability distribution of the MRF turns out to be intractable. To simplify and provide computationally effi -cient factorisation, Hammersley-Clifford theorem [25] states that an MRF can equivalently be characterised by a Gibbs distribution. Thus
p(X=ω)=e−U(ω)/T
Stage 1: Collection of Label Representatives (1)R← ∅(null set)
(2)for f=1 toFdo
(a) Split input frameIf into node labels, each with a size ofN×N. (b)for eachnode labelLf(i,j)do
(i) Vectorise nodeLf(i,j) intolf(i,j).
(ii) Find the representative labelrm(i,j) from the set
R(i,j)=(rk(i,j)|1≤k≤S), matching tolf(i,j) based on conditions in (3) and (4).
if(R(i,j)={∅}or there is no match).then
k←k+ 1
Add a new representative labelrk(i,j)←lf(i,j) to setR(i,j) and initialise its weight,Wk(i,j), to 1.
else
Recursively update the matched labelrm(i,j) and its variance given by (1) and (2), respectively.
Wm(i,j)←Wm(i,j) + 1
end if end for each end for
Stage 2: Partial Background Initialisation (1)B← ∅
(2)for eachsetR(i,j)do if(size(R(i,j))=1)then
B(i,j)←r1(i,j).
end if end for each
Stage 3: Estimation of the Remaining Background (1)Full background initialisation
while(Bnot filled)do
if B(i,j)= ∅and has neighbours as specified in Section3.4then
B(i,j)←rmax(i,j), the label out of setR(i,j) which yields maximum value of the posterior probability described in (11) (see Section3.3).
end if end while
(2)Application of ICM iteration count←0
while(iteration count < total iterations)do for eachsetR(i,j)do
ifP(rnew(i,j))> P(rold(i,j))then
B(i,j)←rnew(i,j), whereP(·) is the posterior probability defined by (11).
end if end for each
iteration count=iteration count+ 1
end while
Algorithm1: Pseudo-code for the proposed algorithm.
where
Z=
ω
e−U(ω)/T (7)
is a normalisation constant known as thepartition function, Tis a constant used to moderate the peaks of the distribution and U(ω) is an energy function which is the sum of
clique/energy potentialsVcover all possible cliquesC:
U(ω)=
c∈C
Vc(ω). (8)
The value of Vc(ω) depends on the local configuration of cliquec.
In our framework, information from two disparate sources is combined using Bayes’ rule. The local visual obser-vations at each node to be labelled yield label likelihoods. The resulting label likelihoods are combined witha priorispatial knowledge of the neighbourhood represented as an MRF.
simplify the notations, index term (i,j) has been henceforth omitted).
Using Bayes’ rule, the posterior probability for every label at each node is derived from thea prioriprobabilities and the observation-dependent likelihoods given by
P(rk)=l(rk)p(rk). (9)
The product is comprised of likelihood l(rk) of each labelrk of setR and itsa priori probability density p(rk), conditioned on its local neighbourhood. In the derivation of likelihood function, it is assumed that at each node the observation components rk are conditionally independent and have the same known conditional density function dependent only on that node.
At a given node, the label that yields maximuma poste-riori(MAP) probability is chosen as the best continuation of the background at that node.
To optimise the MRF-based function defined in (9), ICM is used since it is computationally efficient and avoids large-scale effects (an undesired characteristic where a single label wrongly gets assigned to most of the nodes of the random field). [24]. ICM maximises local conditional probabilities iteratively until convergence is achieved.
Typically, in ICM an initial estimate of the labels is obtained by maximising the likelihood function. However, in our framework an initial estimate consists of partial reconstruction of the background at nodes having just one label which is assumed to be the background. Using the available background information, the remaining unknown background is estimated progressively (see Section3.4).
At every node, the likelihood of each of its labelsrk(k = 1, 2,. . .,S) is calculated using corresponding weightsWk(see Section3.1). The higher the occurrences of a label, the more is its likelihood to be part of the background. Empirically, the likelihood function is modelled by a simple weighted function given by:
l(rk)=SWck
k=1Wck
, (10)
whereWck =min(Wmax,Wk) andWmax=5×frame rate of the captured sequence (it is assumed that the likelihood of a label exposed for a duration of 5 seconds is good enough to be regarded as a potential candidate for the background).
As evident, the weight W of a label greater thanWmax will be capped toWmax. Setting a maximum threshold value is necessary in circumstances where the image sequence has a stationary foreground object visible for an exceedingly long period when compared to the background occluded by it. For example, in a 1000-frame sequence, a car might be parked for the first 950 frames and in the last 50 frames it drives away. In this scenario, without the cap the likelihood of the car being part of the background will be too high compared to the true background and this will bias the overall estimation process causing errors in the estimated background.
Relying on this likelihood function alone is insufficient since it may still introduce estimation errors even when the
A
D
F
B
E
H C
G X
Figure 3: The local neighbourhood system and its four cliques. Each clique is comprised of 4 nodes (blocks). To demonstrate one of the cliques, the the top-left clique has dashed links.
foreground object is exposed for just slightly longer duration compared to the background.
Hence, to overcome this limitation, the spatial neigh-bourhood modelled as Gibbs distribution (given by (6)) is encoded into ana prioriprobability density. The formulation of the clique potentialVc(ω) referred in (8) is described in the Section3.5. Using (6), (7), and (8), the calculated clique potentialsVc(ω) are transformed intoa prioriprobabilities. For a given label, the smaller the value of energy function, the greater is its probability in being the best match with respect to its neighbours.
In our evaluation of the posterior probability given by (9), the local spatial context term is assigned more weight than the likelihood function which is just based on temporal statistics. Thus, taking log of (9) and assigning a weight to the prior, we get
log(P(rk))=log(l(rk)) +ηlog
p(rk)
, (11)
whereηhas been empirically set to number of neighbouring nodes used in clique potential calculation (typicallyη=3).
The weight is required in order to address the scenario where the true background label is visible for a short interval of time when compared to labels containing the foreground. For example, in Figure 2, a sequence consisting of 450 frames was used to estimate its background. The person was standing as shown in Figure 2(a) for the first 350 frames and eventually walked offduring the last 100 frames. The algorithm was able to estimate the background occluded by the standing person. It must be noted that pixel-level processing techniques are likely to fail in this case.
the corner regions in the video frames corresponds to a static region.
The rest of the nodes are initialised based on constraints as explained below. In our framework, the local neighbour-hood system [23] of a node and the corresponding cliques are defined as shown in Figure 3. A clique is defined as a subset of the nodes in the neighbourhood system that are fully connected. The background at an empty node will be assigned only if at least 2 neighbouring nodes of its 4-connected neighbours adjacent to each other and the diagonal node located between them are already assigned with background labels. For instance, in Figure 3, we can assign a label to nodeX if at least nodesB,D, (adjacent 4-connected neighbours) andA(diagonal node) have already been assigned with labels. In other words, label assignment at nodeXisconditionally independent of all other nodes given these 3 neighbouring nodes.
Node X has nodes D,B, E, and G as its 4-connected neighbours. Let us assume that all nodes except X are labelled. To label node X the procedure is as follows. In Figure3, four cliques involvingXexist. For each candidate label at node X, the energy potential for each of the four cliques is evaluated independently given by (12) and summed together to obtain its energy value. The label that yields the least value is likely to be assigned as the background.
Mandating that the background should be available in at least 3 neighbouring nodes located in three different directions with respect to node X ensures that the best match is obtained after evaluating the continuity of the pixels in all possible orientations. For example, in Figure 4, this constraint ensures that the edge orientations are well taken into account in the estimation process. It is evident from examples in Figure4that using either horizontal or vertical neighbours alone can cause errors in background estimation (particularly at edges).
Sometimes not all the three neighbours are available. In such cases, to assign a label at nodeXwe use one of its 4-connected neighbours whose node has already been assigned with a label. Under these contexts, the clique is defined as two adjacent nodes either in the horizontal or vertical direction.
Typically, after initialising all the empty nodes, an accu-rate estimate of the background is obtained. Nonetheless, in certain circumstances an incorrect label assignment at a node may cause an error to occur and propagate to its neighbourhood. Our previous algorithm [10] is prone to this type of problem. However, in the current framework the problem is successfully redressed by the application of ICM. In subsequent iterations, in order to avoid redundant calculations, the label process is carried out only at nodes where a change in the label of one of their 8-connected neighbours occurred in the previous iteration.
3.5. Calculation of the Energy Potential. In Figure 3, it is assumed that all nodes except X are assigned with the background labels. The algorithm needs to assign an optimal label at nodeX. Let nodeX haveSlabels in its state space R for k = 1, 2,. . .,S where one of them represents the
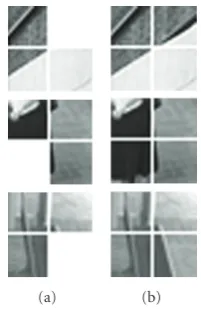
(a) (b)
Figure4: (a) Three cliques each of which has an empty node. The gaps between the blocks are for ease of interpretation only. (b) Same cliques where the empty node has been labelled. The constraint of 3 neighbouring nodes to be available in 3 different directions as illustrated ensures that arbitrary edge continuities are taken into account while assigning the label at the empty node.
true background. Choosing the best label is accomplished by analysing the spectral response of every possible clique constituting the unknown node X. For the decomposition, we chose the Discrete Cosine Transform (DCT) [26] due to its decorrelation properties as well as ease of implementation in hardware. The DCT coefficients were also utilised by Wang et al. [27] to segment moving objects from compressed videos.
We consider the top left clique consisting of nodesA,B, D, andX. NodesA,B, andCare assigned with background labels. NodeX is assigned with one ofS candidate labels. We take the 2D DCT of the resulting clique. The transform coefficients are stored in matrixCkof sizeM×M(M=2N) with its elements referred to asCk(v,u). The term Ck(0, 0) (reflecting the sum of pixels at each node) is forced to 0 since we are interested in analysing the spatial variations of pixel values.
Similarly, for other labels present in the state space of node X, we compute their corresponding 2D DCT as mentioned above. A graphical example of the procedure is shown in Figure5.
Assuming that pixels close together have similar intensi-ties, when the correct label is placed at nodeX, the resulting transformation has a smooth response (less high frequency components) when compared to other candidate labels.
The higher-order components typically correspond to high frequency image noise. Hence, in our energy potential calculation defined below we consider only the lower 75% of the frequency components after performing a zig-zag scan from the origin.
The energy potential for each label is calculated using
Vc(ωk)=
⎛ ⎝P−1
v=0 P−1 u=0
|Ck(v,u)| ⎞
X
1
3 2
4
(a)
0
5 10 15 20 25 30 35 010 20
30 40 0
500 1000
−500
(b)
0
5 10 15 20 25 30 35 010 20
30 40 0
500 1000
−500
(c)
0
5 10 15 20 25 30 35 010 20
30 40 0
500 1000
−500
(d)
0
5 10 15 20 25 30 35 010 20
30 40 0
500 1000
−500
(e)
Figure5: An example of the processing done in Section3.5. (a) A clique involving empty nodeXwith four candidate labels in its representative set. (b) A clique and a graphical representation of its DCT coefficient matrix where nodeXis initialised with candidate label 1. The gaps between the blocks are for ease of interpretation only and are not present during DCT calculation. (c) As per (b), but using candidate label 2. (d) As per (b), but using candidate label 3. (e) As per (b), but using candidate label 4. The smoother spectral distribution for candidate 3 suggests that it is a better fit than the other candidates.
where P = ceil(√M2×0.75) and ω
k is the local configu-ration involving labelk. Similarly, the potentials over other three cliques in Figure3are calculated.
4. Experiments
In our experiments, the testing was limited to greyscale sequences. The size of each node was set to 16×16. The threshold T1 was empirically set to 0.8 based on prelim-inary experiments, discussed in Section 4.1.3. T2 (found automatically) was found to vary between 1 and 4 when tested on several image sequences (T1andT2are described in Section3.2).
A prototype of the algorithm using Matlab on a 1.6 GHz dual core processor yielded 17 fps. We expect that considerably higher performance can be attained by con-verting the implementation to C++, with the aid of libraries such as OpenCV [28] or Armadillo [29]. To emphasise the effectiveness of our approach, the estimated backgrounds were obtained by labelling all the nodes just once (no subsequent iterations were performed).
We conducted two separate set of experiments to verify the performance of the proposed method. In the first case, we measured the quality of the estimated backgrounds, while in the second case we evaluated the influence of the proposed method on a foreground segmentation algorithm. Details of both the experiments are described in Sections4.1and4.2, respectively.
4.1. Standalone Performance. We compared the proposed algorithm with a median filter-based approach (i.e., applying filter on pixels at each location across all the frames) as well as finding intervals of stable intensity (ISI) method presented in [14]. We used a total of 20 surveillance videos: 7 obtained from CAVIAR dataset (http://groups.inf.ed.ac.uk/vision/CAVIAR/CAVIARDATA1/ ), 3 sequences from the abandoned object dataset used in the CANDELA project (http://www.multitel.be/∼va/candela/), and 10 unscripted sequences obtained from a railway station in Brisbane. The CAVIAR and and CANDELA sequences were chosen based on four criteria: (i) a minimum duration of 700 frames, (ii) containing significant background occlusions, (iii) the true background is available in at least one frame, and (iv) have largely static backgrounds. Having the true background allows for quantitative evaluation of the accuracy of background estimation. The sequences were resized to 320×240 pixels (QVGA resolution) in keeping with the resolution typically used in the literature.
The algorithms were subjected to both qualitative and quantitative evaluations. Sections 4.1.1 and 4.1.2, respec-tively, describe the experiments for both cases. Sensitivity of T1is studied in Section4.1.3.
(a) (b) (c) (d)
Figure6: (a) Example frames from four videos, and the reconstructed background using: (b) median filter, (c) ISI method [14], and (d) proposed method.
Going row by row, the first and second sequences are from a railway station in Brisbane, the third is from the CANDELA dataset and the last is from the CAVIAR dataset. In the first sequence, several commuters wait for a train, slowly moving around the platform. In the second sequence, two people (security guards) are standing on the platform for most of the time. In the third sequence, a person places a bag on the couch, abandons, it and walks away. Later, the bag is picked up by another person. The bag is in the scene for about 80% of the time. In the last sequence, two people converse for most of the time while others slowly walk along the corridor. All four sequences have foreground objects that are either dynamic or quasistationary for most of the time.
It can be observed that the estimated backgrounds obtained from median filtering (second column) and the ISI method (third column) have traces of foreground objects that were stationary for a relatively long time. The results of the proposed method appear in the fourth column and
indicate visual improvements over the other two techniques. It must be noted that stationary objects can appear as background to the proposed algorithm, as indicated in the first row of the fourth column. Here a person is standing at the far end of the platform for the entire sequence.
method is based on region-level processing, we calculated only the AGE and CEPs.
The Brisbane railway station sequences were not used as their true background was unavailable. The remaining 10 image sequences were used as listed in Table 1. To maintain uniformity across sequences, the experiments were conducted using the first 700 frames from each sequence. The background was estimated in three cases. In the first case, all 700 frames (100%) were used to estimate the background. To evaluate the quality when less frames are available (e.g., the background needs to be updated more often), in the second case, the sequences were split into halves of 350 frames (50%) each. Each subsequence was used independently for background estimation and the obtained results were averaged. In the third case each subsequence was further split into halves (i.e., 25% of the total length). Further division of the input resulted in subsequences in which parts of the background were always occluded and hence were not utilised. The averaged AGE and CEP values in all three cases are graphically illustrated in Figure7and tabulated in Tables
1and2. The visual results in Figure6confirm the objective results, with the proposed method producing better quality backgrounds than the median filter approach and the ISI method.
4.1.3. Sensitivity ofT1. To find the optimum value ofT1, we chose a random set of sequences from the CAVIAR dataset, whose true background was available a-priori and computed the averaged AGE between the true and estimated back-grounds for various values ofT1as indicated in Figure8. As shown, the optimum value (minimum error) was obtained atT1=0.8.
4.2. Evaluation by Foreground Segmentation. In order to show that the proposed method aids in better segmentation results, we objectively evaluated the performance of a segmentation algorithm (via background subtraction) on the Wallflower dataset. We note that the proposed method is primarily designed to deal with static backgrounds, while Wallflower contains both static and dynamic backgrounds. As such, Wallflower might not be optimal for evaluating the efficacy of the proposed algorithm in its intended domain; however, it can nevertheless be used to provide some suggestive results as to the performance in various conditions.
For foreground object segmentation estimation, we use a Gaussian-based background subtraction method where each background pixel is modelled using a Gaussian distribution. The parameters of each Gaussian (i.e., the mean and vari-ance) are initialised either directly from a training sequence, or via the proposed MRF-based background estimation method (i.e., using labels yielding the maximum value of the posterior probability described in (11) and their corresponding variances, resp.). The median filter and ISI [14] methods were not used since they do not define how to compute pixel variances of their estimated background.
For measurement of foreground segmentation accuracy, we use the similarity measure adopted by Maddalena and
Petrosino [30], which quantifies how similar the obtained foreground mask is to the ground-truth. The measure is defined as
similarity= tp
tp+f p+ f n, (13)
where similarity ∈ [0, 1], while tp, f p, and f nare total number of true positives, false positives and false negatives (in terms of pixels), respectively. The higher the similarity
value, the better the segmentation result. We note that the
similiaritymeasure is related to precision and recall metrics [31].
The parameter settings were the same as used for measuring the standalone performance (Section 4.1). The relative improvements in similarity resulting from the use of the MRF-based parameter estimation in comparison to direct parameter estimation are listed in Table3.
We note that each of the Wallflower sequences addresses one specific problem, such as dynamic background, sud-den and gradual illumination variations, camouflage, and bootstrapping. As mentioned earlier, the proposed method is primarily designed for static background estimation (bootstrapping). On the “Bootstrap” sequence, characterised by severe background occlusion, we register a significant improvement of over 62%. On the other sequences, the results are only suggestive and need not always yield high
similarityvalues. For example, we note a degradation in the performance on “TimeOfDay” sequence. In this sequence, there is steady increase in the lighting intensity from dark to bright, due to which identical labels were falsely treated as “unique”. As a result, estimated background labels variance appeared to be smaller than the true variance of the background, which in turn resulted in surplus false positives. Overall, MRF-based background initialisation over 6 sequences achieved an average percentage improvement in
similarityvalue of 16.67%.
4.3. Additional Observations. We noticed (via subjective observations) that all background estimation algorithms perform reasonably well when foreground objects are always in motion (i.e., in cases where the background is visible for a longer duration when compared to the foreground). In such circumstances, a median filter is perhaps sufficient to reliably estimate the background. However, accurate estimation by the median filter and the ISI method becomes problematic if the above condition is not satisfied. This is the main area where the proposed algorithm is able to estimate the background with considerably better quality.
1 0 0 5 0 2 5 I n p u t f r a m e s u s e d ( % )
0 0 . 5
1 1 . 5
2 2 . 5
3
M e d i a n fi l t e r I S I m e t h o d P r o p o s e d m e t h o d
A
ver
age
gr
ey
er
ror
(A
GE)
(a)
1 0 0 5 0 2 5
I n p u t f r a m e s u s e d ( % ) 0
M e d i a n fi l t e r I S I m e t h o d P r o p o s e d m e t h o d 5 0 0
1 0 0 0 1 5 0 0 2 0 0 0 2 5 0 0
C l u s t
e r
e d
e r
r o r
p i x
e l s
( C E P )
(b)
Figure7: Averaged values of AGE (a) and CEPs (b) obtained by using 100%, 50% and 25% of the input sequences.
Table1: Averaged grey-level error (AGE) results from experiments on 10 image sequences. The results under case 2 and case 3 (using 50% and 25% of the input sequence, resp.) were obtained by averaging over the two and four subsequences, respectively.
Sequence
case 1: 100% case 2: 50% case 3: 25%
Number of input frames=700 Number of input frames=350 Number of input frames=175 median
filter
ISI method
proposed method
median filter
ISI method
proposed method
median filter
ISI method
proposed method
m1.10 abandoned object.avi 0.88 0.88 0.42 1.45 1.08 0.70 1.27 1.3 1.25
m1.16 abandoned object.avi 2.02 1.69 1.93 2.06 2.03 2.25 2.38 2.36 2.65
m1.15 abandoned object.avi 0.50 0.59 1.03 0.51 0.64 0.79 1.26 1.1 0.87
OneStopEnter1cor.mpg 0.99 0.98 0.85 0.50 0.39 0.59 0.65 0.63 0.73
OneStopEnter2cor.mpg 1.37 1.16 0.82 1.04 0.91 1.06 1.23 1.06 1.13
OneStopNoEnter1cor.mpg 0.90 0.96 0.21 0.56 0.92 0.42 1.65 1.44 0.49
OneStopNoEnter2cor.mpg 1.01 1.62 0.53 2.44 1.67 1.40 2.99 2.15 1.92
OneStopMoveEnter1cor.mpg 3.69 2.15 0.73 6.37 2.45 1.53 7.31 4.02 4.92
OneStopMoveNoEnter2cor.mpg 0.64 0.49 0.81 0.94 1.01 0.79 1.87 1.45 1.19
TwoEnterShop1cor.mpg 2.12 1.86 1.85 3.49 3.21 1.51 4.35 4.66 3.38
Average 1.41 1.24 0.92 1.87 1.61 1.10 2.7 2.37 1.85
From our experiments, we found that the memory footprint to store the state space of all the nodes is on average only 5% of the memory required for storing all the frames. This is in contrast to existing algorithms, which typically require the storage of all the frames before processing can begin.
We conducted additionally experiments on image sequences represented in other colour spaces, such as RGB and YUV, and evaluated the overall posterior as the sum of individual posteriors evaluated on each channel independently. The results were marginally better than those obtained using greyscale input. We conjecture that this is because the spatial continuity of structures within a scene are well represented in greyscale.
5. Main Findings and Future Work
In this paper, we proposed a background estimation algo-rithm in an MRF framework that is able to accurately estimate the static background from cluttered surveillance videos containing image noise as well as foreground objects. The objects may not always be in motion or may occlude the background for much of the time.
Table2: As per Table1, but using clustered error pixels (CEPs) as the error measure.
Sequence
case 1: 100% case 2: 50% case 3: 25%
Number of input frames=700 Number of input frames=350 Number of input frames=175 median
filter
ISI method
proposed method
median filter
ISI method
proposed method
median filter
ISI method
Proposed method m1.10 abandoned object.avi 258.00 208.00 0.00 976.50 423.50 133.50 664.75 673.25 660.75 m1.16 abandoned object.avi 455.00 320.00 322.00 463.00 333.50 467.00 358.25 378 528.75
m1.15 abandoned object.avi 0.00 95.00 86.00 0.00 92.00 38.00 773 521.75 135.25
OneStopEnter1cor.mpg 37.00 7.00 348.00 184.50 13.00 177.00 374.5 172.5 380.50
OneStopEnter2cor.mpg 358.00 85.00 29.00 482.00 230.50 266.00 640 351.25 374.50
OneStopNoEnter1cor.mpg 141.00 104.00 67.00 437.50 466.50 252.50 1224 819 286.25
OneStopNoEnter2cor.mpg 103.00 406.00 35.00 1919.50 854.00 678.00 2282.5 1224.25 1244.00 OneStopMoveEnter1cor.mpg 3931.00 1196.00 714.00 5756.00 2503.00 1289.50 8365.25 4622.25 3877.75 OneStopMoveNoEnter2cor.mpg 257.00 63.00 232.00 574.50 348.50 259.00 1169.25 697.75 654.50 TwoEnterShop1cor.mpg 2487.00 1372.00 1733.00 3534.00 2479.50 1483.00 4468.25 3795.5 3420.25
Average 802.7 385.6 356.6 1432.75 774.4 504.40 2031.98 1325.55 1156.25
0 0 . 1 0 . 2 0 . 3 0 . 4 0 . 5 0 . 6 0 . 7 0 . 8 0 . 9 1 T 1
0 . 8 1 1 . 2 1 . 4 1 . 6 1 . 8
A
ver
age
gr
ey
er
ror
(A
GE)
Figure8: Effect ofT1on AGE, while using a fixed value ofT2.
to sequential processing of frames. This makes the algorithm possibly suitable for implementation on embedded systems, such as smart cameras [1,32].
The performance of the algorithm is invariant to moder-ate illumination changes, as we consider only AC coefficients of the DCT in the computation of the energy potential defined by (12). However, the similarity criteria defined by (3) and (4) create multiple representatives for the same visually identical block. Tackling this problem efficiently is part of further research. We also intend to extend this work to estimate background models of nonstatic backgrounds.
Experiments on real-life surveillance videos indicate that the algorithm obtains considerably better background estimates (both objectively and subjectively) than methods based on median filtering and finding intervals of stable
Table3: Relative percentage improvement in foreground segmen-tationsimilarity(13), obtained on the Wallflower dataset, resulting from the use of the MRF-based parameter estimation in comparison to direct parameter estimation. The similarity value ofmoved object sequence turns out to be zero (due to the absence of true positives in its ground-truth) and is therefore not listed.
Wallflower Relative improvement
Sequence insimilarity(13)
WavingTrees 34%
ForegroundAperture 6%
LightSwitch 1%
Camouflage 20%
Bootstrap 62%
TimeOfDay −23%
Average 16.67%
intensity. Furthermore, segmentation of foreground objects on the Wallflower dataset was also improved when the proposed method was used to initialise the background model based on a single Gaussian. We note that the proposed background estimation algorithm can be combined with almost any foreground segmentation technique, such as [8,
33].
Acknowledgments
References
[1] W. Wolf, B. Ozer, and T. Lv, “Smart cameras as embedded systems,”Computer, vol. 35, no. 9, pp. 48–53, 2002.
[2] R. Collins, A. Lipton, T. Kanade et al., “A system for video surveillance and monitoring,” Tech. Rep. CMU-RI-TR-00-12, Robotics Institute, Pittsburgh, Pa, USA, May 2000.
[3] C. Sanderson and B. C. Lovell, “Multi-region probabilistic histograms for robust and scalable identity inference,” in Proceedings of the 3rd International Conference on Advances in Biometrics (ICB ’09), vol. 5558 ofLecture Notes in Computer Science, pp. 199–208, 2009.
[4] S.-C. S. Cheung and C. Kamath, “Robust techniques for background subtraction in urban traffic video,” in Visual Communications and Image Processing, vol. 5308 ofProceedings of SPIE, pp. 881–892, January 2004.
[5] M. Piccardi, “Background subtraction techniques: a review,” inProceedings of the IEEE International Conference on Systems, Man and Cybernetics (SMC ’04), vol. 4, pp. 3099–3104, October 2004.
[6] M. Heikkil¨a and M. Pietik¨ainen, “A texture-based method for modeling the background and detecting moving objects,” IEEE Transactions on Pattern Analysis and Machine Intelligence, vol. 28, no. 4, pp. 657–662, 2006.
[7] M. Vargas, M. Milla, L. Toral, and F. Barrero, “An enhanced background estimation algorithm for vehicle detection in urban traffic scenes,”IEEE Transactions on Vehicular Technol-ogy, vol. 59, no. 899, pp. 3694–3709, 2010.
[8] T. Matsuyama, T. Wada, H. Habe, and K. Tanahashi, “Back-ground subtraction under varying illumination,”Systems and Computers in Japan, vol. 37, no. 4, pp. 77–88, 2006.
[9] K. Toyama, J. Krumm, B. Brumitt, and B. Meyers, “Wallflower: principles and practice of background maintenance,” in Pro-ceedings of the 7th IEEE International Conference on Computer Vision (ICCV’99), vol. 1, pp. 255–261, September 1999. [10] V. Reddy, C. Sanderson, and B. C. Lovell, “An efficient
and robust sequential algorithm for background estimation in video surveillance,” in Proceedings of the International Conference on Image Processing (ICIP ’09), pp. 1109–1112, Cairo, Egypt, November 2009.
[11] B. Lo and S. Velastin, “Automatic congestion detection system for underground platforms,” inProceedings of the International Symposium on Intelligent Multimedia, Video and Speech Pro-cessing, pp. 158–161, 2001.
[12] W. Long and Y.-H. Yang, “Stationary background generation: an alternative to the difference of two images,” Pattern Recognition, vol. 23, no. 12, pp. 1351–1359, 1990.
[13] A. Bevilacqua, “A novel background initialization method in visual surveillance,” inProceedings of the IAPR Workshop on Machine Vision Applications, pp. 614–617, Nara, Japan, 2002. [14] H. Wang and D. Suter, “A novel robust statistical method
for background initialization and visual surveillance,” in Proceedings of the 7th Asian Conference on Computer Vision (ACCV ’06), vol. 3851 ofLecture Notes in Computer Science, pp. 328–337, 2006.
[15] K. Kim, T. H. Chalidabhongse, D. Harwood, and L. Davis, “Real-time foreground-background segmentation using code-book model,”Real-Time Imaging, vol. 11, no. 3, pp. 172–185, 2005.
[16] C.-C. Chiu, M.-Y. Ku, and L.-W. Liang, “A robust object segmentation system using a probability-based background
extraction algorithm,” IEEE Transactions on Circuits and Systems for Video Technology, vol. 20, no. 4, pp. 518–528, 2010. [17] D. Farin, P. H. N. de With, and W. Effelsberg, “Robust background estimation for complex video sequences,” in Proceedings of the International Conference on Image Processing (ICIP ’03), vol. 1, pp. 145–148, September 2003.
[18] A. Colombari, A. Fusiello, and V. Murino, “Background initialization in cluttered sequences,” inProceedings of the Con-ference on Computer Vision and Pattern Recognition Workshop (CVPRW ’04), pp. 197–202, Washington DC, USA, 2006. [19] D. Gutchess, M. Trajkovi´c, E. Cohen-Solal, D. Lyons, and A. K.
Jain, “A background model initialization algorithm for video surveillance,” inProceedings of the 8th International Conference on Computer Vision (ICCV ’01), vol. 1, pp. 733–740, July 2001. [20] S. Cohen, “Background estimation as a labeling problem,” inProceedings of the 10th IEEE International Conference on Computer Vision (ICCV ’05), vol. 2, pp. 1034–1041, October 2005.
[21] Y. Boykov, O. Veksler, and R. Zabih, “Fast approximate energy minimization via graph cuts,” inProceedings of the 7th IEEE International Conference on Computer Vision (ICCV’99), vol. 1, pp. 377–384, September 1999.
[22] X. Xu and T. S. Huang, “A loopy belief propagation approach for robust background estimation,” inProceedings of the 26th IEEE Conference on Computer Vision and Pattern Recognition (CVPR ’08), pp. 1–7, June 2008.
[23] S. Geman and D. Geman, “Stochastic relaxation, Gibbs distributions, and the Bayesian restoration of images,”IEEE Transactions on Pattern Analysis and Machine Intelligence, vol. 6, no. 6, pp. 721–741, 1984.
[24] J. Besag, “On the statistical analysis of dirty images,”Journal of Royal Statistics Society, vol. 48, pp. 259–302, 1986.
[25] J. Besag, “Spatial interaction and the statistical analysis of lattice systems,”Journal of the Royal Statistical Society. Series B, vol. 32, no. 2, pp. 192–236, 1974.
[26] N. Ahmed, T. Natarajan, and K. Rao, “Discrete cosine transfom,”IEEE Transactions on Computers, vol. 100, no. 23, pp. 90–93, 1974.
[27] W. Wang, J. Yang, and W. Gao, “Modeling background and segmenting moving objects from compressed video,” IEEE Transactions on Circuits and Systems for Video Technology, vol. 18, no. 5, pp. 670–681, 2008.
[28] G. Bradski and A. Kaehler,Learning OpenCV: Computer Vision with the OpenCV Library, O’Reilly Media, 2008.
[29] C. Sanderson, “Armadillo: an open source C++ lin-ear algebra library for fast prototyping and computa-tionally intensive experiments,” Tech. Rep., NICTA, 2010,
http://arma.sourceforge.net/.
[30] L. Maddalena and A. Petrosino, “A self-organizing approach to background subtraction for visual surveillance applications,” IEEE Transactions on Image Processing, vol. 17, no. 7, pp. 1168– 1177, 2008.
[31] J. Davis and M. Goadrich, “The relationship between precision-recall and ROC curves,” inProceedings of the 23rd International Conference on Machine Learning (ICML ’06), pp. 233–240, ACM, June 2006.
(RNSA ’07), pp. 310–318, Melbourne, Australia, September 2007.