• No results found

A reinforcement sensitivity theory explanation of antisocial behaviour

N/A
N/A
Protected

Academic year: 2020

Share "A reinforcement sensitivity theory explanation of antisocial behaviour"

Copied!
35
0
0

Loading.... (view fulltext now)

Full text

Figure

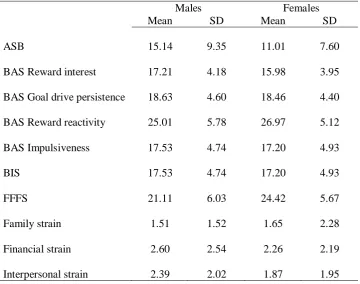
Table 1. Descriptive statistics for males and females in Study 1
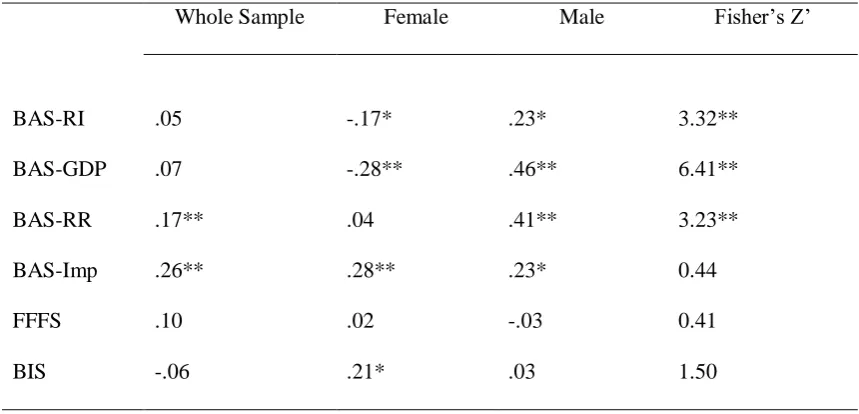
Table 2. Study 1, Pearson’s r correlations, controlling for SES, between Antisocial Behaviour and RST traits for whole sample, and female and male samples, with Fisher’s Z test for sex-difference between correlations
Table 3. Study 1, results of linear regression analysis on ASB for male and female samples and Fisher’s Z comparison of effects across groups
Table 4.Descriptive statistics for males and females in Study 2.
+3

References

Related documents