ORIGINAL ARTICLE
Aboveground biomass estimation
at different scales for subtropical forests
in China
Shunlei Peng
1,2*, Nianpeng He
1,3, Guirui Yu
1,3*and Qiufeng Wang
1,3Abstract
Background: The accurate estimation of forest biomass at different scales is the critical step in the assessment of forest carbon stocks. We used three models at increasing scales: allometric model at ecoregional scale (model 1), dummy variable allometric model at both ecoregion and regional scales (model 2), and allometric model at regional scale (model 3) to estimate the aboveground biomass of six subtropical forests in China. Furthermore, we also tested whether wood density can improve the accuracy of the allometric model at regional scale.
Results: Aboveground biomass estimates for six subtropical forests were significantly affected by the ecoregions (p < 0.05). Model 1 and model 2 had good fitness with higher values of R2, lower RSE (residual standard error) and MPSE (mean percent standard error) than model 3. The values of MPSE for model 1, model 2, and model 3 ranged from 2.79 to 30.40%, 5.15 to 40.94%, and 13.25 to 80.81% at ecoregion scale, respectively. At regional scale, MPSE of model 2 was very similar to that of model 1, and was less than model 3. New allometric models with wood density had greater
R2, lower RSE and MPSE than the traditional allometric models without wood density variable for six subtropical forests at regional scale.
Conclusion: The dummy variable allometric models have better performances to estimate aboveground biomass for six subtropical forests in China, which provided an effective approach to improve the compatibility of forest biomass estimations from different scales. New allometric models with wood density substantially improved accuracies of aboveground biomass estimation for subtropical forests at regional scale.
Keywords: Aboveground biomass, Dummy variable model, Wood density, Scale, Allometric equation
© The Author(s) 2017. This article is distributed under the terms of the Creative Commons Attribution 4.0 International License (http://creativecommons.org/licenses/by/4.0/), which permits unrestricted use, distribution, and reproduction in any medium, provided you give appropriate credit to the original author(s) and the source, provide a link to the Creative Commons license, and indicate if changes were made.
Background
Carbon (C) sequestration and accumulation in forests as aboveground biomass (AGB) is important for mitigat-ing climate change. The estimation of forest biomass at a range of scales has been recognized as one of the most critical steps in the assessment of forest C stocks (Mon-tagu et al. 2005; Tomppo et al. 2010). Tropical and sub-tropical forests have been reported to account for more than 40% of the global gross primary production (GPP) and net primary production (NPP) (Zhou et al. 2006;
Beer et al. 2010; Pan et al. 2011). Long-term eddy covari-ance observations demonstrate that average net ecosys-tem production (NEP) of East Asian subtropical forests is 362 g C m−2 year−1, greater than that of Asian tropical and temperate forests, and also higher than that of forests at the same latitude in North America, Europe and Africa (Yu et al. 2014). Subtropical forest biome in China covers 2.5 × 10⁶ km2, occupies about 25% of the total forest area in China (Wu 1995), and plays critical role in C sink and climate change regulating (Zhou et al. 2006; Tan et al. 2011; Yu et al. 2014). However, C budgets of these forests remain uncertain resulted in limited number of inven-tory plot biomass data and accuracies of allometric equa-tions for estimating AGB of forests in subtropical region (Zhang et al. 2005; Xu et al. 2015; Xiang et al. 2016). Thus,
Open Access
*Correspondence: pengshunlei@163.com; yugr@igsnrr.ac.cn 1 Key Laboratory of Ecosystem Network Observation and Modeling, Institute of Geographic Sciences and Natural Resources Research, CAS, Beijing 100101, People’s Republic of China
developing allometric equations for subtropical forests is essential for accurate estimating C sequestration in sub-tropical region (Zaehle et al. 2006; Hudiburg et al. 2009).
Field inventory methods (e.g., harvest method, allomat-ric modeling, and biomass expansion factor methods) are often used to estimate forest biomass at local and regional scales (Brown et al. 1989; Fang et al. 2001; Wang 2006; Pajtik et al. 2008; Williams et al. 2012). Remote sensing methods can provide spatial information on AGB at large scales, but this method still linked with the rela-tionship between remote sensing dataset and field inven-tory AGB dataset (Drake et al. 2003; Su et al. 2016). Thus, many scientists gave efforts to improve the tree allomet-ric models at single tree, plot, regional, national, or even worldwide scales, using easily measured dimensional variables, such as diameter at breast high (DBH) and tree height (H) (Brown et al. 1989; Ter-Mikaelian and Kor-zukhin 1997; Chave et al. 2005; Návar 2009; Genet et al. 2011). However, different models may lead to greatly variation of biomass estimation because of difference in climatic conditions, site quality, and forest types (Muuk-konen 2007; Fu et al. 2017). Therefore, sampling at differ-ent scales and creating general biomass model were very important to reduce the uncertainty of applying different models (Chave et al. 2014). Some studies have advanced the possibility of generalizing allometric equations across regional boundaries (Návar et al. 2013; Paul et al. 2013; Chave et al. 2014). Zeng et al. (2011) used dummy varia-ble model to develop generalized biomass model of Pinus massoniana at regional scale in south China, and indi-cated dummy model had good performance. However, few study has compared the accuracy of these allomet-ric equations for forest biomass estimations from site to regional scales (Návar et al. 2013). Moreover, allometric models at different scales for other main subtropical for-ests in china, such as evergreen broadleaf forest, decidu-ous broadleaf forest, and mixed forests were very lack (Xu et al. 2015; Xiang et al. 2016). Some studies indicate that wood density variable can greatly improve accura-cies of biomass model for AGB estimates in tropical for-ests and subtropical evergreen broadleaved forest (Baker et al. 2004; Chave et al. 2005, 2014; Goodman et al. 2014; Xu et al. 2015). Chave et al. (2014) successfully devel-oped the universal allometric model for tropical forests with wood density based on global database, which were widely used for AGB estimation in tropical forests. How-ever, the performance of the allometric model with wood density was worth further testing in subtropical forests. Therefore, the development of generalized biomass allo-metric model at different scales was urgent to quantify the regional biomass and C storage of subtropical forests.
Subtropical region in China has varied ecological zones and forest types (Chinese Academy of Sciences 2001).
It was very necessary to develop general biomass mod-els based on ecological region to improve accuracies of AGB estimation. The main objectives of this study were (1) to develop the allometric models at different scales for aboveground biomass estimation of subtropical forests in China; (2) to assessment the accuracy of the allometric models at different scales for AGB estimates, and (3) to test the performance of the allometric model when wood density variable is available.
Materials and methods
The experimental site
The study region covered most of the subtropical regions of China (22°–34°N, 98°–123°E) extending across eight ecoregions (Fig. 1). The total forested area is approxi-mately 2.5 × 10⁶ km2 in China (Wu 1995). The region was classified eight ecological zones (Table 1; Fig. 1) (Fu et al. 2013). The mean annual precipitation (MAP) ranges from 831 to 1342 mm and the mean annual temperature (MAT) varies from 12.5 to 19.1 °C (Table 1). The primary forests in this region were evergreen broadleaf forests (EBF). Due to long-term anthropogenic disturbances, the current forests were not primitive and were classified into six categories: Cunninghamia lanceolata (CL), conif-erous mixed broadleaf forest (CMBF), subtropical decid-uous broadleaf forest (DBF), evergreen broadleaf forest (EBF), Eucalyptus tree species forest (ETS), and Pinus massoniana (PM) based on China’s vegetation classifica-tion system (Chinese Academy of Sciences 2001).
The dataset
The AGB data of the six subtropical forests (CL, CMBF, DBF, EBF, ETS, and PM) was collected from the large forest biomass dataset in China, which was compiled from published biomass studies and pre-existing data-sets published between 1978 and 2008 (Luo et al. 2013).
Moreover, we reviewed almost all related publications in China from 2008 to 2013 and recorded information of sampling plots on locations, forest types, stand age, stand density, DBH, tree height, wood density and AGB for the six subtropical forest types. The biomass components of sample trees (stems, branches, leaves, etc.) was measured using destructive harvesting and oven weighing method. Then, AGB of average tree (kg) for each plot was calcu-lated from stand AGB (Mg ha−1) and stand density. Our criteria for selected sampling tress was that the sample trees for each forest types were distributed as evenly as possible in the diameter classes in our dataset. Together, we collected 972 records of plot measured AGB data for the average trees of six subtropical forest types (Table 1; Additional file 1: Figure S1), 316 records of which had wood density information. The locations and forest types of the dataset were shown in Fig. 1.
Model description
Allometric model at different scales
We used general allometric equations to estimate AGB of six subtropical forests at individual ecoregional scale
(model 1) and all subtropical regional scale (model 3), respectively. These allometric equations based on D2H (D, diameter of the tree at breast height, cm, and H, tree height, m), which have been widely used to estimate AGB for forests (Jenkins et al. 2003; Muukkonen 2007; Návar 2009).
where AGB is the aboveground biomass, a and b are parameters, and ɛ is the additive error. Then, the estimate of aboveground biomass is as follows:
where RSE is the residual standard errors of the regressions.
We considered ecoregion as dummy variable and used dummy variable allometric model to estimate AGB for six subtropical forests at both ecoregion scale and regional scale (model 2). The general form of the dummy vari-able allometric model was as follows (Wang et al. 2008; Zeng et al. 2011).
(1)
ln(AGB)=a+bln(D2H)+ε
(2) AGBest=exp
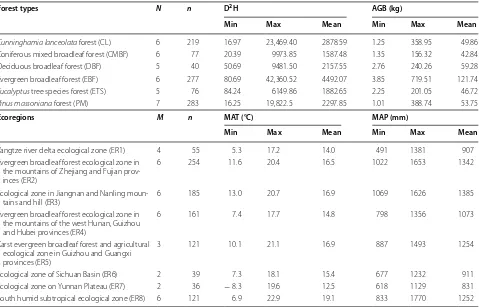
a+RSE22×D2Hb Table 1 Summary characteristics of six forests and eight ecoregions in the subtropical region of China
Abbreviations in the brackets indicated each forest type and individual ecoregion, respectively in the subtropical region of China. Climate data, including mean annual temperature (MAT) and mean annual precipitation (MAP) was obtained from the National Climate Center (http://ncc.cma.gov.cn/cn/)
N number of forest distributed ecoregions, n number of sampling plots, M number of forest types
Forest types N n D2H AGB (kg)
Min Max Mean Min Max Mean
Cunninghamia lanceolata forest (CL) 6 219 16.97 23,469.40 2878.59 1.25 358.95 49.86
Coniferous mixed broadleaf forest (CMBF) 6 77 20.39 9973.85 1587.48 1.35 156.32 42.84
Deciduous broadleaf forest (DBF) 5 40 50.69 9481.50 2157.55 2.76 240.26 59.28
Evergreen broadleaf forest (EBF) 6 277 80.69 42,360.52 4492.07 3.85 719.51 121.74
Eucalyptus tree species forest (ETS) 5 76 84.24 6149.86 1882.65 2.25 201.05 46.72
Pinus massoniana forest (PM) 7 283 16.25 19,822.5 2297.85 1.01 388.74 53.75
Ecoregions M n MAT (°C) MAP (mm)
Min Max Mean Min Max Mean
Yangtze river delta ecological zone (ER1) 4 55 5.3 17.2 14.0 491 1381 907
Evergreen broadleaf forest ecological zone in the mountains of Zhejiang and Fujian prov-inces (ER2)
6 254 11.6 20.4 16.5 1022 1653 1342
Ecological zone in Jiangnan and Nanling
moun-tains and hill (ER3) 6 185 13.0 20.7 16.9 1069 1626 1385
Evergreen broadleaf forest ecological zone in the mountains of the west Hunan, Guizhou and Hubei provinces (ER4)
6 161 7.4 17.7 14.8 798 1356 1073
Karst evergreen broadleaf forest and agricultural ecological zone in Guizhou and Guangxi provinces (ER5)
3 121 10.1 21.1 16.9 887 1493 1254
Ecological zone of Sichuan Basin (ER6) 2 39 7.3 18.1 15.4 677 1232 911
Ecological zone on Yunnan Plateau (ER7) 2 36 − 8.3 19.6 12.5 618 1129 831
where zi is the dummy variable, ai is the ecoregion-specific parameter, and other symbols are the same as Eqs. (1) and (2). The dummy variables are 0, 1. In model 2, we take each ecoregion as dummy variable, if forest has six distributed ecoregions, we used six dummy variables, z1, z2, z3, z4, z5 and z6, when z1 = 1, the others = 0, when z2 = 1, the others = 0, etc. (Zeng et al. 2011).
Testing the importance of wood density for accurate estimated AGB
At regional scale, we used 316 plot AGB data with wood density (WD) records to test whether WD improved accuracy of allometric model. D2H × WD as variable was used to fit allometric model compared with the model without WD variable (Chave et al. 2014; Xu et al. 2015).
then, the estimate of biomass is as follows:
Accuracy assessment of models
The coefficient of determination (R2), residual standard error of the regression (RSE), and mean percent standard error (MPSE) were used to assess the accuracies of the models (Zeng et al. 2011). MPSE were defined as follows:
where n is number of plots; yi and yˆ are the observed and estimated values of AGB respectively.
Results
Allometric models for aboveground biomass estimation at different scales
The values of AGB and D2H varied obviously in each forest type and each ecoregion, especially in DBF, ETS, CMBF and EBF (Table 1; Additional file 1: Figure S1). There was clear distinction of climate (e.g., MAT and MAP) among eight ecoregions (Table 1).
Model 1 had better performance for CL in ER4 (R2 = 0.987) and ER5 (R2 = 0.986), for CMBF in ER4 (R2 = 0.978) and ER6 (R2 = 0.961), for DBF in ER1 (R2 = 0.975) and ER4 (R2 = 0.961), for EBF in ER7
(3) ln(AGB)=a0+
aizi+bln(D2H)+ε
(4)
AGBest=exp
a0+
aizi+RSE2
2×D2Hb
(5)
ln(AGB)=a+bln(D2H×WD)+ε
(6) AGBest=exp
a+RSE22×D2H×WDb
(7)
MPSE= 1
n (yi− ˆy)
ˆ y×100
(R2 = 0.978) and ER4 (R2 = 0.968), for ETS in ER2 (R2 = 0.999) and ER4 (R2 = 0.979), and for PM in ER5 (R2 = 0.986), ER6 (R2 = 0.979), ER3 (R2 = 0.970) and ER2 (R2 = 0.960), and showed lower performance for CMBF in ER2 (R2 = 0.889), and for EBF in ER8 (R2 = 0.885) (Table 2; Additional file 1: Figure S2).
Model 2 considered the effects of the ecoregions on AGB estimation. The statistical results showed ER2 sig-nificantly influenced AGB estimations for CL (p < 0.05), and for PM (p < 0.01), respectively. ER8 significantly affected on AGB estimations for DBF (p < 0.001), EBF (p < 0.001), CMBF (p < 0.05) and ETS (p < 0.05). ER4, ER5, ER3, and ER8 significantly affected on AGB esti-mation for EBF, especially ER4 and ER5 (p < 0.0001) (Table 3; Additional file 1: Figure S3).
Model 2 had better performance to estimate AGB for PM (R2 = 0.964), ETS (R2 = 0.954), and CL (R2 = 0.947), and showed lower performance to estimate AGB for EBF (R2 = 0.915) and CMBF (R2 = 0.920) (Table 3; Additional file 1: Figure S3).
Model 3 showed better performance to estimate AGB for PM (R2 = 0.959) and CL (R2 = 0.944), and had lower performance to estimate AGB for the other four forest types, especially for ETS (R2 = 0.759) (Table 4; Additional file 1: Figure S4).
Assessment the accuracies of the allometric models at different scales
We compared measured AGB and predicted AGB esti-mated from three allometric models at different scales, and found that model 1 and model 2 had better accura-cies for AGB estimations than model 3 (Fig. 2, Table 5). The MPSE values of three models varied obviously for AGB estimations in the same forest in different ecore-gions, and showed increasing trend with increasing scales. At ecoregional scale, the values of MPSE from model 2 were similar to model 1, less than model 3 for CL, PM and DBF in the distributed ecoregions except for CL and PM in ER5, and for DBF in ER3 and ER4. For EBF and ETS, MPSE showed the same trend in the ecore-gions except for EBF in ER1 and ETS in ER2. For all the forests, MPSE of Model 1, model 2, and model 3 ranged from 2.79 to 30.40%, 5.15 to 40.94%, and 13.25 to 80.81% at ecoregional scale, respectively. At regional scale, MPSE
of model 2 was very similar to model 1, and was clearly less than model 3 in six subtropical forests (Table 5).
Testing importance of wood density for Aboveground biomass estimation
higher R2, lower RSE and MPSE than traditional allomet-ric model without WD variable for six forests (Figs. 3, 4). The allometric model with WD variable developed by Chave et al. (2014) showed lower MPSE than traditional model for CL, DBF, EBF and PM, especially in EBF and DBF, and showed greater MPSE for AGB estimations in CL, CMBF, DBF, ETS and PM than allometric model with WD variable from our dataset (Fig. 4). In EBF, model cre-ated by Chave et al. (2014) showed similar lower MPSE to our model with WD variable (Fig. 4).
Discussion
Allometric models for aboveground biomass estimation at different scales
Many scientists gave efforts to improve the tree allomet-ric models at single tree, plot, regional, national, or even worldwide scales (Brown et al. 1989; Chave et al. 2005; Návar 2009; Genet et al. 2011). In this study, we devel-oped three allometric models from ecoregion to regional scales. Three allometric models using D2H as the pre-dictive variable offered good fitness of AGB allometric Table 2 Parameters of allometric models for estimating aboveground biomass of six forests at individual ecoregion scale in the subtropical region of China
*** Indicates significant at p < 0.001 level; ** indicates significant at p < 0.01 level, * indicates significant at p < 0.05 level. See Table 1 for the abbreviations of the forest types and ecoregions
Forests Ecoregions Allometric models at individual ecoregion scale (model 1) n R2 RSE F value
CL ER1 exp(− 3.006 + 0.008) × (D2H)0.857 14 0.918 0.123 134.9***
ER2 exp(− 2.065 + 0.029) × (D2H)0.762 92 0.946 0.241 1574.6***
ER3 exp(− 1.431 + 0.034) × (D2H)0.669 57 0.925 0.260 679.1***
ER4 exp(− 1.659 + 0.009) × (D2H)0.688 18 0.987 0.138 1203.8***
ER5 exp(− 3.611 + 0.017) × (D2H)0.936 12 0.986 0.184 690.6***
ER8 exp(− 2.067 + 0.033) × (D2H)0.749 26 0.954 0.256 499.8***
CMBF ER1 exp(− 4.280 + 0.011) × (D2H)1.169 7 0.955 0.148 104.8***
ER2 exp(− 1.746 + 0.057) × (D2H)0.744 34 0.889 0.338 255.6***
ER3 exp(− 0.527 +0.044) × (D2H)0.552 7 0.912 0.295 51.5***
ER4 exp(− 0.615 + 0.001) × (D2H)0.590 7 0.978 0.053 222.3***
ER6 exp(− 1.953 + 0.043) × (D2H)0.777 14 0.961 0.294 293.6***
ER8 exp(− 1.391 + 0.048) × (D2H)0.72 8 0.932 0.102 82.2***
DBF ER1 exp(− 2.054 + 0.019) × (D2H)0.803 11 0.975 0.195 305.3***
ER2 exp(− 2.202 + 0.036) × (D2H)0.774 11 0.955 0.270 191.6***
ER3 exp(− 14.935 + 0.106) × (D2H)2.623 5 0.904 0.460 28.2*
ER4 exp(− 4.803 + 0.020) × (D2H)1.120 7 0.961 0.198 122.9***
ER8 exp(− 0.841 + 0.034) × (D2H)0.722 6 0.908 0.262 39.3**
EBF ER2 exp(− 2.909 + 0.054) × (D2H)0.920 55 0.932 0.328 729.7***
ER3 exp(− 0.482 + 0.022) × (D2H)0.592 29 0.901 0.209 245.2***
ER4 exp(− 1.699 + 0.011) × (D2H)0.820 48 0.968 0.149 1372.4***
ER5 exp(− 0.610 + 0.023) × (D2H)0.656 89 0.913 0.216 909.0***
ER7 exp(− 2.067 + 0.004) × (D2H)0.817 28 0.978 0.086 1168.7***
ER8 exp(− 2.761 + 0.068) × (D2H)0.911 28 0.885 0.368 200.8***
ETS ER2 exp(− 1.305 + 0.000) × (D2H)0.687 9 0.999 0.017 5074.8***
ER3 exp(− 5.646 + 0.029) × (D2H)1.245 12 0.900 0.240 90.0***
ER4 exp(− 3.615 + 0.001) × (D2H)0.859 6 0.979 0.044 184.0***
ER7 exp(− 1.352 + 0.021) × (D2H)0.631 8 0.924 0.204 73.3***
ER8 exp(− 3.062 + 0.026) × (D2H)0.905 41 0.904 0.230 368.8***
PM ER1 exp(− 2.515 + 0.020) × (D2H)0.843 23 0.948 0.201 379.7***
ER2 exp(− 2.071 + 0.040) × (D2H)0.804 53 0.960 0.283 1214.7***
ER3 exp(− 2.176 + 0.036) × (D2H)0.798 75 0.970 0.217 2374.4***
ER4 exp(− 2.589 + 0.037) × (D2H)0.839 75 0.942 0.271 1181.8***
ER5 exp(− 3.448 + 0.011) × (D2H)0.973 20 0.986 0.146 1301.2***
ER6 exp(− 2.366 + 0.018) × (D2H)0.831 25 0.979 0.187 1058.0***
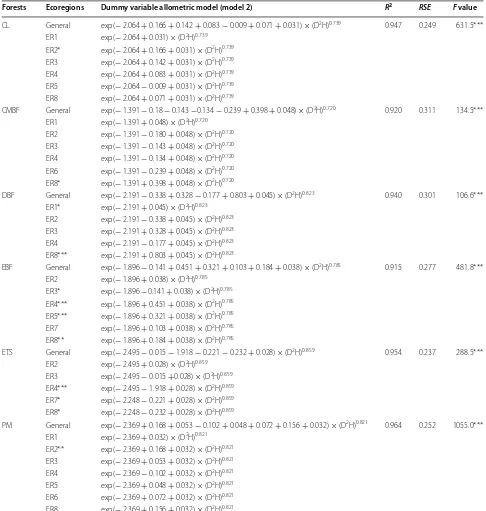
Table 3 Parameters of dummy variable allometric model for estimating aboveground biomass of six forest types at both regional scale and ecoregion scale in the subtropical region of China
*** Indicates significant at p < 0.001 level; ** indicates significant at p < 0.01 level; * indicates significant at p < 0.05 level. See Table 1 for the abbreviations of the forest types and ecoregions
Forests Ecoregions Dummy variable allometric model (model 2) R2 RSE F value
CL General exp(− 2.064 + 0.166 + 0.142 + 0.083 − 0.009 + 0.071 + 0.031) × (D2H)0.739 0.947 0.249 631.5*** ER1 exp(− 2.064 + 0.031) × (D2H)0.739
ER2* exp(− 2.064 + 0.166 + 0.031) × (D2H)0.739 ER3 exp(− 2.064 + 0.142 + 0.031) × (D2H)0.739 ER4 exp(− 2.064 + 0.083 + 0.031) × (D2H)0.739 ER5 exp(− 2.064 − 0.009 + 0.031) × (D2H)0.739 ER8 exp(− 2.064 + 0.071 + 0.031) × (D2H)0.739
CMBF General exp(− 1.391 − 0.18 − 0.143 −0.134 − 0.239 + 0.398 + 0.048) × (D2H)0.720 0.920 0.311 134.5*** ER1 exp(− 1.391 + 0.048) × (D2H)0.720
ER2 exp(− 1.391 − 0.180 + 0.048) × (D2H)0.720 ER3 exp(− 1.391 − 0.143 + 0.048) × (D2H)0.720 ER4 exp(− 1.391 − 0.134 + 0.048) × (D2H)0.720 ER6 exp(− 1.391 − 0.239 + 0.048) × (D2H)0.720 ER8* exp(− 1.391 + 0.398 + 0.048) × (D2H)0.720
DBF General exp(− 2.191 − 0.338 + 0.328 − 0.177 + 0.803 + 0.045) × (D2H)0.823 0.940 0.301 106.6*** ER1* exp(− 2.191 + 0.045) × (D2H)0.823
ER2 exp(− 2.191 − 0.338 + 0.045) × (D2H)0.823 ER3 exp(− 2.191 + 0.328 + 0.045) × (D2H)0.823 ER4 exp(− 2.191 − 0.177 + 0.045) × (D2H)0.823 ER8*** exp(− 2.191 + 0.803 + 0.045) × (D2H)0.823
EBF General exp(− 1.896 − 0.141 + 0.451 + 0.321 + 0.103 + 0.184 + 0.038) × (D2H)0.785 0.915 0.277 481.8*** ER2 exp(− 1.896 + 0.038) × (D2H)0.785
ER3* exp(− 1.896 −0.141 + 0.038) × (D2H)0.785 ER4*** exp(− 1.896 + 0.451 + 0.038) × (D2H)0.785 ER5*** exp(− 1.896 + 0.321 + 0.038) × (D2H)0.785 ER7 exp(− 1.896 + 0.103 + 0.038) × (D2H)0.785 ER8** exp(− 1.896 + 0.184 + 0.038) × (D2H)0.785
ETS General exp(− 2.495 − 0.015 − 1.918 − 0.221 − 0.232 + 0.028) × (D2H)0.859 0.954 0.237 288.5*** ER2 exp(− 2.495 + 0.028) × (D2H)0.859
ER3 exp(− 2.495 − 0.015 +0.028) × (D2H)0.859 ER4*** exp(− 2.495 − 1.918 + 0.028) × (D2H)0.859 ER7* exp(− 2.248 − 0.221 + 0.028) × (D2H)0.859 ER8* exp(− 2.248 − 0.232 + 0.028) × (D2H)0.859
PM General exp(− 2.369 + 0.168 + 0.053 − 0.102 + 0.048 + 0.072 + 0.156 + 0.032) × (D2H)0.821 0.964 0.252 1055.0*** ER1 exp(− 2.369 + 0.032) × (D2H)0.821
models at different scales (R2 ranged from 0.759 to 0.999) (Tables 2, 3, 4). This indicates D2H as variable could improve accuracy of models (Muukkonen 2007; Návar 2009; Xu et al. 2015). Muukkonen (2007) found that allo-metric equations with only DBH as an independent vari-able provided lower overall estimations of tree biomass. Models at different scales may lead to variation of bio-mass estimation because of difference of climatic con-ditions, site quality, and forest structures (Muukkonen 2007; Fu et al. 2017). In this study, we found that model 1 and model 2 had better accuracies for AGB estimations than model 3 (Fig. 2; Table 3). The MPSE values of three
models varied obviously for AGB estimations in the same forest in different ecoregions, and showed increasing trend with increasing scales. Case and Hall (2008) found that prediction error of generalized tree biomass equa-tions for ten species in the boreal forest region of west-central Canada increased from regional to national scale. However, MPSE of model 2 was very similar to model 1, and obviously less than model 3 in six forests (Table 5), which indicated that dummy variable allometric model considered ecoregion factors could be proposed as gen-eral model to estimate AGB for subtropical forests, and provide a more effective new approach to improve the Table 4 Parameters of allometric models for estimating aboveground biomass of six forests at regional ecoregion scale in the subtropical region of China
*** Indicates significant at p < 0.001 level. See Table 1 for the abbreviations of the forest types
Forests Allometric model at regional scale (model 3) n R2 RSE F value
CL exp(− 1.920 + 0.032) × (D2H)0.736 219 0.944 0.252 3668.5***
CMBF exp(− 1.485 + 0.062) × (D2H)0.718 77 0.890 0.353 607.4***
DBF exp(− 1.536 + 0.110) × (D2H)0.733 40 0.839 0.466 198.3***
EBF exp(− 1.481 + 0.056) × (D2H)0.757 277 0.874 0.334 1905.5***
ETS exp(− 3.776 + 0.138) × (D2H)0.995 76 0.759 0.526 233.4***
PM exp(− 2.394 + 0.036) × (D2H)0.830 283 0.959 0.267 6547.2***
compatibility of forest biomass estimates at the ecore-gional, and regional scales.
Assessment the accuracies of the allometric models at different scales
Regional climate data affected the precision of the regional model (Drake et al. 2003; Dewalt and Chave 2004; Chave et al. 2005; Wang 2006; Fu et al. 2017). In this study, MAT and MAP were clearly distinct among eight ecoregions (Table 1). Ecoregions including ER2, ER3, ER4, ER5, and ER8 significantly affected AGB estimations (Table 3). The aboveground biomass of PM, CL, and ETS was greater in the southern central regions with higher temperature and greater rainfall, than in the west regions with lower temperatures and less rainfall. The influences of climate were even more significant in EBF (Table 3). Therefore, forest regional climate data should be considered when the regional models were employed (Muukkonen 2007; Fu et al. 2017).
The number of plots applied to develop the allometric equations in ETS, DBF, and CBMF forest types (N < 100) may not be enough to represent the full range of spe-cies present at the study areas (Table 1). Návar (2009) reported that several hundred sampling plots were
needed for fitting regional allometric equations. Moreo-ver, three model at different scales that have been devel-oped were more robust when there were not enough trees with diameters between 25 and 40 cm (Additional file 1: Figure S1), and the majority of samples had insufficient trees with a diameter of more than 25 cm, which would lead larger estimated error of AGB (Wang 2006; Zaehle et al. 2006; Hudiburg et al. 2009; Xiang et al. 2016).
Testing importance of wood density for aboveground biomass estimation
Wood density strongly varies among different geo-graphical regions, climate gradients, and correlated to forest structure, tree architecture (Baker et al. 2004; Chave et al. 2005, 2014). Thus, wood density can improve the performance of allometric model. In this study, we compared the performance of the allomet-ric model with wood density variable with traditional model without wood density variable at regional scale, and the model created by Chave et al. (2014), and found the model with wood density variable had bet-ter performance than other two models (Figs. 3, 4). It indicated that taking wood density as variables in the allometric model could greatly improve accuracy of biomass model (Chave et al. 2014; Xu et al. 2015). The Table 5 MPSE for three allometric models at different scales developed in the subtropical region of China
See Table 1 for the abbreviations of six forests and eight ecoregions
Forests Models MPSE (%)
ER1 ER2 ER3 ER4 ER5 ER6 ER7 ER8 Region
CL Model 1 9.51 19.38 20.26 10.06 11.72 20.41 17.92
Model 2 10.83 19.27 21.49 11.71 29.08 21.07 19.44
Model 3 26.04 21.66 23.99 21.99 27.36 24.02 23.01
CMBF Model 1 9.66 26.40 17.89 3.64 22.08 7.75 19.31
Model 2 20.97 26.16 30.69 7.45 25.55 23.19 23.98
Model 3 20.68 28.28 28.79 13.25 31.29 53.38 29.42
DBF Model 1 12.95 21.70 14.00 12.89 14.61 15.73
Model 2 12.53 23.90 40.94 25.35 17.67 22.22
Model 3 18.46 37.84 60.54 29.13 72.78 39.07
EBF Model 1 25.24 13.26 9.82 16.41 5.61 30.40 17.02
Model 2 30.74 17.25 9.87 18.32 5.29 30.65 19.14
Model 3 32.27 29.85 24.61 21.70 11.01 31.03 25.02
ETS Model 1 0.97 18.77 2.79 16.48 17.65 14.38
Model 2 8.20 26.37 5.15 20.46 17.54 16.96
Model 3 29.45 23.77 80.81 39.21 20.15 28.28
PM Model 1 14.45 18.94 15.85 20.86 11.92 15.32 27.19 17.80
Model 2 14.63 19.73 16.05 20.75 19.16 15.39 28.35 18.55
reason was that wood density could reflect site climate, forest structure, and trees architecture, and reduce the effects of site climate and forest structure on AGB estimations. The model created by Chave et al. (2014) showed better performance for AGB estimation of EBF, similar to our model with wood density variable. This result suggests that the model created by Chave et al. (2014) can be used AGB estimation of EBF in subtropi-cal region of China.
Conclusions
This study showed that ecoregions significantly affected AGB estimation for six subtropical forests in China. Dummy variable allometric model considered ecoregion
were more accurate than the traditional models without wood density in AGB estimations for subtropical forests at regional scales.
Authors’ contributions
All authors contributed substantially to the work reported here. The four authors participated in the design of the study. SP and NH analyzed the data and wrote the manuscript. GY wrote and reviewed the manuscript. QW
Additional file
Additional file 1: Figure S1. Observed AGB (aboveground biomass) plotted with D2H (D, diameter at tree breast height, H, tree height) of six forests distributed in eight ecoregions of subtropical region in China. Figure S2. Fitted curves for six forests applied allometric model at each ecoregion scale (model 1) in the subtropical region of China. Figure S3. Fitted curves for six forests applied dummy variable allometric model at both regional scale and ecoregion scale (model 2) in the subtropical region of China. Figure S4. Fitted curves for six subtropical forests applied allometric model at regional scale (model 3) in China.
performed the data collection and reviewed the manuscript. All authors read and approved the final manuscript.
Author details
1 Key Laboratory of Ecosystem Network Observation and Modeling, Institute of Geographic Sciences and Natural Resources Research, CAS, Beijing 100101, People’s Republic of China. 2 Key Laboratory of Ecological Restoration in the Hilly Area, Pingdingshan University, Pingdingshan 467000, Henan, People’s Republic of China. 3 College of Resources and Environment, University of Chi-nese Academy of Sciences, Beijing 100049, People’s Republic of China.
Acknowledgements
We thank Professor Zeng Weisheng for the assistance with information on the dummy variable model, and thank Professor Martin Kent (Plymouth University, UK) for the improvement of English usage. We also greatly thank two anony-mous reviewers for their insightful comments.
Competing interests
The authors declare that they have no competing interests.
Availability of data and materials Please see Table 1.
Consent for publication
Authors agree to the terms of the Springer Open Copyright and License Agreement.
Ethics approval and consent to participate
Not applicable, the study involves no human parparticipants.
Funding
This study is partially supported by the National Natural Science Foundation of China (No. 31770655, 31570471, 31290221).
Publisher’s Note
Springer Nature remains neutral with regard to jurisdictional claims in pub-lished maps and institutional affiliations.
Received: 3 September 2016 Accepted: 26 October 2017
References
Baker TR, Phillips OL, Malhi Y et al (2004) Variation in wood density deter-mines spatial patterns in Amazonian forest biomass. Glob Change Biol 10:545–562
Beer C, Reichstein M, Tomelleri E et al (2010) Terrestrial gross carbon dioxide uptake: global distribution and covariation with climate. Science 329:834–838
Brown S, Gillespie AJ, Lugo AE (1989) Biomass estimation methods for tropical forests with applications to forest inventory data. For Sci 35:881–902 Case B, Hall RJ (2008) Assessing prediction errors of generalized tree biomass
and volume equations for the boreal forest region of west-central Canada. Canada J For Res 38:878–889
Chave J, Andalo C, Brown S et al (2005) Tree allometry and improved estimation of carbon stocks and balance in tropical forests. Oecologia 145:87–99
Chave J, Rejou-Mechain M, Burquez A et al (2014) Improved allometric models to estimate the aboveground biomass of tropical trees. Glob Change Biol 20:3177–3190
Chinese Academy of Sciences (2001) Vegetation of China and geographic pattern-illustrition for vegetation map of the People’s Republic of China (1:1000000). Geological Publishing House, Beijing
Dewalt SJ, Chave J (2004) Structure and biomass of four lowland neotropical forests. Biotropica 36:7–19
Drake JB, Knox RG, Dubayah RO et al (2003) Above-ground biomass estima-tion in closed canopy Neotropical forest using lidar remote sensing: Fig. 4 Compared the measured AGB (aboveground tree biomass)
and the estimated AGB in subtropical forests by the allometric model with wood density, the allometric model without wood density, and the model widely used in tropical trees created by Chave et al. (2014)
AGBest = 0.0673 ×
ρD2H0.976
, respectively (a), and compared
factors affecting the generality of relationships. Glob Ecol Biogeogr 12:147–159
Fang JY, Chen AP, Peng CH et al (2001) Changes in forest biomass carbon stor-age in China between 1949 and 1998. Science 292:2320–2322 Fu BJ, Liu GH, Ouyang ZY et al (2013) Study on ecological regionalization in
China. Science Press, Beijing
Fu LY, Lei XD, Hu HD et al (2017) Integrating regional climate change into allometric equations for estimating tree aboveground biomass of Masson pine in China. Ann For Sci 74:42–57
Genet A, Wernsdörfer H, Jonard M et al (2011) Ontogeny partly explains the apparent heterogeneity of published biomass equations for Fagus sylvatica in central Europe. For Eco Manag 261:1188–1202
Goodman RC, Phillips OL, Baker TR (2014) The importance of crown dimen-sions to improve tropical tree biomass estimates. Ecol Appl 24:680–698 Hudiburg T, Law B, Turner DP et al (2009) Carbon dynamics of Oregon and
Northern California forests and potential land-based carbon storage. Ecol Appl 19:163–180
Jenkins JC, Chojnacky DC, Heath LS et al (2003) National- scale biomass esti-mators for United States tree species. For Sci 49:12–35
Luo YJ, Wang XK, Zhang XQ et al (2013) Biomass and its allocation of forest ecosystem in China. Chinese Forestry Press, Beijing
Montagu KD, Duttmer K, Barton CVM et al (2005) Developing general allo-metric relationship for regional estimates of carbon sequestration-an example using Eucalyptus pilularis from seven contrasting sites. For Ecol Manag 204:113–127
Muukkonen P (2007) Generalized allometric volume and biomass equations for some tree species in Europe. Eur J For Res 126:157–166
Návar J (2009) Allometric equations for tree species and carbon stocks for forests of northwestern Mexico. For Ecol Manag 257:427–434 Návar J, Ríos-Saucedo J, Pérez-Verdín G et al (2013) Regional aboveground
biomass equations for North American arid and semi-arid forests. J Arid Environ 97:127–135
Pajtik J, Konopka B, Lukac M (2008) Biomass functions and expansion factors in young Norway spruce (Picea abies) trees. For Ecol Manag 256:1096–1103 Pan YD, Birdsey RA, Fang JY et al (2011) A large and persistent carbon sink in
the world’s forests. Science 333:988–993
Paul KI, Roxburgh SH, Jacquel RE et al (2013) Development and testing of allo-metric equations for estimating above-ground biomass of mixed-species environmental plantings. For Ecol Manag 10:483–494
Su YJ, Guo QH, Xue BL et al (2016) Spatial distribution of forest aboveground biomass in China: estimation through combination of spaceborne lidar, optical imagery, and forest inventory data. Remote Sens Environ 173:187–199
Tan ZH, Zhang YP, Douglas S et al (2011) An old-growth subtropical Asian evergreen forest as a large carbon sink. Atmos Environ 45:1548–1554 Ter-Mikaelian MT, Korzukhin MD (1997) Biomass equations for sixty-five North
American tree species. For Ecol Manag 97:1–24
Tomppo E, Gschwantner T, Lawrence M et al (2010) National forest inventories: pathways for common reporting. Springer Press, New York
Wang CK (2006) Biomass allometric equations for 10 co-occurring tree species in Chinese temperate forests. For Ecol Manag 222:9–16
Wang ML, Bruce EB, Zhao DH (2008) An empirical comparison of two subject-specific approaches to dominant heights modeling: the dummy variable method and the mixed model method. For Ecol Manag 255:2659–2669 Williams RJ, Zerihum A, Montagu KD et al (2012) Allometry for estimating
aboveground tree biomass in tropical and subtropical eucalypt wood-lands: towards general predictive equations. Aust J Bot 53:607–619 Wu ZY (1995) Vegetation of China. Science Press, Beijing
Xiang WH, Zhou J, Ouyang S et al (2016) Species-specific and general allo-metric equations for estimating tree biomass components of subtropical forests in southern China. Eur J For Res 135:1–17
Xu YZ, Zhang JX, Franklin SB et al (2015) Improving allometry models to esti-mate the above and belowground biomass of subtropical forest, China. Ecosphere 6:1–15
Yu GR, Chen Z, Piao SL et al (2014) High carbon dioxide uptake by subtropical forest ecosystems in the East Asian monsoon region. Pro Natl Acad Sci 111:4910–4915
Zaehle S, Sitch S, Prentice C et al (2006) The importance of age-related decline in forest NPP for modeling regional carbon balances. Ecol Appl 16:1555–1574
Zeng WS, Zhang HR, Tang SZ (2011) Using the dummy variable model approach to construct compatible single-tree biomass equations at different scales- a case study for Masson pine (Pinus massoniana) in southern China. Can J For Res 41:1547–1554
Zhang L, Huang Y, Luo TX et al (2005) Age effects on stand biomass allocation to different components: a case study in forests of Cunninghamia lanceo-lata and Pinus massoniana. J Grad Sch Chin Acad Sci 22:170–178 Zhou GY, Liu SG, Li ZA et al (2006) Old-growth forests can accumulate carbon