Environmental Change Analysis in Nias Island
Using Remote Sensing Technique
1
Togi Tampubolon,
2Rita Juliani,
3Evan Alvin Harefa
1,2,3Dept. of Physics, State University of Medan, Indonesia
Abstract
This research was aimed at identifying the environmetal change by using Landsat 5 TM satellite imagery and Landsat 8 OLI with NDVI and LST parameters in Nias island. It was conducted by using overlay method by utilizing the ArcGIS 10.0 software and ENVI 4.7, at the administrative boundary map in the local area which is supported by 40 control points (GCP) of direct observation in the research area. The results showed a decrease in the normalized difference vegetation index (NDVI) and the increase in the average of land surface temperature (LST), so that it can be concluded that there was environmental changes in Nias Island
Keywords
Perubahan Lingkungan, Landsat 5TM, Landsat 8 OLI, NDVI, LST, Korelasi
I. Introduction
North Sumatra has a total area of 181,860.65 km ² which consists of the land area of 71680.68 km ² or 3.73% from the total area of the Republic of Indonesia. One of the areas in North Sumatra is Nias island (Bappenas, 2013). Nias is an island which locates on west of Sumatra island, which has a range of ± 85 km of Central Tapanuli district (BPS Nias, 2014). Nias Island is a developing area. Developing area is identical with rapid population growth. The population growth, regional division and disasters has resulted
significant effects on the environment. These changes are needed to be identified and mapped to reduce the sustainable impact, if it
is not done, it can cause environmental degradation, environmental
damage, depletion of natural resources, floods and landslides. It
will occur continously (BPS Nias, 2014). Environmental changes
can be identified by utilizing the latest and up to date information
technology in the form of geographic information systems (GIS) and remote sensing (sensing). Remote sensing is done without contact with the object directly. (Sukojo, 2003; ESRI, 2001; GIS; 2007; Howard, 1996; Lillesand, 1979). Data which is used in SIG and remote sensing is spatial data (which is represented in the form of digital format map), it is satellite imagery (Novianti, 2012; Opa; 2010). Accurate and up to date data provides spatial information about environmental change which is needed in to formulate a comprehensive and proportional treatment strategy,
and also facilitate the identification by mapping the changes that
occur. (Center for the Educators Development and Empowerment, 2013). Remote sensing techniques previously utilized by Zhang (2015), it is about the contribution of soil moisture on reducing the impact of rising land surface temperature using the data of Landsat 8 in China especially in urban areas, Wu (2014) is about on GDVI to characterize dry land which produces correlation between
the density of vegetation and leaf area index, Atrifiana (2013) is
about analysis of vegetation change in Semarang using the aids
of remote sensing technology which has resulted five classes of
vegetation density in Semarang that its cover become narrower
from year to year, Fariz (2014) concerns about the identification
of land cover using satellite images SPOT 4. This research results
a type of land use in the Indragiri Hulu district, Riau province such as, forest, industrial plants, bushes, plantation, open land, undeveloped land and water, Rakhmawati Research (2012) is about the use of Landsat imagery to estimate biomass on the surface of various land cover with Vegetation Index approach in the North Mamuju district, West Sulawesi. It produces 12 types of land cover which is dominated by forests, plantations and mixed farms and also the index of vegetation density that had highest correlation with the biomass, and Adnindya (2013) is about the use of Landsat 7 ETM to analyze forest humidity based on drought index values in Banyuwangi which produces sparse, medium and
dense vegetation classification,. These studies have indirect effects
on the environment.
Based on the explanation above, researchers interested in conducting
research on the identification of environmental changes in terms of
the parameters NDVI (Normalized Difference Vegetation Index) and LST (Land Surface Temperature) by utilizing satellite imagery using Geographic Information System (GIS) and remote sensing (Remote Sensing) with the title: Utilization of Satellite Imagery to Identify Environmental Change with NDVI and LST parameters in Nias Island. Environmental changes are indicated by a color change on the map, the rising value of LST and NDVI values decrease.
II. Research Methodology
A. Time and Location
It was conducted on Nias Island, North Sumatra province, at
coordinates 0ᵒ12 ‘- 1ᵒ32’ North Latitude (LU) and 97ᵒ - 98ᵒ east longitude (BT) 0ᵒ12 ‘- 1ᵒ32’ North Latitude (LU) and 97ᵒ - 98ᵒ East Longitude ( BT). The research was carried out in
January-March 2016
B. Tools and Materials
1. Tools
GPS (Global Position System), a computer with ArcGIS 10.0
software, ENVI 4.7, DNS Garmin, Microsoft Office 2013, digital
cameras, thermometers.
2. Materials
The materials used are spatial data, they are satellite imagery in 2003, 2006, 2009, 2012, and 2015 and attribute data that is a North Sumatera appearance map, and Nias Island administrative map (shp).
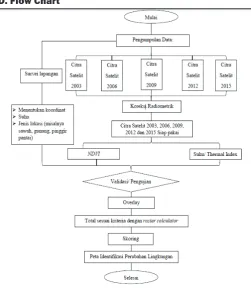
C. Data Analysis
Making Radiometric corrections using ENVI Software 1.
Conducting data analysis using ArcGIS 10 2.
Performing NDVI and LST correlation analysis 3.
Fig. 1: Research Process Flow Diagram
III. Result and Disccusion
The results of the field survey are temperature, greenness observations, and sample points coordinates. While the data obtained from satellites are the value of infrared wave (band 4), a red wave (band 3) on Landsat 5 TM, infrared wave (band 5) and red wave (band 4) on Landsat 8 OLI. The data is processed to obtain NDVI values. The Values of band 6 is at Landsat 5 TM and value of the band 10 is at Landsat 8 OLI, the data is then
processed by the formula Lλ to get the value of land surface
temperature (LST). Data processing results are then presented in the form of graphs and maps.
A. Results
(a)
(b)
Fig. 2: Comparison between the temperatures obtained from field
surveys and temperature obtained from satellite data and their correlation.
1. NDVI
Fig. 3: NDVI map of Nias Island on 2003
Fig. 5: NDVI Map of Nias Island on 2009
Fig. 6: NDVI Map of Nias Island on 2012
Fig. 7: NDVI Map of Nias Island on 2015
Based on 5 maps of the mapping results and NDVI classification
above, there are changing areas of dwindled vegetation density.
It can be seen from the classification of greenery. In 2003, the
vegetation is very high on Nias island, reaching 29431.71 hectares, but in 2015 only 329.94 hectares. From the graph 8 on Nias NDVI values, there is a decline over a period of 12 years, starting from 2003 to 2015. The drastic decline occurred from 2009 to 2012 that is from 0.23 to 0.13.
Fig. 8: Changing Graphic of NDVI in Nias Island
2. LST
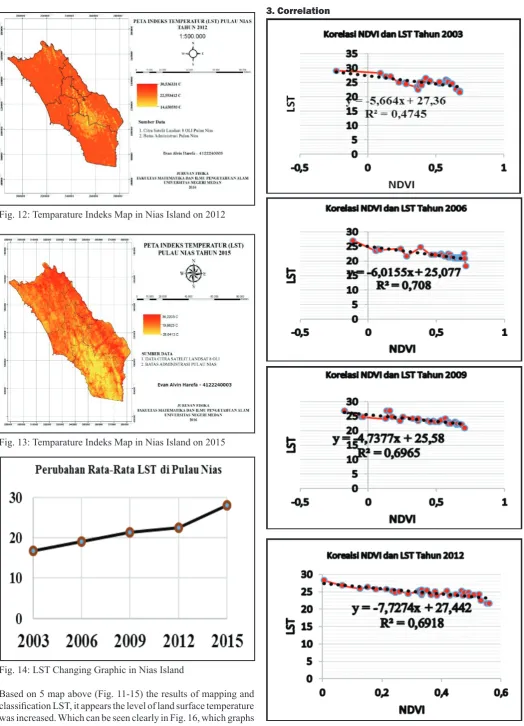
Fig. 9: Temparature Indeks Map in Nias Island on 2003
Fig. 10: Temparature Indeks Map in Nias Island on 2006
Fig. 12: Temparature Indeks Map in Nias Island on 2012
Fig. 13: Temparature Indeks Map in Nias Island on 2015
Fig. 14: LST Changing Graphic in Nias Island
Based on 5 map above (Fig. 11-15) the results of mapping and classification LST, it appears the level of land surface temperature
Fig. 15: (a,b,c,d,e) Correlation Graphic of NDVI dan LST from Sample Point
B. Discussion
Based on Fig. 3,4,5,6,7, there are color of vegetation density
changes from 2003 to 2015. Based on fig. 9,10,11,12, 13, there
are discoloration of the soil surface temperature.
Environmental changes can be determined by several parameters including the density of vegetation (NDVI) and land surface temperature (LST). The calculation of each parameter NDVI and LST using a digital number (DN) in bits, one of the example is TI. To calculate it, Landsat 8 with a width of 16 bits equal to 65536 and for Band DN 10 DN value equal to 32716 is used. The results of DN in Nias Island is used for temperature value calculation using ENVI 4.7 software which is 27.51 °C digitally and 25 50 ° C manually exactly in Dahana forest on 2015. The calculation results of temperature on the satellite image on 2003
with the temperature of the data 16,84˚C have in common with an average temperature of BMKG (Nias in figures, 2003) that is 16,9˚C. This proves that the digital calculation results can be
trusted. Dwindled rainfall from 2009 to 2011 based on data from
tahun 1982-2011 BMKG (Information Climate Change and Air
Condition in Indonesia, 2013) affects the increasing of soil surface temperature.
The results shows that there are changes in the vegetation index in
Nias Island which were classified from lowest to highest level. It
changes continously from 2003 to 2015. From year to year, value of vegetation density is categorized very high which diminishing of 29431.71 hectares in 2003 to 329 , 94 ha on 2015. The average
of land surface temperature (LST) increased very significantly, from 16,8˚C on 2003 to 28, 04oC 2015
Results using Landsat 5 TM satellite imagery and Landsat 8 OLI
by direct observation in the field are quite appropriate. The review is carried out at crossroads, government offices whose construction
is not made within the previous 12 years, so that the image of the 2003, 2006, 2009, 2012 and 2015 has a lot of changes. For
gardens, fields, paddy cropping area are patterned to be matched
with the community. And based on the correlation equations prove negative notation on the R value means the relationship between the two variables is not unidirectional (negative correlation), if one goes up the other variables will fall. Correlation between NDVI and LST from 2003, 2006, 2009, 2012 and 2015 satellite
data has the average value of R -0.81 or approaching (highest negative correlation).
The diagram of NDVI dan LST changing value description can be seen in Figure 16 and 17.
Fig. 16: Changing Graphic of NDVI in Nias Island on 2003, 2006, 2009, 2012, 2015
Fig. 17: Changing Graphic of Vegetation Density Width in Hectare
Fig. 18: Changing Graphic of Temperature Indeks in Nias Island on 2003, 2006, 2009, 2012 and 2015
The results help predict the condition of NDVI and LST in the next year, then help the government to plan regional development without causing environmental damage.
IV. Conclusion The conclusion consider
The density of the vegetation on the Nias Island has decreased 1.
environmental changes in Nias Island due to lowering of NDVI values and raising of land surface temperature (LST)
V. Recomended
The research will helped to predict the NDVI and LST in the next year, also helped the government in district building planned without environtment degradation
References
[1] National Development Planning Agency (Bappenas), (2013),
North Sumatra Development Profile, Bappenas, Jakarta.
[2] Regional Development Planning Agency Nias (2012), Nias
in the figures, the Central Bureau of Statistics of Nias.
[3] Sukojo, (2003), Implementation Method Remote Sensing and Geographic Information System untukk anlisa Land Use Change. Surabaya: ITS.
[4] ESRI, (2001), ArcGIS Spatial Analyst; Advanced GIS Spatial Analysis Using Raster and Vector Data, ESRI Press, USA. [5] GIS consortium Aceh Nias, (2007), ArcGIS Training Module
Basic Level Government Staff Banda Aceh, Banda Aceh. [6] Howard, J. A., (1996), Remote Sensing for Forest Haya
Source: Theory and Applications, Gadjah Mada University Press, Yogyakarta.
[7] Lillesand, T.M., and F.W. Kiefer (1979), Remote Sensing and Image Interpretation, Yogyakarta, Gadjah Mada University Press.
[8] Novianti, L., (2012), Area of Land Cover Change Analysis of the East Coast Banyuasin with Change Vector Analysis Method. Semarang: Diponegoro University.
[9] Opa, E. T., (2010), Analysis of Changes in Land Mangrove Pahuwato district of Gorontalo Province by Using Landsat. Manado: FKIP.
[10] Center for Development and Empowerment of Teachers and Education Personnel Division Engineering and Industrial Engineering (2013), Fundamentals of Remote Sensing, Bandung.
[11] Zhang, Y., (2015), Research on the Contribution of Urban land Surface Moisture to the Alleviation Effect of Urban Land Surface Heat Based on Landsat 8 Data, Journal of Remote
Sensing 7: 2072-4292.
[12] Wu, W., (2014), The Generalized Difference Vegetation Index (GDVI) for dryland characterization, Journal of
Remote Sensing 6: 2072-4292.
[13] Aftriana, C., (2013), Analysis of Vegetation Change Semarang Using Remote Sensing Technology Assistance, Semarang: Diponegoro University.
[14] Fariz, H. (2014), Identification of Land Cover Using Satellite
Imagery SPOT 4. Bogor.
[15] Rakhmawati, M., (2012), The use of Landsat for Biomass Estimation on Surface of Different Land Cover Vegetation
2016