VOLUME 13 | ISSUE 1 | 2018 | 205
Improvement of balance in a 7-year-old child
through a six-week learning programme
JULIO MARTIN RUIZ1, DENISE DA VINHA RICIERI2, LAURA RUIZ SANCHIS1, RAÚL SANTAMARÍA FERNÁNDEZ1
1Catholic University of Valencia San Vicente Mártir, Valencia, Spain 2Federal University of Ceara, Fortaleza, Brazil
ABSTRACT
Given that human beings are constantly subjected to equilibration processes, developing basic perceptual motor skills, especially balance, is important. The main purpose of this study is the validation of the tasks and the progression of activities that form the learning programme for balance development in a six-week didactic unit of 12 sessions (2 sessions per week), for 6 to 9-year-old children (1st, 2nd, and 3rd grade of elementary school in Brazil). The changes in balance after applying the programme are also analysed through a new measuring protocol using baropodometry. Although the session was put into practice in a class of 28 children, data were extracted from a 7-year-old child. This is a single-case study in which analysis has been performed measuring pressure, surface and area, points of peak plantar pressure, and stabilometry, with the help of a baropodometer. Results obtained show the highest score areas are in the Quartiles (Q) forming the hindfoot (A= 60.40 cm2; SD= 3.68 cm2; p=.047), with a higher score in the peak pressure of Q2, located in the forefoot,
(A= 0.54 kgf/cm2; SD= 0.04 kgf/cm2; p= .030), and improvement in lateral oscillation of dominant foot (A=
1.12 Hz; SD= .00 Hz; p= .00). The data obtained show the participation of the 7-year-old child in the balance development learning programme improves the area and the surface of support of the Centre of Pressure (COP) in both feet, particularly in the dominant. Key words: BALANCE, BAROPODOMETER, BALANCE DEVELOPMENT LEARNING PROGRAMME, CENTER OF PRESSURE, STABILOMETRY.
1Corresponding author. Universidad Católica de Valencia San Vicente Mártir. C/ Ramiro de Maeztu, 14. Torrent, CP: 46900.
Valencia. España.
E-mail: [email protected] Submitted for publication June 2017 Accepted for publication January 2018 Published March 2018
JOURNAL OF HUMAN SPORT & EXERCISE ISSN 1988-5202 © Faculty of Education. University of Alicante
doi:10.14198/jhse.2018.131.12 Cite this article as:
206 | 2018 | ISSUE 1 | VOLUME 13 © 2018 University of Alicante INTRODUCTION
Physical Education (PE) subject in Primary Education (PEd) has as main purpose the development of motor skills, thus understood as the integration of knowledges, proceedings, attitudes and feelings linked to motor behaviour (RD 126/2014). Balance and coordination are skills that must be trained in PE classes because they are essential factors for the development of human motion (Navarro, 2001). More specifically in 2nd year of PEd, given that from 7 years, brain maturation takes place, thus defining laterality and handling of space.
To Glazebrook et al. (2011) and to Granacher, Muehlbauer, Zahner, Gollhofer, and Kressig (2011), schools provide the right atmosphere and place to effectively promote physical activities in children, facilitating the accomplishment of static and dynamic balance tasks on different surfaces (Donath et al., 2013). Luguaña (2013) highlights the importance of enjoying physical and sports activities in PE classes to increase the implication of the students in the task, thus improving their quality of life, self-esteem, and motor skills. Providing a variety of attractive sports extracurricular activities is also convenient to give the children the chance to choose their favourite physical activity and acquire healthy habits (Treasure and Roberts, 2001).
Balance
Balance in human motion is so important due to the process of bipedalism., which has an essential relevance in human motion. From the first months of life, children learn to control their bodies, keeping their center of gravity within the base of support (National Strength and Conditioning Association; 2015). According to Araya et al. (2014), preschool and Primary Education periods are crucial to child motion development. This is the time of acquisition of basic motor skills, formed by physical motor skills (strength, endurance, flexibility, and speed), social motor skills (cooperation, interaction, projection, and communication), and perceptual motor skills (coordination, balance, and laterality) (Castañer and Camerino, 2001).
Castañer and Camerino (2001), and Romero (2000) define perceptual motor skills as the disposition of the individual to respond and to adapt with the body motion to the stimuli produced in the environment. Navarro et al. (2001) and Taylor, Humphriss, Golding, and Emend (2016) define balance as the perceptual motor skill to take and hold any body position against the force of gravity on the base of support.
In all the usual actions of human being (sitting, walking, running, jumping, etc.), the surface of the base of support is relatively small, the center of gravity is relatively high (according to Miralles (2007), it is located posterior to L5 vertebra, and each body segment has its own), and the forces, weight and reaction that act on human body vary. For all these reasons, human being constantly looks for balance (Navarro et al., 2001). The evolution of balance is closely related to general individual development and experiences previously lived, parallel related to the maturation of the neurological and motor system. In prepubertal age, the maximum possibilities of balance training are reached with the consolidation of the nervous and neural system. The involution of balance appearing in advanced age responds to the nervous and locomotor system deterioration. Such deterioration worsens with inactivity and with musculoskeletal disorders (Navarro et al., 2001).
VOLUME 13 | ISSUE 1 | 2018 | 207
Rodríguez (2006), between 6 and 8 years of age, children show good dynamic coordination of the lower limbs due to the increase of the muscle development in this phase. At age 7, full brain development (prefrontal cortex) is completed, allowing high-precision motor coordination.
Häfelinger and Schuba (2010) point out that improvement in coordination is substantial and notable in balance. From age 7, it is important to remark on coordination training through bouncing, throwing, catching, and beating tasks, both with upper and lower limbs, in different support surfaces (stable and unstable). Hence coordination and balance must be trained at this age.
Nowadays, a huge variety of methods can be applied on postural and balance analysis, such as qualitative analysis, whose results describe posture, and quantitative analysis, such as the Berg balance scale (BBS) or the Star Excursion Balance Test (SEBT), whose quantitative results are based on subjective analysis of several activities. There are also high-technology tools, such as the force platform or the baropodometer, whose results are precise values representing the displacement of the Center of Pressure (COP) in the body during the support phase (Petrocci and Arbélaez, 2011). Stabilometry is a method of postural balance analysis through quantification of oscillations of the body by using the displacement of the COP during the support phase. This analysis shows objectively the average position of the CG on both feet and on the body and the oscillations, both lateral and anteroposterior, that are produced around the COP and in both feet (Paulo, 2011).
MATERIALS AND METHODS
The electronic baropodometer used in this study is composed by a pressure platform computerized by the Footwork software, a professional high-precision analysis system. This material allows the objective measurement of the following parameters: the mass distribution in orthostatic posture, stabilometry of the patient in static posture, the dynamic load transfer during the phase of the stage, the peak plantar pressure, and the time of contact on the floor (Arkipelago, 2009).
208 | 2018 | ISSUE 1 | VOLUME 13 © 2018 University of Alicante
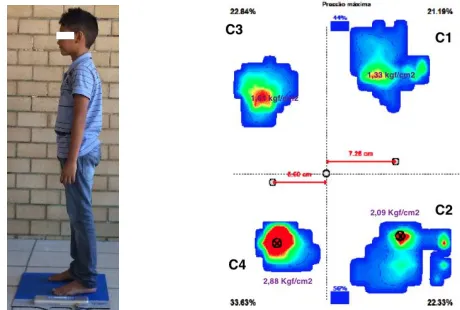
Figure 1. Image of the variables measured in baropodometry.
This study is supported by quantitative methodology through the results obtained with baropodometry. This is a single-case study in which an analysis on the subject’s reality is performed (Rodríguez, Gil, and García,
1996; Sandin, 2010). More specifically, it is an instrumental case study: reality is analysed to obtain higher clarity on a topic or theoretical aspect, while the specific case is secondary. The case is the tool to reach another objective (Stake, 2005).
The pretest-posttest design (PPD) was used in the study, which in our case is the learning programme for balance development performed by a subject; hence, only intra-subject comparison was used. The duration of the programme was 6 weeks, with 2 PE classes per week, which makes a total of 12 sessions of 30 minutes each.
Sample
The sample selection is nonprobabilistic, as convenient due to accessibility reasons. A 7-year-old child (n=1) without motor limitations participates. In order to participate in the study, a medical report of the subject was requested, guaranteeing that physical practice was not advised against, together with an informed consent form signed by his parents accepting the conditions of the study. This study was performed in the Elementary School Alba Frota, located in Fortaleza, state of Ceará (Brazil), from May to July 2015.
Learning programme for balance development
In the learning programme for balance development, performed in this study, exercises were distributed in 2 levels. The main difference between them is the surface of support. In level 1 the work is performed in stable surfaces and in level 2, unstable surfaces are used.
VOLUME 13 | ISSUE 1 | 2018 | 209
Table 1. Levels of the exercises of the didactic unit.
LEVEL 1
Stable Surface EASY LEVEL 2 Multiaxial unstable
surface
DIFFICULT
EXERCISES SCORE EXERCISES SCORE
Stability with more than 2 support points
(+2A) Very easy (1) +2A Very easy (6)
Static Bipodal (SB) Easy (2) SB Easy (7)
Dynamic Bipodal (DB) Medium (3) DB Medium (8)
Static Unipodal (SU) Difficult (4) SU Difficult (9)
Dynamic Unipodal (DU) Very difficult
(5) DU Very (10) difficult
The progression of the exercises composing the levels of the programme is established taking into account two variables: a) type of surfaces, stable or unstable; and b) number of support points, the higher the number of support points, the easier to keep the balance and conversely, the fewer the support points, the more difficult to keep the balance.
In order to make a proper progression of the subscales of static balance, the following aspects were taken into account: a) changes in the support points in the base of support, in which balance decreases or increases depending on whether the base of support is wider or smaller; b) location of the centre of gravity, the higher it is, the harder to keep the balance; c) impacts on the body, whether by mobile objects or by other classmates, tend to unbalance the body; d) catching of mobile objects, the action of catching an object can lessen the balance and e) duration, the longer the duration of the exercise, the more difficult the balance and vice versa.
In order to develop properly dynamic balance, the aforementioned aspects are taken into account, also adding speed and rhythm: any change of speed and rhythm makes balance more difficult due to the constant readjustments of the base of support and the centre of gravity.
During the measurement of dynamic balance, both unimodal and bipodal, phases of movement in which there was no contact with the base of support were added. For instance, race exercises or standing unimodal displacements.
Description of the measurement protocol
Weight, height, age, and foot size of the subject were measured at the beginning of the study. Afterwards, a 5-minute warm up was performed consisting on 10 repetitions of joint mobility exercises from scapular and pelvic joints to the more distal ones.
During baropodometric analysis, the subject stood still in the platform for 16 seconds, of which 6 were dismissed in data analysis (first 3 seconds of adaptation and last 3 seconds of fatigue), in two different postures of bipodal static support which are described below.
210 | 2018 | ISSUE 1 | VOLUME 13 © 2018 University of Alicante
Figure 2. Bipodal frontal support posture of the measurement protocol.
Second, bipodal lateral support posture, in a neutral posture with eyes opened staring at a fixed point. In order to interpret the data, quartiles (C) are changed following feet anatomic position, taking as a reference forefoot and hindfoot. With regard to stabilometry, oscillations (O) also change; anteroposterior O in the first posture changes to lateral O in the second one and on the contrary, lateral O in the first posture becomes anteroposterior O in the second one.
Figure 3. Bipodal lateral support posture of the measurement protocol.
RESULTS
Two types of analysis were performed with IBM V.22 software for MAC OS. First, descriptive statistics were obtained, in which average (A) and standard deviation (SD) of both pretest and posttest were shown. Afterwards, comparative analysis with t-test were conducted to related samples. Given that all variables without exception are scalar and can be distinguished by interval, and the sample including a single subject, hence assuming homogeneity, a parametric test was also performed.
VOLUME 13 | ISSUE 1 | 2018 | 211
Descriptive tests
Results obtained in baropodometry test can be checked bellow. In Table 2, results of medium and peak pressure on both feet are shown. According to the data, medium pressure (A= .29 kgf/cm2; SD= .05 kgf/cm2)
and peak pressure (A= .89 kgf/cm2; SD= 0.28 kgf/cm2) of the left foot are higher than medium pressure (A=
0.21 kgf/cm2; SD= 0.03 kgf/cm2) and peak pressure (A= 0.56 kgf/cm2; SD= 0.18 kgf/cm2) of the right foot.
Table 2. Average and Standard Deviation of pressure on both feet.
Variable A SD
Medium pressure left foot 0.29 kgf/cm2 0.05 kgf/cm2
Peak pressure left foot 0.89 kgf/cm2 0.28 kgf/cm2
Medium pressure right foot 0.21 kgf/cm2 0.03 kgf/cm2
Peak pressure right foot 0.56 kgf/cm2 0.18 kgf/cm2
Note: A= Average. SD=Standard Deviation
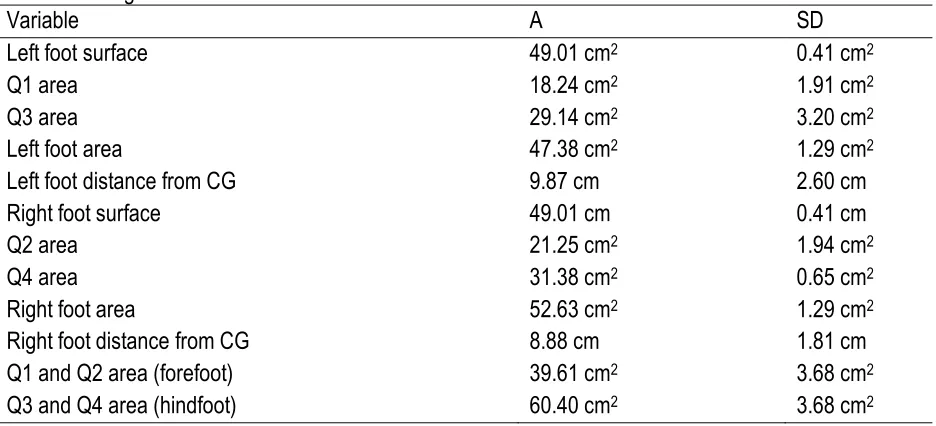
Table 3 presents the results of surface and distance of both feet from CG, as well as the area of both feet and four quartiles in which they are divided. Surface of both feet is the same (left foot: A= 49.01cm; SD= .41cm. Right foot: A= 49.01cm; SD= .41cm) and distance of left foot from CG (A= 9.87cm; SD= 2.60cm) is longer than right foot (A= 8.88cm; SD=1.81cm). Area of right foot (A= 52.63 cm2; SD= 1.29 cm2) is wider than
left foot (A= 47.38 cm2; SD= 1.29 cm2), and areas of four quartiles from highest to lowest are ordered as
follows: Q4 (A= 31.38 cm2; SD= .65 cm2), Q3 (A= 29.14 cm2; SD= 3.20 cm2), Q2 (A= 21.25 cm2; SD= 1.94
cm2), and Q1 (A= 18.24 cm2; SD= 1.91 cm2), presenting higher score the quartiles that form the hindfoot, Q3
and Q4, (A= 60.40 cm2; SD= 3.68 cm2), than the quartiles that form the forefoot, Q1 and Q2 (A= 39.61 cm2;
SD= 3.68 cm2).
Table 3. Average and Standard Deviation of surface and area of both feet.
Variable A SD
Left foot surface 49.01 cm2 0.41 cm2
Q1 area 18.24 cm2 1.91 cm2
Q3 area 29.14 cm2 3.20 cm2
Left foot area 47.38 cm2 1.29 cm2
Left foot distance from CG 9.87 cm 2.60 cm
Right foot surface 49.01 cm 0.41 cm
Q2 area 21.25 cm2 1.94 cm2
Q4 area 31.38 cm2 0.65 cm2
Right foot area 52.63 cm2 1.29 cm2
Right foot distance from CG 8.88 cm 1.81 cm
Q1 and Q2 area (forefoot) 39.61 cm2 3.68 cm2
Q3 and Q4 area (hindfoot) 60.40 cm2 3.68 cm2
Note: A=Average. SD.=Standard Deviation. CG.=Centre of Gravity. Q1, 2, 3, 4.=Quartile1, 2, 3, 4.
Table 4 shows peak pressure points in four quartiles ordered from highest to lowest: Q3 (A= 1.04 kgf/cm2;
SD=.39 kgf/cm2), Q4 (A= .89 kgf/cm2; SD= .19 kgf/cm2), Q1 (A= .57 kgf/cm2; SD= .16 kgf/cm2), and Q2 (A=
.54 kgf/cm2; SD= .04 kgf/cm2). Peak pressure score is higher in the quartiles that form the hindfoot, Q3 (A=
212 | 2018 | ISSUE 1 | VOLUME 13 © 2018 University of Alicante
(A= .57 kgf/cm2; SD= .16 kgf/cm2) and Q2 (A= .54 kgf/cm2; SD= .04 kgf/cm2). Left foot quartiles, Q1 (A= .57
kgf/cm2; SD= .16 kgf/cm2) and Q3 (A= 1.04 kgf/cm2; SD= .39 kgf/cm2), also score higher than right foot
quartiles, Q2 (A= .54 kgf/cm2; SD= .04 kgf/cm2) and Q4 (A= .89 kgf/cm2; SD= .19 kgf/cm2).
Table 4. Average and Standard Deviation of peak pressure points in quartiles.
Variable A SD
Q1 peak pressure point 0.57 kgf/cm2 0.16 kgf/cm2
Q3 peak pressure point 1.04 kgf/cm2 0.39 kgf/cm2
Q2 peak pressure point 0.54 kgf/cm2 0.04 kgf/cm2
Q4 peak pressure point 0.89 kgf/cm2 0.19 kgf/cm2
Note: A= Average. SD.= Standard Deviation. Q1,2,3,4.=Quartile 1,2,3,4.
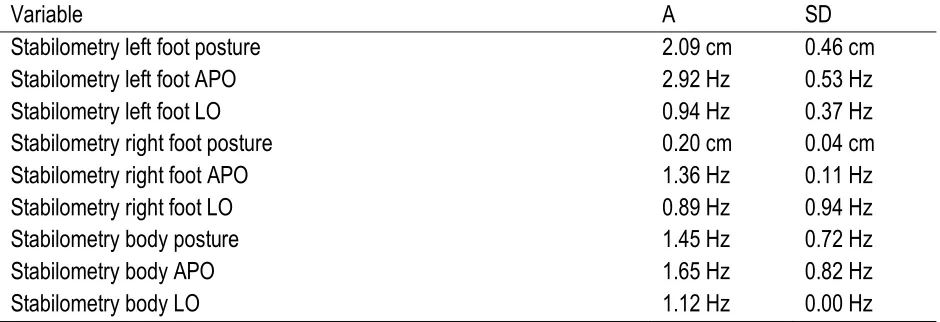
Last, Table 5 shows stabilometry data, i. e., foot and body posture and oscillations in relation to the CG. The highest score posture is the left foot (A= 2.09 cm; SD= .46 cm), followed by the body (A= 1.45 cm; SD= .72 cm), and the right foot (A= .20 cm; SD= .04 cm). With regard to oscillations, the highest lateral oscillation is the body (A= 1.12 Hz; SD= .00 Hz), followed by the left foot (A= .94 Hz; SD= .37 Hz), thus being the lowest the right foot (A= .89 Hz; SD= .94 Hz). The left foot anteroposterior oscillation is the highest (A= 2.92 Hz; SD= .53 Hz), followed by the body (A= 1.65 Hz; SD= .82 Hz) and the right foot (A= 1.36 Hz; SD= .11 Hz). Table 5. Average and Standard Deviation of stabilometry variables in both feet.
Variable A SD
Stabilometry left foot posture 2.09 cm 0.46 cm
Stabilometry left foot APO 2.92 Hz 0.53 Hz
Stabilometry left foot LO 0.94 Hz 0.37 Hz
Stabilometry right foot posture 0.20 cm 0.04 cm
Stabilometry right foot APO 1.36 Hz 0.11 Hz
Stabilometry right foot LO 0.89 Hz 0.94 Hz
Stabilometry body posture 1.45 Hz 0.72 Hz
Stabilometry body APO 1.65 Hz 0.82 Hz
Stabilometry body LO 1.12 Hz 0.00 Hz
Note: A= Average. SD.=Standard Deviation. APO.=Anteroposterior Oscillation. LO.=Lateral Oscillation
Comparative tests
T-test was used in a sample as parametric test for average comparison, assuming significance if p<0.05, thus obtaining the following results:
Table 6 shows the relevant results in the following variables:
• Surface of both feet: obtained score were equal in both left (A= 49.01cm; SD= .41cm; p = .00) and right foot (A= 49.01cm; SD= .4cm; p= .00).
• Area of both feet: the right foot area (M= 52.63 cm2; DT= 1.29 cm2; p= .00) is higher than the left foot
VOLUME 13 | ISSUE 1 | 2018 | 213
• Area of quartile: highest to lowest, as follows: Q4 (A= 31.38 cm2; SD= .65 cm2; p= .00), Q3 (A= 29.14
cm2; SD= 3.20 cm2; p= .00), Q2 (A= 21.25 cm2; SD= 1.94 cm2; p= .00), and Q1 (A= 18.24 cm2; SD=
1.91; p= .00).
• Area of forefoot and hindfoot: quartiles forming the hindfoot, Q3 and Q4, (A= 60.40 cm2; SD= 3.68
cm2; p=.04), scored higher than the quartiles forming the forefoot, Q1 and Q2 (A= 39.61 cm2; SD=
3.68 cm2; p=.04).
Table 6. Differences of surface pretest and posttest, and area of both feet.
Variable A SD Sig.
Left foot surface 49.01 cm 0.41 cm 0.004
Q1 area 18.24 cm2 1.91 cm2 0.047
Q3 area 29.14 cm2 3.20 cm2 0.049
Left foot area 47.38 cm2 1.29 cm2 0.012
Left foot distance from CG 9.87 cm 2.60 cm 0.117
Right foot surface 49.01 cm 0.41 cm 0.004
Q2 area 21.25 cm2 1.94 cm2 0.041
Q4 area 31.38 cm2 0.65 cm2 0.009
Right foot area 52.63 cm2 1.29 cm2 0.011
Right foot distance from CG 8.88 cm 1.81 cm 0.091
Note: A= Average. SD.=Standard Deviation. Sig.=Significance. CG.=Centre of Gravity. Q1,2,3,4.=Quartile 1,2,3,4.
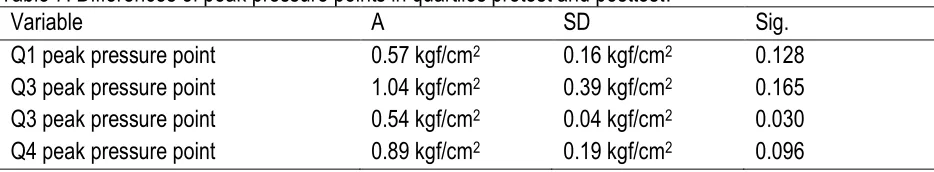
With regard to peak pressure points in quartiles, as shown in Table 7, significant results have been found in Q2 (A= 0.54 kgf/cm2; SD= .04 kgf/cm2; p= .030).
Table 7. Differences of peak pressure points in quartiles pretest and posttest.
Variable A SD Sig.
Q1 peak pressure point 0.57 kgf/cm2 0.16 kgf/cm2 0.128
Q3 peak pressure point 1.04 kgf/cm2 0.39 kgf/cm2 0.165
Q3 peak pressure point 0.54 kgf/cm2 0.04 kgf/cm2 0.030
Q4 peak pressure point 0.89 kgf/cm2 0.19 kgf/cm2 0.096
Note: A=Average. SD.=Standard Deviation. Sig.=Significance. Q1,2,3,4.=Quartile 1,2,3,4.
214 | 2018 | ISSUE 1 | VOLUME 13 © 2018 University of Alicante
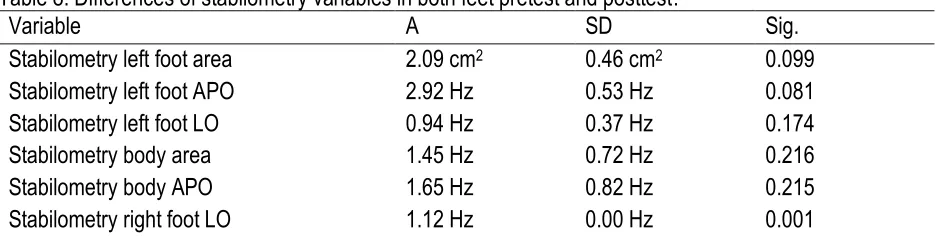
Table 8. Differences of stabilometry variables in both feet pretest and posttest.
Variable A SD Sig.
Stabilometry left foot area 2.09 cm2 0.46 cm2 0.099
Stabilometry left foot APO 2.92 Hz 0.53 Hz 0.081
Stabilometry left foot LO 0.94 Hz 0.37 Hz 0.174
Stabilometry body area 1.45 Hz 0.72 Hz 0.216
Stabilometry body APO 1.65 Hz 0.82 Hz 0.215
Stabilometry right foot LO 1.12 Hz 0.00 Hz 0.001
Note: A= Average. SD.=Standard Deviation. Sig.=Significance. APO.=Anteroposterior oscillation. LO.=Lateral Oscillation.
Results in medium and peak pressure in both feet do not show significant differences, being medium pressure (A= 0.29 kgf/cm2; SD= .05 kgf/cm2; p= .078) and peak pressure (A= .89 kgf/cm2; SD= .28 kgf/cm2; p= .141)
in the left foot higher than medium pressure (A= .21 kgf/cm2; SD= .03 kgf/cm2; p= .060) and peak pressure
(A= .56 kgf/cm2; SD= .18 kgf/cm2; p=.141) in the right foot.
DISCUSSION
The purpose of this study is the validation of tasks and the progression of activities that compound the learning programme for balance development, as well as the analysis of changes produced after applying a balance learning programme in plantar support, body mass distribution and its repercussion in a 7-year-old child with a new measurement protocol by baropodometry.
Plantar area
There has been an improvement in the surface of support and area in both feet, always higher in the dominant foot, in this case the right one. These results agree with those obtained by Boraoa, Planasb, Beltranb, and Corbi (2015), in which changes in dynamic balance in young basketball players (15,12 ± 0,83) were induced after performing a training programme of coordination, strength, and specific skills of this sport. Their results showed that healthy subjects increase both their static and dynamic balance after a 6-week training (3 days per week). Filipa et al. (2010) studied dynamic balance in young healthy sportsmen after 8 weeks of neuromuscular training. Results suggested that with specific balance, coordination, and strength training, dynamic balance improves. Prieto et al. (2015) performed a specific balance programme for 24 weeks (3 days per week, 60 minutes per session), which resulted in positive changes in stability in a sampling of adult women.
In this case, improving the surface of support and the area of both feet implies a wider base of support, which represents an improvement in static balance. The improvement in quartiles forming the hindfoot, Q3 and Q4, is the most significant with regard to the feet area.
Plantar pressure
With regard to the peak pressure in both feet, an improvement in Q2, the quartile of right foot forefoot, is observed. Hence, there has been an improvement in the distribution of mass and weight. As Marsico, Moretti, and Patella (2002) state, distribution of weight on the foot reflects the posture and posture balance.
VOLUME 13 | ISSUE 1 | 2018 | 215
COP oscillation
Last, improvements in lateral COP oscillation on the right foot have been observed, which translates into better balance. Nagel, Fernholz, Kibele, and Rosenbaum (2008) consider posture of COP on both feet is a good way to assess balance. Nomura et al. (2009) observed electronic platforms, such as the baropodometer, have a higher precision than force platforms to calculate COP displacements and recommend the use of high-precision systems to measure COP related displacements. In doing so, new objective information to study the balance regarding the maximum displacement of body COP and of both feet, the average speed, and the distribution of body weight among the different areas of the foot in touch with the floor.
CONCLUSION
Results obtained in the study show the main objective has been achieved, i. e., a learning programme for balance development of 6 weeks improves plantar support and the distribution of body weight resulting in balance improvement in a 7-year-old child.
Findings achieved showed a 7-year-old boy improved the area and surface of support of COP on both feet, especially the right –the dominant one- by performing this learning programme for balance development. Significant improvement has also been found in peak pressure in Q2, which shows an improvement in distribution of mass and body weight. Finally, the area of the four quartiles in which the foot is divided has improved, as explained in materials and variables, especially the hindfoot.
As proved, the tasks and the progression of activities that compose the programme are proper. The time required to achieve a significant improvement in the balance of a 7-year-old child has been reduced in comparison with Boraoa, Planasb, Beltranb, and Corbi (2015), who performed a 6-week training programme (3 days per week) with young basketball players (15,12 ± 0,83), and with Donath et al. (2013), who performed a 6-week training programme (5 days per week) with 7-10 years old children. The duration of sessions in the aforementioned studies was 10 minutes, while in this study, sessions lasted 30 minutes.
It is worth mentioning the applicability of the learning programme for balance development in Primary schools and in sports, as mentioned in the introduction, due to the importance of balance in human motor skills as well as in the early diagnosis of related disorders, such as partial deafness or blindness.
With regard to the changes in the measurement protocol with baropodometer, the changes in quartiles and oscillations are correct. However, data of the distance of each of the foot from the CG is distorted, due to the analysis performed by the tool: in the second posture, the tool reads the distance of CG from the forefoot and the hindfoot. Thus, data of the distance of CG from each foot in the second posture of measurement is not reliable.
216 | 2018 | ISSUE 1 | VOLUME 13 © 2018 University of Alicante REFERENCES
Arkipelago. Baropodómetro Eletrónico: Programa Footowork. Available in: http://www.arkipelago.com.br/prod_footwork.php consultado en: 07/05/2015.
Araya, L., Vergara, F., Arias, I., Fabré, H. Soxo, M, and Muñoz, C. (2013) Diferencias en equilibrio estático y dinámico entre niños de primero básico de colegios municipales y particulares subvencionados. Revista Ciencias de la Actividad Física UCM, 15 (1), 17-23.
Boraoa, O., Planasb, A., Beltranb, V, and Corbi, F. (2015). Efectividad de un programa de entrenamiento neuromuscular de 6 semanas de duración aplicado en el tobillo en la realización del Star Excursion Balance Test en jugadores de baloncesto. Apunts Medicina de I'Esport, 50, (187), 95-102.
Castañer, M. and Camerino, O. (2001) La Educación Física en la enseñanza primaria. Barcelona: Inde. Donath, L., Roth, R., Rueegge, A., Groppa, M., Zahner, L., and Faude, O. (2013) Eff ects of Slackline Training on Balance, Jump Performance & Muscle Activity in Young Children. International Journal of Sports Medicine, 34, 1093-1098. https://doi.org/10.1055/s-0033-1337949
Filipa, A., Byrnes, R., Paterno, M., Myer, G., and Hewett, T. (2010). Neuromuscular training improves performance on the star excursion balance test in young female athletes. Journal of Orthopaedic and Sports Physical Therapy, 40, 551-8. https://doi.org/10.2519/jospt.2010.3325
Glazebrook, C., Batty, M. J., Mullan. N., Macdonald, I., Nathan, D., Sayal, K., Smyth, A., Yang, M., Guo, B., and Hollis, C.(2011) Evaluating the eff ectiveness of aschools-based programme to promote exercise self-effi cacy in childrenand young people with risk factors for obesity: steps to active kids (STAK) . BMC public health, 11, 830. https://doi.org/10.1186/1471-2458-11-830
Granacher, U., Muehlbauer, T., Zahner, L., Gollhofer, A., and Kressig, R.W. (2011) Comparison of traditional and recent approaches in the promotion of balance and strength in older adults. Sports Med, 41, 377 – 400. https://doi.org/10.2165/11539920-000000000-00000
Häfelinger, U. and Schuba, V. (2010). La coordinación y el entrenamiento propioceptivo. Badalona (España): Paidotribo.
Luguaña, J.C. (2013). Aplicación de un programa recreativo para el desarrollo de las destrezas motrices básicas en niños/as de 8 a 9 años de edad de cuarto año de educación básica de la escuela fiscal mixta "costa rica" de nayón de la provincia de pichincha del cantón quito. Propuesta alternativa. (Doctoral thesis). Universidad de las fuerzas armadas. Departamento de ciencias humanas y sociales (Sangloqui, Ecuador).
Marsico, V., Moretti, B., and Patella, V. Analisi baropodometrica del passo in soggetti sani anziani ed in pazienti gonartrosici prima e dopo intervento di artroprotesi di ginocchio. G Ital Med Lav Erg. 2002; 24(1): 72-83.
Miralles, R. and Mirralles I. (2007). Biomecánica clínica de las patologías del aparato locomotor. Barcelona: Masson.
Nagel, A., Fernholz, F., Kibele, C., and Rosenbaum, D. (2008) distance running increases plantar pressures beneath the metatarsal heads: a barefoot walking investigation of 200 marathon runners. Gait Posture; 27(1):152-155. https://doi.org/10.1016/j.gaitpost.2006.12.012
National Strength and Conditioning Association (NSCA) (2015) Guía de condicionamiento físico. Diretrxes prar elaboraçao de programas. Brasil: Editora Manole Ltda.
Navarro, M., García, J.M., Brito, Mª. E., Navarro, R., Ruiz, J.A., and Egea, A. (2001) Coordinación y equilibrio. Concepto y actividades para su desarrollo. Departamento Hospital Universitario Insular. U.L.P.G.C. Servicio de Cirugía Ortopédica y Traumatología; 280-286.
VOLUME 13 | ISSUE 1 | 2018 | 217
Paulo, J. (2011) Influência da manipulação osteopática sacroilíaca sobre a pressão plantar e oscilação corporal através do sistema de baropodometria e estabilometria. (Tesis doctoral). Universidade do Vale do Paraíba. Programa de Pós-graduação em Bioengenharia. (Vale do Paraíba, Brasil). Petrocci, K.E., and Arbeláez, M.F. (2011) La medición del control postural con estabilometría: una
revision documental. REV.COL.REH.; 10: 16-24.
Piovesan, A.C. (2015) Efeitos de um tratamento fisioterapêutico nador, equilibrío postural, distribuição das cargas de pressão plantar e sensibilidade de idosas diabéticas tipo 2. (Tesis doctoral) Universidad Federal de Santa Maria Centro de Educaçao Física e desportos. Programa de Pós-graduaçao em Educaçao Física. (Santa María, RS, Brasil).
Prieto, A., Del Valle, M., Nistal, P., Méndez, D., Barcala-Furelos, R., and Abelairas-Gómez, C. (2015) Relevancia de un programa de equilibrio en la calidad de vida relacionada con la salud de mujeres adultas mayores obesas. Nutr Hosp., 32(6):2800-2807.
Royal Decree 126/2014, of 28 of February, whereby the core curriculum of Primary Education is established. Boletín oficial del Estado, núm. 52, of 1 of March, 2014, pp. 19349-19420.
Ribeiro, L. and Costa, L. (2013). Descarga de peso em crianças e adolescentes com paralisia cerebral. Uniersidade Federal de Juiz de Fora. Trebalho de Conclusao de Cruso à Faculdade de Fisioterapia. (Juiz de Fora, Brasil).
Rodríguez, P.L. (2006) Educación física y salud en primaria: hacia una educación corporal significativa y autónoma. Barcelona: Inde.
Rodríguez, Gil, and García, (1996). Metodología de investigación cualitativa. Málaga: Aljibe.
Romero, S. (2001). Formación deportiva: nuevos retos en la educación. Salamanca, España: Secretariado de publicaciones.
Taylor, C.M., Humphriss, R., Hall, A., Golding, J., and Emend, A.M. (2016) Balance ability in 7- and 10-year-old children: associations with prenatal lead and cadmium exposure and with blood lead levels in childhood in a prospective birth cohort study. BMJOpen, 5.
Treasure, D. C. and Roberts, G. C. (2001). Student's perceptions of the motivational Trclimate, archievement beliefs and satisfaction in physical education. Research Quarterly of Exercise and Sport, 72, 165-175. https://doi.org/10.1080/02701367.2001.10608946
Sandín, M. (2010). Investigación cualitativa en educación. España: S.A. McGraw-Hill.
Shopr, N. (2009) Efeitos das palmilhas posturais sobre a postura corporal de escolares (Tesis doctoral). Universidad Federal do Rio Grande do Sil. Programa de pós-graduaçao em ciências do movimiento humano. Mestrado em Ciências do Movimento Humano.(Porto Alegre, Brasil).
Stake, R.E. (2005). Investigación con estudio de casos. Madrid: Ediciones Morata (2).