Machine Learning Techniques used for
Analysis of Air Quality
1
Praveen SR Konduri,
2B Ravi Kumar,
3Mahendra Narla
1Dept. of CSE, Malla Reddy College of Engineering and Technology, Hyderabad, Telangana, India
2Dept. of Basic Science and Humanities, Vignan's Institute of Engineering for Women,
Visakhapatnam, Andhra Pradesh, India
3Dept. of CSE, Miracle Educational Society, Visakhapatnam, Andhra Pradesh, India
Abstract
In the populated and creating nations, governments think about the guideline of air as a noteworthy undertaking. The
meteorological and traffic factors, consuming of non-renewable
energy sources, mechanical parameters, for example, control plant discharges assume noteworthy jobs in air pollution. Among all the particulate issue that decide the nature of the air, Particulate issue (PM 2.5) needs more consideration. At
the point when its level is high in the air, it causes difficult
issues on individuals’ wellbeing. Henceforth, controlling it by
always keeping aware of its level in the air is significant. In this
paper, Logistic relapse is utilized to recognize whether a data test is either dirtied or not contaminated. Auto relapse is utilized to foresee future estimations of PM2.5 dependent on the past PM2.5 readings. Learning of level of PM2.5 in nearing years, month or week, empowers us to lessen its level to lesser than the destructive range. This framework endeavors to anticipate PM2.5 level and identify air quality dependent on a data set comprising of day by day air conditions in a particular city.
Keywords
Air Pollution, Respiratory sicknesses, Machine learning, Air Quality.
I. Introduction
A. Air Pollution: Air contaminations cause a genuine negative effect on earth’s environments, by modifying the world’s climate physically, synthetically and naturally. Gases like Sulfur Dioxide (SO2), Nitrogen Dioxide (NO2), Carbon monoxide, Methane, ground Ozone joined with particulate issue and lead are the main patrons that contaminate air and cause brown haze and corrosive downpours. They additionally modify the parity of earth’s environment and lead to a dangerous atmospheric deviation. Wellsprings of air pollution are generally anthropogenic; depletes from autos, aircraft, marine vessels, modern debilitates,
consuming of petroleum products, squanders from fighting, for
example, atomic radiation, poisonous gases, germ warfare [9].
Burning of non-renewable energy sources discharge SO2 and NO2 which add to fermentation of lakes and streams. Particulate
issue (P.M2.5, P.M10) involved solids and fluid beads coasting in the air are a consequence of ignition. Modern outflows, vehicle depletes and dumping of synthetic solvents in landfill
respond with existing toxins to make ground Ozone. Aside from
affecting environments, air contaminations influence human
wellbeing; ground Ozone responds with daylight and causes lung aggravation and asthma. Molecule pollution triggers illnesses like heart assaults, asthma, emphysema, pneumonia, bronchitis and headaches. Presentation to SO2 and NO2 influences respiratory
frameworks in youngsters. Air contaminations likewise exhaust
environmental Ozone which thusly prompts infiltration of hurtful
UV radiation prompting skin and eye malignancies. UV radiation
additionally influences vegetation and biological systems [10].
The World Health Organization 2016 announcement 94:487 -
488 proposes, utilization of clean vitality sources, controlling
car traffic, prohibiting diesel vehicles, debilitating substantial
utilization of cars by expanding fuel charges and leaving expenses so as to decrease the general pollution level. B. Machine learning approach: Data Mining is Knowledge Discovery in Database (KDD); concealed examples and obscure relationships are uncovered by applying factual examination and machine learning calculations in monstrous, complex data sets. By further applying machine learning calculations, precise wellbeing diagnostics can be accomplished as for the impacts of air pollution on human wellbeing.
II. Related Work
Numerous works have been done in air quality expectation utilizing machine learning and profound learning models. A portion of the condition of workmanship procedures is examined
here. Li et. al estimated the air pollution utilizing spatio-worldly
addition techniques [1]. Hsieh et al. utilized a system dependent on liking chart to bargain eith constant air nature of a land area and recognizing the ideal areas to build up screen stations [2]. Dong et assembled a concealed semi markov model anticipate PM2 .5 [3]. Thomas and Jacko conveyed the fundamental relapse and neural system to forsee the centralization of PM2 .5 in air
[4]. An itemized highlight investigation, was finished by Zhou
et. al through a probabilistic unique causal model that uncovers
the dynamic fleeting conditions of PM2 .5 [5]. Shabanet. al.
concocted a framework for observing and anticipating air pollution to recognize profoundly dirtied region in a given city [6]. [7] created a system for assessing air pollution by considering
traffic conditions and the accessible greenery. MdNazmulHoq e
al. planned a versatile application to anticipate the asthma assault
on exceptionally populated urban communities [8]. Zhongang
III. Air Quality Evaluation
Air quality evaluation is an important way to monitor and control air pollution. The characteristics of air supply affect its
suitability for a specific use. A few air pollutants, called criteria
air pollutants, are common throughout the United States. These pollutants can injure health, harm the environment and cause property damage. The current criteria pollutants are:
Carbon Monoxide (CO) 1.
Lead (Pb) 2.
Nitrogen Dioxide (NO
3. 2)
Ozone (O 4. 3)
Particulate matter (PM) 6) Sulfur Dioxide (SO
5. 2).
The Air Quality System (AQS) contains ambient air pollution data collected by EPA, state, local, and tribal air pollution control agencies from over thousands of monitors. AQS also contains meteorological data, descriptive information about each monitoring station (including its geographic location and its operator), and data quality assurance/quality control information. AQS data is
used to assess air quality, assist in Attainment/Non-Attainment designations, evaluate State Implementation Plans for
Non-Attainment Areas, perform modeling for permit review analysis, and other air quality management functions. AQS information is also used to prepare reports for Congress as mandated by the Clean Air Act
A. Air Quality Shtandards
Office of air quality planning and standards (OAQPS) manages
EPA programs to improve air quality in areas where the current quality is unacceptable and to prevent deterioration in areas where the air is relatively free of contamination. To accomplish this task, OAQPS establishes the National Ambient Air Quality Standard (NAAQS) for each of the criteria pollutants. There are two types
of standards - primary and secondary.
Primary standards:
1. They protect against adverse health effects;
Secondary standards:
2. They protect against welfare effects, such as damage to farm crops and vegetation and damage to buildings.
Because different pollutants have different effects, the NAAQS standards are also different. Some pollutants have standards for
both long-term and short-term averaging times. The short-term standards are designed to protect against acute or short-term health effects, while the long-term standards were established to protect
against chronic health effects. Because different pollutants have different effects, the NAAQS [3] standards are also different and some of them are shown in Table I. Some pollutants have standards
for both long-term and short-term averaging times. The short-term standards are designed to protect against acute, or short-term, health effects, while the long-term standards were established to
protect against chronic health effects.
According to the researchers E. Kalapanidas and N. Avouris [4], modeling of atmospheric pollution phenomena till now has been based mainly on dispersion models that provide approximation of the complex physicochemical processes involved. While the sophistication and complexity of these models have increased
over the years, use of these techniques in the frame of real-time
atmospheric pollution monitoring seems not totally suitable in terms of performance, input data requirements and compliance with the time constraints of the problem. Instead, human
experts’ knowledge has been primarily applied in Air Quality
Operational Centers for the real-time decisions required, while mathematical models have been used mostly for off-line studies
of the phenomena involved. As per them, air pollution phenomena have been measured by using physical reality as the start point. And then, for example, these data traditionally have been coded into differential equations. However, these kinds of techniques have limited accuracy due to their inability to predict extreme events.
Table 1: NAAQS Table Lists all Criteria Pollutants and Standards [3]
Pollutant Primary/ Secondary Averaging Time Level Form
Carbon Monoxide
(CO) Primary
8 hours 9 ppm Not to be exceeded more than once per year 1 hour 35 ppm
Lead (Pb) Primary and secondary
Rolling 3 month average
0.15 μg/
m3 Not to be exceeded
Nitrogen Dioxide
(NO2) Primary
1 hour 100ppb
98th percentile of 1-hour daily maximum concentrations, averaged over 3 years
1 year 53 ppb Annual Mean
Ozone (O3) Primary and
secondary 8 hours
0.07 ppm
Annual fourth-highest daily maximum 8-hour concentration, averaged over 3 years
Table 2: AQI Classification [3]
AQI Air Pollution Level
0-50 Excellent
51-100 Good
101-150 Lightly Polluted
151-200 Moderately Polluted
201-300 Heavily Polluted
300+ Severely Polluted
We have one important parameter called Air Quality Index (AQI)
which quantifies air quality in a region as shown in Table II. It
IV. Machine-Learning Prediction Models
Machine Learning (ML) is the branch of computer sciencewhich makes computers capable of performing a task withoutbeing explicitly programmed. There are many research papers that focus
on classification of air quality evaluation using machine learning algorithms. Most of these articles use different scientific methods,
approaches and ML models to predict air quality. S. Y. Muhammed et al. in points out that machine learning algorithms are best suited for air quality prediction. Some of them are discussed below.
A. Artificial Neural Network Model (ANN)
Artificial neural Network model tries to simulate the structures
and networks within human brain. The architecture of neural networks consists of nodes which generate a signal or remain silent as per a sigmoid activation function in most cases. A. Sarkar et al. in points out that the ANNs are trained with a training set of inputs and known output data. For training, the edge weights are manipulated to reduce the training error. E. Kalapanidas et al.
in use a feed forward multi-perceptron network consisting of 10
input nodes, 2 hidden layers of 6 and 4 nodes respectively, and 1
output node as shown in fig.
The step functions at the nodes of the hidden layers are all 1.
Gaussian. The training process is the error back propagation,
where there has been 5-6 working hours until the network
performed well against the training set.
Many less successful trials have been made, trying networks 2.
with different architectures.
The architecture of the ANN used for experimentation along 3.
with the previous techniques, an inductive top down decision
tree was used, in particular the Oblique Classifier (OC1)
which has been reported to have an improved performance over the standard decision treealgorithms like ID3, C4.5 and their inherits.
The whole idea of OC1 is that the tree might split at each node 4.
according to the algebraic sum of several attributes, not just one as is the case with the standard C4.5 programs.
Fig. 1. ANN Model for Air Quality
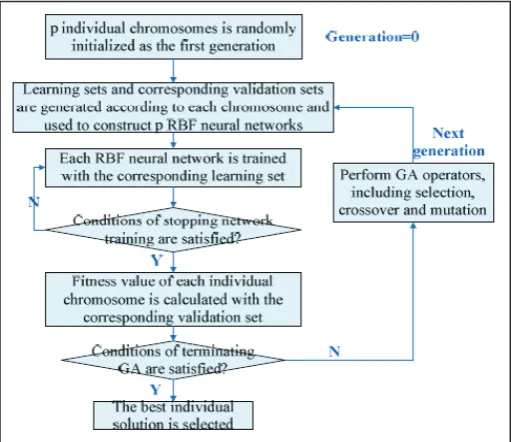
B. Genetic Algorithm — ANN Model
H. Zhao et al. in used an improved ANN model called GA-ANN
in which GA (genetic algorithm) is used to select a subset of
factors from the original set and the GA-selected factors are fed into ANN for modeling and testing as shown in fig. 2. In the
experiments, air quality monitoring data and meteorological data (9 candidate factors) from 2003 to 2006 are utilized for modeling, and the data in 2007 is utilized for performance evaluation. Three
models, including GA-ANN, normal ANN and PCA-ANN, are compared. The correlation coefficients of GA-ANN, which are
calculated between monitoring and predicting values are both higher than the other two models for S02 (sulfur dioxide) and N02
(nitrogen dioxide) predicting. The results indicate that GA-ANN
model performs better than another two models on air quality predicting.
Fig. 2. Flow of genetic algorithm based ANN
C. Random Forest Model
Random forests follow a technique as per where several decision trees are built based on subsets of data and an aggregation of the
predictions is used as the final prediction as shown in Fig. 3. R. Yu
et al. in used a random forest approach for predicting air quality (RAQ) forurban sensing systems. The data generated by urban
sensing includes meteorology data road information, real-time traffic status and Point of Interest (POI) distribution. The random
forest algorithm is exploited for data training and prediction. Compared with three other algorithms, this approach achieves better prediction precision. They used the standard, where the AQI is based on the levels of six atmospheric gases, namely Sulfur Dioxide (SO2), Nitrogen Dioxide (NO2), suspended particulates smaller than 10 µm in aerodynamic diameter (PM10), suspended particulates smaller than 2.5 µm in aerodynamic diameter (PM2.5), Carbon Monoxide (CO), and Ozone (O3), measured at the monitoring stations throughout each city. The AQI value is calculated per hour according to a formula published byMinistry of Environmental Protection. The approach is explained below: In the RAQ algorithm, all data are collected from the urban sensing system including air monitoring station data, meteorology data,
traffic data, road information and POI data and necessary features are extracted from heterogene. In the experiments, one-month
data from 4 May 2015 to 5 June 2015 is collected.In their testing period, they used a total of 2701 data to test this algorithm and Shenyang is divided into 1258 grids corresponding to 34 rows and 37 columns.
In Shenyang, this algorithm finally results in an overall precision
Fig. 3. Random Forest Simplified
D. Decision Tree Model
Decision tree model is a tree model in which each branch node represents a choice between several alternatives, and each leaf
node represents a decision as per as shown in fig. 4. It is a
supervised learning technique which uses a predictive model to map observations about an item (represented in the branches) to conclusions about the item’s target value (represented in the leaves). In S. Deleaweet al., create mapping from features to
classification with a decision tree model which uses entropy to
select an ordering of feature values to consider in the concept rule description to predict CO2 levels in air. Since a decision tree generates decision rules as its model, the researchers have
used it to understand the attributes that were most influential in
predicting the air quality class. The decision tree they employed has
a confidence factor of 0.25. They used theWeka implementation
of the learning algorithms.
Fig. 4: Decision Tree Algorithm
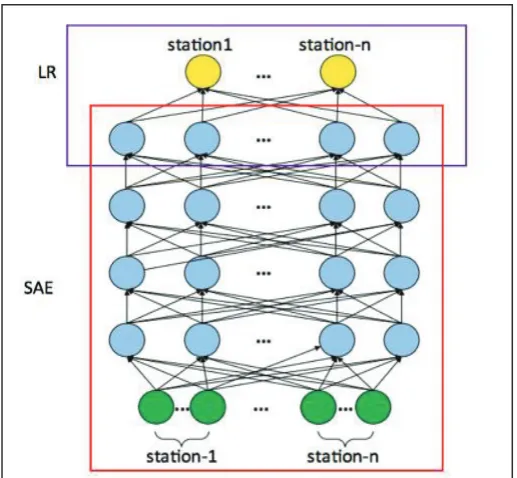
E. Least Squares Support Vector Machine Model
W. F. Ip et al., in use Least Squares Support Vector Machines (LS-SVM) as shown in fig. 5. It is a novel type of machine learning
technique based on statistical learning theory used for regression and time series prediction which overcomes most of the drawbacks of MLP and has been reported to show promising results. In this
paper, researchers report a forecasting model based on LS-SVM
for the meteorological and pollution data that shows promising results.
Fig. 5: AP-LSSVM Modeling for Air Quality Prediction Using LS-SVM
Fig. 6: AP-LSSVM Modeling for Air Quality Prediction
V. Conclusion
With the advancement of IoT infrastructures and machine learning
techniques, real-time air quality monitor and evaluation is desirable
for future smart cities. This paper reports our recent literature study, reviews and compares current research work on air quality evaluation based on big data analytics, machine learning models and techniques. Finally, it highlights some observations on future research issues, challenges, and needs.
References
[1] Q. Feng,“Improving Neural Network Prediction Accuracy for PM10 Individual Air Quality Index Pollution Levels”, Environmental Engineering Science, 30(12), pp. 725–732, 2013.
[2] P. Hájek, V. Olej,“Prediction of Air Quality Indices by Neural Networks and Fuzzy Inference Systems – The Case of Pardubice Microregion”, International Conference on Engineering Applications of Neural Networks (EANN), pp.
[3] L. Wang, Y.P. Bai,“Research on Prediction of Air Quality Index Based on NARX and SVM”, Applied Mechanics and
Materials, (Volumes 602-605), pp. 3580- 3584, 2014.
[4] BC. Liu, et al,“Urban air quality forecasting based on
multi-dimensional collaborative Support Vector Regression (SVR): A case study of Beijing-TianjinShijiazhuang”, PLOS,
2017.
[5] H. Wang, et al.,“Air Quality Index Forecast Based on Fuzzy Time Series Models”, Journal of Residuals Science & Technology, Vol. 13, No. 5, 2016.
[6] N. Loya, et al.,“Forecast of Air Quality Based on Ozone by Decision Trees and Neural Networks”, Mexican International
Conference on Artificial Intelligence (MICAI), pp. 97-106,
2012.
[7] E. G. Dragomir,“Air Quality Index Prediction using K-Nearest Neighbor Technique”, BULETINUL Universităţii Petrol – Gaze din Ploieşti, Vol. LXII No. 1/2010 103 – 108, 2010.
[8] C. M. Bishop, “Neural Networks for Pattern Recognition”, Oxford, 1995.
[9] C. Zhang, et al.,“Understanding deep learning requires
rethinking generalization”, ICLR, 2017
[10] M.A. Nielsen,“Neural Network and Deep learning”, Determination Press, 2015.
Mr. Praveen SR Konduri working as Asst. professor in computer science Engineering in MRCET(Malla Reddy College of Engineering and Technology), Hyderabad, Telangana. He is having 3 years of teaching experience and 1.5 year in Industry Experience as Hardware Engineer in HCL Infosystems. He is pursuing Ph D at KL University. He received M. Tech Computer science Engineering
from GITAM University. He is one of the active member in
Co-Curricular Activities. Presented many paper presentations and participated in many events. His area of interest include data mining, data warehousing, database system.
Mr. B Ravi Kumar working as Assistant Professor in Department of Basic Science and Humanities in Vignan’s Institute Of Engineering For Women (View), Kapujaggarajupeta, Vadlapudi (Post), Visakhapatnam. Research Scholar, Adikavi Nannayya University, Rajahmundry, A.P, India. He completed M.Sc and M.Tech(Computer Science) from Andhra University, Visakhapatnam, India and M.Phil from Sri Venkateswara University, Tirupati, India and Pursuing Ph.D from Adikavi Nannayya University, Rajahmundry, A.P, India.
Mr. Mahendra Narla working as Associate Professor in Computer Science Engineering in Miracle Educational Society, Visakhapatnam, Andhra Pradesh. He is having 11 years of teaching experience and 5 years Industrial Experience as Software Developer. He is pursuing PhD at Sathyabama Univeristy. He received M.Tech Computer science engineeringfrom Andhra University.
He is one of the active members in Co-Curricular Activities.
Presented many paper presentations and participated in many events. His area of interest include Computer Networks, Database
Management Systems, Artificial Intelligence, Cryptography and
![Table 2: AQI Classification [3]](https://thumb-us.123doks.com/thumbv2/123dok_us/1329810.1641226/2.595.304.565.195.490/table-aqi-classification.webp)