System Design for Data Registration and Analysis
Ahmad Ali Al-Zubi, PhD
King Saud University, Riyad, KSA
Email: [email protected]
Abstract-- This paper reviews a suggested design for
information system of observational data registration and its analysis, which is usually called Monitoring S ystem (MS ). The data in such systems is often weak or partially structured. Its structure depends on a specific observation and it changes over time. Generally, a data model for monitoring system was developed.
Index Term– Monitoring, Observation, Monitoring System, Real World, Mini-World Object, Parameter.
I. INT RODUCT ION
This paper is organized as follows: section I presents an overview and general design of monitoring systems. Some examples of the real world are explained in section II. The basic concepts of the suggested model are presented in section III. Monitoring Process is explained in section IV. Used Parameters are listed and explained in section V. Project Organization is located in section VI. Section VII contains the description of the Monitoring Operation and the conclusion and references are located in sections VIII & IX.
The dominant data model now is the relational model. Nevertheless, it would be risky to assume that the end user looks at the surrounding world from the viewpoint of the relational model. For each type of activities and for all people communities engaged with these activities , they have their own look at the way how their mini-world is arranged. The main objective of developing a new data models is to bring together the information system, dealing with certain mini-world with the submissions of users about this mini-world. Moreover, if we analyze the current systems that use relational data models we will find they use them mainly for data storage, and a big part of the logic related to the mini-world is outside the competence of the Database Management System (DBMS).
Developing an information system for monitoring a simple mini-world is not difficult – it would be quite enough to use any standard DBMS. The problem is complicated if we want to store observations of many entities of various kinds, taken by different independent users, and store data for later analysis.
The data stored by different users for the same entity may contradict and do not correlate with each other. In this case, the use of DBMS, supporting traditional data models, does not help much to ease the task, since most of these DBMS focused on fixing a single coherent picture of the mini-world. (Especially the approaches to data modeling and classification of data models presented in [1])
Another reason for studying different tasks in this paper is the need for accumulation of information about the observed entities for analysis. Modern information systems, in addition to storing information about the mini-world, they provide users with different tools for data
analysis. In the last decade in the theory of DBMS a new direction has appeared - a Data Warehouse (DWH). A feature of this technology is that away from the usual database, which stores an instance of the mini-world, there is a special place, where from time to time data is transferred and stored. In order to make possible to analyze stored data, according to this technology we need to essentially re-design the warehouse scheme and to store information from the database of corporate systems. In this regard, It would wonderful to organize information in a such way to maximally ease its analysis in On-Line Analytical Processing (OLAP).
There is an attempt in this paper to develop a data model, which would effectively describe the class structure of the mini-worlds oriented on the tasks of monitoring and analysis. The proposed model combines two aspects: • Support for independent views of users on data. • Work with historical data, which naturally follows from the data structure resulting from the independent perspectives of users to this data.
II. REAL WORLD EXAMPLES
To illustrate using specific examples what we will talk about, we have to take a look at several tasks related to the observation of real world objects.
II.1. Medical and Biomedical Centers.
Doctors check patients, receptionist fixes the main data of the patients at there entry: full name, insurance policy, height, weight, pulse, age, HR, blood pressure, complaints and other symptoms. Also it is possible to make analyses and some instrumental checks, in which can be fixed some quantitative and qualitative parameters. Some of these parameters are constants or may be modified very rarely - these parameters are: name, gender, address , patient growth (for adult patients ). These parameters are fixed once at the first visit, other parameters (blood pressure, body temperature) vary strongly from one test to another and require constant monitoring. Some parameters can be fixed from time to time, while others must be recorded regularly. Based on the data resulting from the test, patient may be assigned additional tests. Information must be organized in such way to prevent information redundancy with minimum cost, also to share information access between users with restricted access rights to some of them, to evaluate treatment efficiency, to allow planning for screening and treatment, to allocate risk groups for various diseases, as well as to facilitate effective statistical medical and economic-financial analysis. This paper also justifies the need for developing detailed data models oriented on tasks of monitoring, and describes the
principles on which it should be based
[2]
.II.2. Geological Monitoring.
The main property of geological information is the spatial and temporal data. In addition to the study of complex processes , periodic studies are performed of geological processes and phenomena on permanent locations and some fixed different points in the same region. Different processes have different speed of development; some have stationary background, while others need to be studied with different (up to centuries) periodicity. The results of this research are accumulated into a unified information system for further analysis.
It is clear that in all cases described above there is some set of real-world objects, and also there is a number of observers, who record a certain set of parameters of these objects. The observation it self can also serve as a facility for observation – such as the case of the therapy effectiveness assessment or expert opinions. The whole task is objects monitoring, registration and control of their parameters, study of correlations or other relationships between them, predicting behavior of their dependencies, tracking of critical situations, formulate assessments and make the optimal decisions in current situation.
III. BASIC CONCEPT S OF THE MODEL.
III.1. Project.
It is assumed that there is a set of interrelated tasks or studies, which have a fairly stable set of objects and their properties for study or monitoring, and that the project involves a number of people (users). Project - is the set of all objects and their observations, users and their rights, declared types, etc. The project reflects the opinion of a group of users about any part of the real world. It is anticipated that all events in one project take place in the same timing and for any two events it could be determined which of them happens before, and which after.
III.2. User.
The rights of access to system resources are defined for each user. Each project by default must have one administrator who has all rights and a user, which does not have the permition to perform any operation associated with the administration.
III.3. Sessions.
Sessions - a sequence of user actions, starting from the beginning of the project till its end. In one session, the user can work with only one project. At any moment of time a user can operate only in one session.
III.4. Object.
Distinguishability is the only property of objects. There is a unique identification for each existing object in the project: every object has its own ID, which is assigned to the object during its creation. Once the object was created in the project, it can not be removed.
III.5. Predefined Objects.
Let's assume that in any project there is a set of objects previously defined, that correspond to numbers, strings and other common types of data. While the newly created objects are assigned (regardless of the user) IDs,
IDs are assigned to predefined objects using a sequence of characters.
III.6. Parameter (Attribute).
Each object of the real-world can be assigned a random set of parameters describing its status and behavior. Parameters are what you can measure, monitor and change in the process of research. A set of parameters is defined by the tasks for which the project was created. All the parameters used in the project must be declared. Each object can have, generally speaking, any given parameter in the project. The model has taken into consideration a number of predefined parameters that are defined for all objects. As an example, we can take the "Creation Time", which is automatically registered during any monitoring (See "Operation").
III.7. Value.
During monitoring, values are assigned to a number of parameters of the monitored object. The value is either the object identifier, or the value of some type (predefined object identifier). At any moment of time, value of the object parameter is considered either the request or last value, which was assigned to the parameter before this moment. The set of values of parameters for this object may have a complex structure. Value may be undefined –all undefined parameters for this object have reserved value (or null).
III.8. Imaging.
Each value can be presented (visualized) to the user. This can be done in many ways - for example with a formatted transformation. Growth in meters can be written as 1.5 meters, or +1.50 m, or 0.15e +1 m etc.
III.9. Observation (measuring).
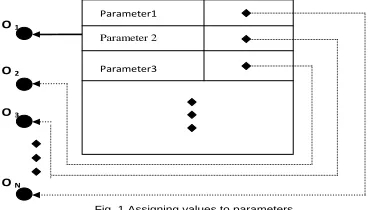
In the real world, we can measure or observe characteristics of any object. For each observation there is a defined number of objects on which it is made. The objects IDs are considered as the values of parameters of an observation. In this sense observation - is simply a relationship between objects, so any link "Parameter - Object - Value" makes sense only in the context of an observation of the object. In order to apply the results of observation, this relationship is also assigned an identifier during its creation, like any other object. Thus, monitoring allows assigning any value to one or more parameters of some objects (Fig. 1). Meaningful parameters and values for the object remain entirely on the conscience of the observer.
O N
O 1
O 3
O 2
Parameter1
Parameter 2
Parameter3
Components represented on the fig. are as follows:
observation - rectangle, objects - black circles, the
relationship between observation and the object s on
which it is made - bold arrow, the relationship between
parameters and their values - dotted line.
III.10. State.
The object is characterized at any moment by its state, which is the set of all its parameters registered during the most recent observations of the object before this
moment. We will call this state as the actual at this
moment, or just actual. Actual state in the current moment
will be called current state. Let's assume that the object
was not yet created (no observation on this object yet), it is in undefined state, in which all its parameters have undefined values. For any two states of an object, you can always define such state that precedes both of these states
(or coincides with one of them). Terminal State T - is the
state in which all parameters of the object have value T. If
all parameters of the object have the value T, it is
equivalent to its destruction. This does not mean that nothing with this object can be done. The object may be identified in some previous state and its parameters can be changed. (See fig. 2. gray circles denote states of the object, arrows - shift from one state to another).
S1 S2
S3 S2’
T
Fig. 2 Object transition from one state to another
IV. MONIT ORING
Monitoring can be either a new, which means, it is being performed on a newly created object, and then the object is identified by the fact that it is created; or monitoring may be repeated, that is performed on objects, which had previously been monitored, and then the object or objects are selected on the basis of previously fixed parameters, either through explicit identification of the object.
During every initial monitoring at least two objects occur: the one which is being monitored and monitoring itself which can be considered as an object.
Creating a new monitoring may be triggered in several ways:
• In the case of relevant activity of the user.
• According to the schedule - periodically or at the
scheduled time.
• When a condition is fulfilled.
• As a reaction on some events - such as a side effect
during performing some request or performing another monitoring.
• Possible combination of the above events: for
example, some monitoring done by a certain time after some event.
The source of information for monitoring can be entered data by the user or data that is automatically entered into computer system by some channel.
During every monitoring the object state changes. The initial state is determined by defining one or more monitoring that corresponds to this object. If instead of current state (the last state) accept some other state for the initial, so this causes a "split" of state.
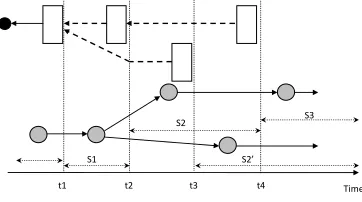
Fig. 3 shows the relationship between observations
and states (si) for a single object. Rectangles indicate
monitoring; a dashed line with an arrow denotes monitorings that define the initial states for monitorings.
Starting from moment t3, along with the state s2 occurs s2'
and the object state splits
[3]
.For any monitoring must be defined a standard form for input and output, which is based on standard transformation procedure of values into images for all parameters. But in describing the monitoring type there is a set of input forms (skins) for interactive work and output forms (records), which are defined by user for this type of monitoring.
S3
S2’ S2
S1 t2
t1 t3 t4 Time
Fig. 3 Relationship between Observations and States
The constraints imposed on the object state can be described in the type of monitoring. These constraints define the expected behavior of the object with this type of monitoring:
Admissibility of this or that state.
Admissibility of transition from one state to another
and the relationship between observations.
The state admissibility defines the relationship between the parameters of the object fixed in this monitoring. For example, systolic blood pressure can never be less than the diastolic. To be sure, such constraints are the property of a particular type of monitoring, not of an object. Thus, despite the fact that in one survey a constraint may present on the age, in another type of survey, it may be removed or modified.
In order to describe the behavior of the object in the dynamics, we must be able to determine the conditions of the transition from one state to another.
One monitoring may be performed before others, so that their observational data can be integrated into the received state. In this case, in determining the type of observation, you can specify the types of observations that must be held before this observation.
So, in describing monitoring type can also be identified such characteristics as :
Definition of input and output .
Constraints identification.
Identification associated with monitoring being
performed.
Access rights
V. PARAMET ERS
All parameters must be initially described. If they are described in the project, so they can be considered as global parameters and can be used in any monitoring. They can also be described only in the type of monitoring. In this case, it is located in the monitorings of this type and
can not be used elsewhere.
While the value of the parameter is considered as an object identifier, there is a number of important
particular cases:
1. Parameter is the physical characteristic of the object. 2. Parameter is the assessment of properties
3. Parameter represents some of the complex
characteristics of the object (for example, a picture or description).
4. Value of the Parameter is calculated depending on
values of other parameters and time.
5. Parameter is a multivalued that is its value is a set of values.
Calculated parameter can be performed only once during the observation, or every time you request it. In this regard, the parameters can be divided into st atic and dynamic.
Static parameters are calculated for the observation once using a query. In the future, their value does not change. Such requests must deliver value and their performance should not cause side effects. This means that the procedure for calculating the static parameter can not initiate other observations or require activation by the user. Static parameters also can not depend on the dynamic ones.
If a parameter is defined as static, the system saves its value, not the formula through which it was calculated.
Dynamic parameter is calculated each time you require this parameter. The value of dynamic parameter is the query. Or it may simply be a reference to the current value of a parameter of another object.
A real case, when a set of objects and their observations are divided into groups – regarding some conditions or randomly. These groups may differ in objects nature, parameters values, or expected behavior. In any case, the objects are divided into categories, classes, groups. Usually this is can be done either by type-design or additional tools, such as index files, placement of objects in different files, combining objects in sets, collections, etc.
Typically, according to conditions of
membership, objects are divided into manual and automatic groups. This is because the presence of objects in the group can be controlled manually or automatically. In the first case, membership of the object in the group is managed by the user using special tools. In the second case, the presence of an object in the group is determined automatically based on conditions defined through object
parameters. In fact, the automatic group is a request, returning not one but a set of objects.
In order to continue operate with a group of objects as one unit, it is necessary to input a corresponding data type.
Thus, as a simple data types defined for the parameters values it is necessary to consider the following:
• The number with dimensionality, or without it
enumerable type.
• Objects.
• Standard types, including text, image, sound, etc.
• Request.
• Set of values of a particular type.
The value type of parameter should define the range of values for this parameter. Accordingly, we can have the following tow definitions for the value types:
• Predicate - a procedure that defines to which type the
value of parameter belong.
• Transfer - a list of valid values for parameter when
performing an observation, parameter can be initialized. The following options can be possible:
• Initialize with given values.
• Initialize with the value, which this parameter has at
the current state.
Usually, for any data obtained in any observation, there is a period of time during which this data is considered as a valid data. After this period, the accuracy of this data decreases. For example, the patient's date of birth is valid always, the ID number is also valid for decades, address and phone number - over the years, the weight likely does not change for one - two months. Blood pressure can change every day. Therefore, when describing parameter we can set "expiration time", i.e. time, after which you need to re-observe this parameter. Until this moment, parameter in the current state is defined by the data obtained in the last observation. After this moment, the value of the parameter in the current state becomes uncertain. Thus, the end of the fixed expiration time is equivalent to performance of a new observation, in which
this parameter is assigned a new value.
Thus, in parameter describing we should take care of the following characteristics:
• Value type.
• Initialization.
• Procedure, defining the action to be taken when
assigning a value to parameter.
• Standard format or another procedure to obtain the
image.
• Mandatory / optional.
• Access rights.
• Period during which data is valid.
VI. PROJECT ORGANIZAT ION.
VI.1. Objects Classification.
Although over any object we can run any observation, it is better to set in advance the observation type for particular objects . The object class is determined by the group of observation types that can normally be run on and by the acceptable states for the object of this class. The same object can participate in observations that have been identified in several classes (i.e. belongs to multiple classes).
In addition to the restrictions specified in the observation type it may also be required to identify additional restrictions for objects belonging to a certain class.
For the observations, a timetable can be set in the description of the object class according to which they can automatically run at fixed time.
VI.2 Project.
A set of parameters can be defined to characterize the whole external environment. For systems related to financial management, such parameters may be, for example, the minimum monthly salary, the currencies exchange rate and others. Besides, there are some parameters associated with the lifecycle of specific project, such as date of its establishment, us ed resources, etc. Therefore, the project should be considered as an object - in this case, its parameters can be set using normal mechanisms. Totally parameters of the project can be used as triggers that determine the start of an event.
Trigger is a global definition of some procedure applicable to the rerunning observation after first run and also to set the values of any parameters of the project. Trigger Mechanism (Alerter) and stored procedures are widely used in DBMS, so you should not dwell on this issue. Triggers, procedures and functions that are specific to this project, are also considered as a characteristic of the whole project.
A dimensions table must be predefined for each project, which contains information about measurement basic units (such as systems SI, SGS) and rules of conversion between them. Users of the project can later add their own units.
VI.3 Users and access rights.
Obviously, many users can use the system at the same time. Therefore, there should be a distinction between the rights of these users access to the objects and the results of the observations. In the event of a conflict in values of the parameters relating to one object, these conflicts should be reflected on the system. Corresponding states of the object should be equal.
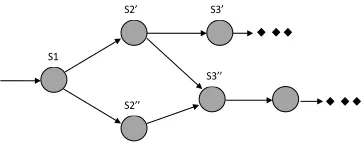
Suppose, there are two registered users in the system
- u' and u'', which perform repeated observation on object
o, which is currently in state s1 (Fig.4). After performing
these observations, for user u' object is visible in state s2’,
and for user u'' is visible in state s2''. If one user u' gives
access on his observation to another user u'', then u'' in
the repeated observation can see two equal actual states of the object. He can use one of them as a source for repeated observation - in this case, he will continue to see two states
of object - either merges these two states into one state, by averaging the values of different parameters, or by selecting the appropriate parameters of each state. Circles on the fig. denote the states of the object; arrows indicate transition from one state to another.
S1
S2’ S3’
S2’’
S3’’
Fig. 4 Conflicting values of parameters
As already mentioned, splitting states can appear not only in assigning access rights, but also in a very simple way; when repeating observation of the object an earlier state to be taken as an initial one instead of taking the current state. One example of such a situation is the analysis of "what if" when one parameter can be assigned a number of different values as a hypothesis and needed to find the optimal of these values.
It is a natural desire to build an Access Rights Management System (ARMS) using the same principles and mechanisms that are used to manage other data. The problem of access is well developed in the theory of DBMS. The complexity of the proposed approach is that not only the current state of the objects is available, but also their history. Thus, it is necessary to manage the access rights according to the time, not only to space. Ideally, the users do not even need to know that his access right to the object is limited or was restricted.
In general, access rights are defined by the following aspects:
• Type: grant or restrict.
• Operation: through which the data can be accessed.
• Data: object, observation, parameters.
• Who owns the rights: a particular user or role, including predefined roles "user" and "administrator" . • Time interval: over which the rights are valid –
always, or for a certain period of time.
VII. OPERAT ION
Detailed design and description language for describing and manipulating data is not among the targets of this work. Therefore, below is only a brief overview of the
major operations required to work with objects,
observations and conditions, which should be supported in the model.
Let's assume that there are a number of operational objects, which are compared with objects, observations and other components of the model, in particular, identified object index and state descriptor. Index contains object identifier or observation identifier. It can also describe a group of objects. The state descriptor contains pointers to the object and to all observations over this object.
• Creation of objects and observations
• Search.
• Navigation.
• Administration, statistics, utilities, other operations .
Let us consider in more details the first three.
VII.1. Creating a new observation.
It is enough to consider only the operations associated with the creation of a new observation, because the removal and change is reflected through the creation of
new observations.
Registration of the parameters is a long time process, so some operation is required to denote the start and end of this process. The start and the end of the observation form operator brackets that correspond to the start and end of the transaction.
Operation "start of the observation” fixes the moment that defines the time of this observation, which will be used in all calculations of time-dependent parameters.
Operation "end of observation" defines the moment when all parameters are fixed that the user supplies in the observation.
Running an observation consists of several phases:
• Conduct all preliminary observations.
• Initialization.
• Setting parameters values.
• Calculation of static parameters.
• Installation of triggers identified in the project.
• Run observations that directly initiated by current
observation.
VII.2. Search.
In operation "search" is required to specify the following information:
• What is needed to find - the object or observation.
• Whether the full state or the only observation of this
type is used.
• Time interval over which all states are being tested or
only current state.
• Search conditions.
If the time interval is not specified, then the current state of the object is being tested. If the interval is specified, it is required additionally to clarify in the condition the time it must be performed. There are several possible options [4]:
• Condition is met in all states at the specified time
interval.
• Condition is met in at least one state.
• Condition is not met in any state.
Thus, each logical expression in the condition of search can be an indication on the number of preliminary observations on the current interval satisfying this condition.
There may be more complex search conditions. If A and B - the logical expression, we can specify the causal relationships, for example, "If A, then B before or after the A"
In addition, it is possible to directly specify the time interval, together with each simple condition: (A in the interval T1) and (B in the interval T2).
VII.3. Navigation.
Object transition from one state to another is due to time and at a time such a transition can perform only one object. Therefore the navigation task in the space of states and observations is limited to movement in directionally oriented graph.
If there is an object index, then the provided operation should:
• Retrieve the current or the first object state, as
well as its first and last observation.
• Choose the state of the object satisfying some
condition.
• Retrieve the set of all states of the object that is
actual in any moment or time interval.
• Retrieve the set of identifiers of all observations,
performed over a some time interval for a given object.
If there is an observation index, then the provided operation should:
• Retrieve the object identifier to which the current
observation belongs for a certain time interval.
Obviously, in any operation of the navigation a condition can be set on the basis of which the required states and objects are retrieved.
VIII. CONCLUSION
This article mainly is focused on data presentation in monitoring systems. However, the raised questions in this paper are also often raised in other fields of DBMS theory, such as the organization temporal databases, data warehouse, data shared access, etc. the suggested solutions are helpful in the field of monitoring systems and I strongly hope that they will be also helpful in the above
listed fields.
REFERENCES
[1] Klein H.K., Hirschheim R.A. A Comparative Framework of
Data Modeling Paradigms and Approaches. T he Computer Journal, Vol.30, N 1, 2003.
[2] Markov B.L. Data organization in monitoring systems. High
performance computing systems and microprocessors. Moscow, 2000.
[3] IDEF1X. "FIPS Integration Definition for Information Modelling
(IDEF1X)," Federal Information Processing Standards Publication 184, Computer Systems Laboratory, National Institute of Standards and T echnology. 1993.
[4] Manna Z., Pnueli A. T he T emporal Logic of Reactive and