A STUDY ON IMPACT OF ADVERTISEMENT
ON BUYING BEHAVIOUR OF CONSUMERS IN
MANNARGUDI TOWN
Dr.S.MADASAMY
Assistant Professor
P.G. & Research Department of Commerce,
M.R.Government Arts College, Mannargudi, Tamil Nadu, India.
Abstract
In today’s business world, marketing processes are based on the interaction between a business and
the consumers. Advertising has been considered as a popular management tool for dealing with the highly
rapid technological changes and also the marketing changes in today’s competitive markets, and this
management tool refers to the re-analysis and re-designs of tasks and also processes inside and outside the
organization. Advertising industry is a social institution born to full fill the human needs to require and
send information about availability of product, brand and service. Of late, there has also been a widespread
feeling that advertising is a form of communication, meant to exploit the consumers. Further it is often
criticized as being generally profit oriented and business houses are label as marketing shared who are
developing a perfecting technique to defraud customers through misleading advertisement. The objective of
advertisement is to study the Impact of advertisement on buying behavior. It is found that there is a
relationship between age of the respondents and level of impact of advertisement and there is a relationship
between income and satisfaction with advertised product at the time of using.
Keywords: Advertising Industry, Consumers, Brand Loyalty, Buying Behavior.
1. INTRODUCTION
Today advertisement plays an important role in persuading customers to purchase products and services. On the other hand, the expenses of advertisement in comparisons of other activities in most companies are very remarkable. In the present days every company wants to achieve the highest market share. For this purpose, every company use different ways to attract customers of different segments of the market and the best way to become market leader. In this challenging environment a company should promote its products in such a way that more and more customers get interest in its products.
Marketing is the performance of all activities necessary for ascertaining the needs and wants of markets, planning the product availability, effective transfer of ownership of products, providing for their physical distribution and facilitating the entire marketing process. It is a shape within which price making forces operated in which exchanges of titles tend to be accomplished by the actual movement of goods affected.
1.1 IMPACT OF ADVERTISING
In every country, advertising has proved to be engine of progress, an essential input for economic change and vital aid for social usage. Advertising is an existing dynamic and truly challenging enterprise. It changes with changing markets, changing life styles, changing methods of distribution and changing pattern of consumption. Advertising is an institution performing essential social and economic facilities. Indeed, advertising is multidimensional and different segments of the society are indicted with their individual views.
Advertising industry is a social institution born to full fill the human needs to require and send information about availability of product, brand and service. Advertising does two jobs for business. One is the competitive job to make clear customer. And the equally important is the indispensable job of creating consumers. The derive to have a new product in the first place. Moreover, it is a creative art, a science, a business, an economic as well as social institution. Of late, there has also been a widespread feeling that advertising is a form of communication, meant to exploit the consumers. Further it is often criticized as being generally profit oriented and business houses are label as marketing shared who are developing a perfecting technique to defraud customers through misleading advertisement.
2. OBJECTIVES OF THE STUDY
The present study has framed the following objectives. They are 1. To study the demographic profile of consumers.
2. To study the impact of advertisement on buying behavior. 3. To offer suggestions based on the study.
3. HYPOTHESES OF THE STUDY
The researcher has framed the following null hypothesis. They are
1. There is no significant relationship between age of the respondents and level of impact of advertisement.
2. There is no significant relationship between age and satisfaction with advertised product at the time of using.
3. There is no significant relationship between income of the respondent and satisfaction with advertised product at the time of using.
4. There is no significant relationship between education level of the respondents and opinion about advertisement.
5. There is no significant relationship between education level of the respondents and influence of attracting factors in advertisement.
4. PERIOD OF THE STUDY
The period of study consists of four months from February 2016 to April 2016. 5. AREA OF THE STUDY
A study of this nature required the selection of a suitable place. Therefore, Mannargudi town was selected for the study, since the researcher belongs to this area. Moreover, the advertisement has an impact among the people in Mannargudi town.
6. REVIEW OF LITERATURE
Antoine Lamarre et al., (2012)1 in their article titled “Mobile Marketing and Consumer Behaviour Current Research Trend” have explained that innovative businesses that have successfully integrated e-commerce in their marketing activities now see mobile marketing as the next exciting opportunity that will enable them to reach their consumers through a new communication channel.
Abdul Ghafoor et al., (2014)2 in their article titled “Effects of Advertisement on Consumer’s Buying
Behaviour with References to FMCGs in Southern Punjab-Pakistan” have describes that the factors likewise necessity of advertisement, pleasure of advertisement, dominance of advertisement, brand recall advertisement, and stimulation of advertisement. These are very helpful in creating and shifting the consumer’s buying behavior that is a very positive sign for the advertising and marketing companies. Our results also proved the model of the study which reveal that advertisements have significant impact on the consumers ‘buying behavior and widen their choices. This study will definitely be proved helpful for the marketing and advertising companies to promote their products in the light of our empirical results.
Sathya and Indirajith (2014)3 in their article titled “A Study on Purchase Behavior of Consumer Durable Goods with Special Reference to Tiruvarur District” have revealed that the consumer buying preferences are rapidly changing and moving towards high-end technology products with acculturation. Products which were once considered luxury items have become a necessity because of the changing lifestyle and rising income levels. With growth in disposable incomes, the demand for high-end products such as television, washing machine, refrigerator, and air conditioners has increased considerably. It is also facilitated by the easy availability of finance and prevalence of nuclear families. Increasing in demand for consumer durable in the market the fall in prices as Indian consumers are continue to attach a high degree of importance to value for money.
Ashish Kumar and Poonam Gupta (2015)4 in their article titled “To Analyze Consumer Buying Behaviour and Preferences in the Home Appliances Market of Hailer” have concluded that all marketing starts with the consumer. So, consumer is very important to a marketer. Consumer decides what to purchase, for whom to purchase, why to purchase, from where to purchase, and how much to purchase. In order to become a successful marketer, he must know the liking or disliking of the customers. The study of the consumer preference not only focuses on how and why consumers make buying decision, but also focuses on how and why consumers make choice of the goods they buy and their evaluation of these goods after use.
Kalaiselvi and Muruganandam (2015)5 in their article titled “An Analysis on Purchase Behaviour
white goods markets, reputed companies like Godrej, Videocon, Kelvinator, BPL, Voltas and Allwyn had the major market share. After liberalization, many foreign players like Whirlpool, LG, Sony, Samsung, IFB, and Aiwa had entered into the market. This opening created a dramatic change in the white goods market.
Samar Fatima and Samreen Lodhi (2015)6 in their article titled “Impact of Advertisement on Buying Behaviors of the consumers: Study of Cosmetic Industry in Karachi City” have exposed that Advertisement helps the company to create the awareness in their customers and ingredients the advertisements shape the perception of the customers either in the positive or in a negative way. People can perceive the quality of the products by gathering the information which they usually get through advertisements. The perception of the quality, awareness of the product and consumer opinion drives the consumer buying decision. Study critically evaluates these factors which shape the buying behavior and provides the deep insights towards the role of advertisements shaping the consumer behavior.
7. METHODOLOGY
In the present study, primary data were collected through questionnaire from 115 college students in Mannai Rajagopalasamy Government Arts College, Mannargudi, the data was collected and analyzed through statistical tools for fulfillment of the objective of the study.
7.1. Sources of Data Primary data
Secondary data 7.1.1. Primary Data
The primary data is collected by preparing a questionnaire. A well framed questionnaire is used for collection of data.
7.1.2. Secondary Data
The secondary data were collected from published sources such as standard text books, magazines and internets.
8. SAMPLE DESIGN
In the present study a convenient sampling was adopted to identify the sample respondents from a total population. The sample size is 115 respondents were selected from various department students. To collect accurate and true information, the researcher meets college students and explained the research problem and got their consent for responding to the questionnaire.
9. TOOLS AND TECHNIQUES
The following tools and techniques have been applied by the researcher to analysis the primary data
Simple percentage analysis
Chi-Square test
10. SOCIO-ECONOMIC PROFILE OF THE RESPONDENTS
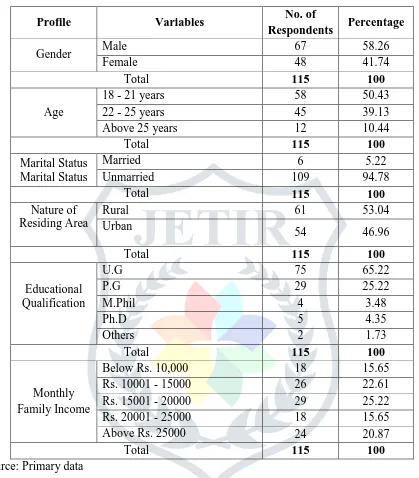
The Table.1 shows the socio-economic profile of the respondents.
Table.1. Socio Economic Profile of the Respondents
Profile Variables No. of
Respondents Percentage
Gender Male 67 58.26 Female 48 41.74 Total 115 100
Age
18 - 21 years 58 50.43 22 - 25 years 45 39.13 Above 25 years 12 10.44 Total 115 100
Marital Status Marital Status
Married 6 5.22 Unmarried 109 94.78
Total 115 100
Nature of Residing Area
Rural 61 53.04 Urban
54 46.96 Total 115 100
Educational Qualification
U.G 75 65.22 P.G 29 25.22 M.Phil 4 3.48 Ph.D 5 4.35 Others 2 1.73 Total 115 100
Monthly Family Income
Below Rs. 10,000 18 15.65 Rs. 10001 - 15000 26 22.61 Rs. 15001 - 20000 29 25.22 Rs. 20001 - 25000 18 15.65 Above Rs. 25000 24 20.87 Total 115 100
Source: Primary data
Table 1 depicts that out of 115 respondents 58.26 per cent (67) of the respondents are male, 50.43 per cent
(58) of the respondents are having in the age group of 18-21 years, 94.78 per cent (109) of the respondents are
unmarried, 53.04 per cent (61) of the respondents were lived in rural area, 65.22 per cent (75) of the respondents are
in their educational qualification is under graduate students, 25.22 per cent (29) of the respondents monthly family
LEVEL OF IMPACT OF ADVERTISEMENT
The impact of advertisement is an important one in buying behaviour here the table defines the level of impact of advertisement.
Table 2 Level of Impact of Advertisement
Level of Impact of Advertisement
No. of
Respondents Percentage
Highly influencing 60 52.17 Moderate influencing 44 38.26 Not influencing 11 9.57
Total 115 100 Source: Primary data
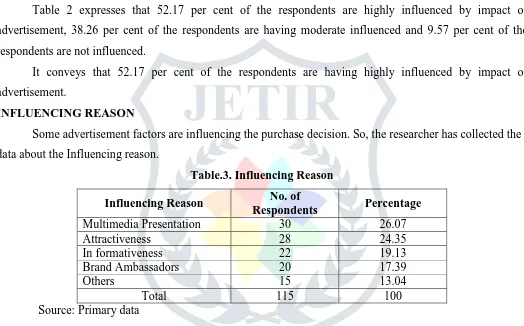
Table 2 expresses that 52.17 per cent of the respondents are highly influenced by impact of advertisement, 38.26 per cent of the respondents are having moderate influenced and 9.57 per cent of the respondents are not influenced.
It conveys that 52.17 per cent of the respondents are having highly influenced by impact of advertisement.
INFLUENCING REASON
Some advertisement factors are influencing the purchase decision. So, the researcher has collected the data about the Influencing reason.
Table.3. Influencing Reason
Influencing Reason No. of
Respondents Percentage
Multimedia Presentation 30 26.07 Attractiveness 28 24.35 In formativeness 22 19.13 Brand Ambassadors 20 17.39 Others 15 13.04 Total 115 100 Source: Primary data
The above Table 3 shows that out of 115 respondents 26.07 per cent of the respondents are influenced by multimedia presentation, 24.35 per cent of the respondents are influenced by attractiveness, 19.13 per cent of the respondents are influenced by In formativeness, 17.39 per cent of the respondents are influenced by brand ambassadors and the remaining 13.04 per cent of the respondents were influenced by other reasons.
It is inferred that 26.07 per cent of the respondents are influenced by multimedia presentation.
SATISFACTION OF ADVERTISED PRODUCT AT ITS USAGE
Satisfaction is most important in every aspect. So, the researcher has collected the data about the satisfaction. Here the Table.4 defines that the satisfaction of users.
Table.4. Satisfied with Advertised Product at Time of Using
Satisfied with Advertised Product
No. of
Respondents Percentage
Table 4 demonstrates that 60.87 per cent of the respondents are satisfied with the advertised product at the time of using, 39.13 per cent respondents are not satisfied with advertised product at the time of using.
It expounds that 60.87 per cent of the respondents are satisfied with the advertised product at the time of using.
INFLUENCE OF ADVERTISEMENTS OVER BUYING BEHAVIOUR
Advertisement has the power to influence the consumer buying behaviour. So, the researcher has collected the data about the advertisement influencing level.
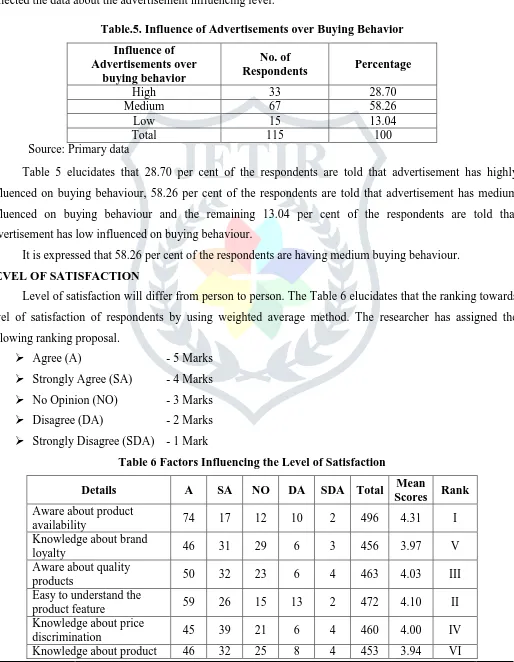
Table.5. Influence of Advertisements over Buying Behavior
Influence of Advertisements over
buying behavior
No. of
Respondents Percentage
High 33 28.70 Medium 67 58.26 Low 15 13.04 Total 115 100 Source: Primary data
Table 5 elucidates that 28.70 per cent of the respondents are told that advertisement has highly influenced on buying behaviour, 58.26 per cent of the respondents are told that advertisement has medium influenced on buying behaviour and the remaining 13.04 per cent of the respondents are told that advertisement has low influenced on buying behaviour.
It is expressed that 58.26 per cent of the respondents are having medium buying behaviour.
LEVEL OF SATISFACTION
Level of satisfaction will differ from person to person. The Table 6 elucidates that the ranking towards level of satisfaction of respondents by using weighted average method. The researcher has assigned the following ranking proposal.
Agree (A) - 5 Marks
Strongly Agree (SA) - 4 Marks
No Opinion (NO) - 3 Marks
Disagree (DA) - 2 Marks
Strongly Disagree (SDA) - 1 Mark
Table 6 Factors Influencing the Level of Satisfaction
Details A SA NO DA SDA Total Mean
Scores Rank
Aware about product
availability 74 17 12 10 2 496 4.31 I Knowledge about brand
loyalty 46 31 29 6 3 456 3.97 V Aware about quality
products 50 32 23 6 4 463 4.03 III Easy to understand the
product feature 59 26 15 13 2 472 4.10 II Knowledge about price
offers or gifts
Easy to compare with
competitive product 46 29 28 8 4 450 3.91 VII Aware about sales network 36 26 39 10 4 425 3.70 IX Gaining more knowledge
about the product 51 23 24 10 7 446 3.88 VIII Source: Primary data
Table 6 highlights that the factors influencing the level of satisfaction of aware about product availability got first rank, easy to understand the product feature got second rank, aware abut quality products got third rank, knowledge about price discrimination got fourth rank, knowledge about brand loyalty got fifth rank, knowledge about product offers or gifts got sixth rank, easy to compare with competitive product got seventh rank, gaining more knowledge about the product got eighth rank and aware about sales network got ninth rank.
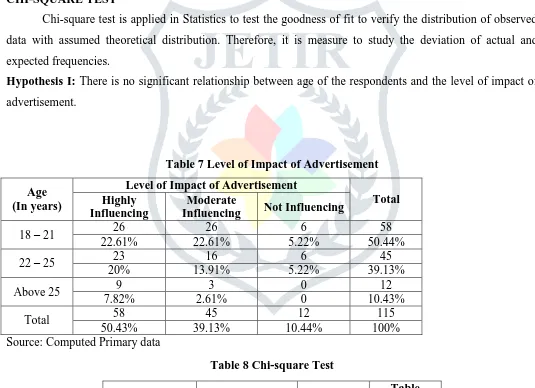
CHI-SQUARE TEST
Chi-square test is applied in Statistics to test the goodness of fit to verify the distribution of observed data with assumed theoretical distribution. Therefore, it is measure to study the deviation of actual and expected frequencies.
Hypothesis I: There is no significant relationship between age of the respondents and the level of impact of advertisement.
Table 7 Level of Impact of Advertisement
Age (In years)
Level of Impact of Advertisement
Total Highly
Influencing
Moderate
Influencing Not Influencing
18 – 21 26 26 6 58 22.61% 22.61% 5.22% 50.44% 22 – 25 23 16 6 45
20% 13.91% 5.22% 39.13% Above 25 9 3 0 12
7.82% 2.61% 0 10.43% Total 58 45 12 115
50.43% 39.13% 10.44% 100% Source: Computed Primary data
Table 8 Chi-square Test
Calculated Value df Table Value
Chi-Square tests 4.66 4 9.49
Table 8 illustrates that the calculated value is (4.66) less than the table value (9.49). The null hypothesis is
accepted. Hence, it is concluded that there is no significant relationship between age of the respondents and level of
impact of advertisement.
Hypothesis II:There is no significant relationship between age and satisfaction with advertised product at the time of
Table 9 Satisfaction with Advertised Product at the Time of Usage
Age Satisfied with Advertised
Product at the Time of Using Total
18-21 Years 35 23 58
30.43% 20% 50.43%
22-25 Years 27 18 45
23.48% 15.65% 39.13%
Above 25 Years 8 4 12
6.96% 3.48% 10.44% Total 70 45 115
60.87% 39.13% 100% Source: Computed Primary data
Table 10 Chi-square Test
Calculated Value df Table Value
Chi-Square tests 0.19 2 5.99
Table 10 elucidates that the calculated value is (0.19) less than the table value (5.99). The null hypothesis is accepted. Hence, it is concluded that there is no significant relationship between age and satisfaction with advertised product at the time of using.
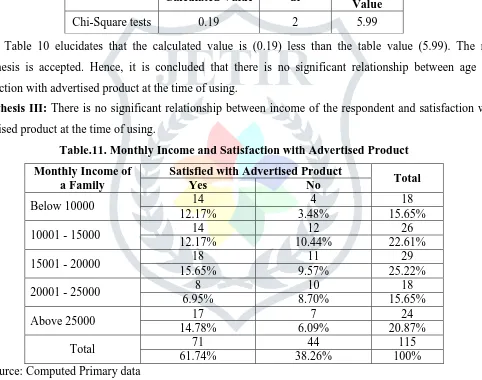
Hypothesis III: There is no significant relationship between income of the respondent and satisfaction with advertised product at the time of using.
Table.11. Monthly Income and Satisfaction with Advertised Product
Monthly Income of a Family
Satisfied with Advertised Product
Total
Yes No
Below 10000 14 4 18 12.17% 3.48% 15.65% 10001 - 15000 14 12 26
12.17% 10.44% 22.61% 15001 - 20000 18 11 29
15.65% 9.57% 25.22% 20001 - 25000 8 10 18
6.95% 8.70% 15.65% Above 25000 17 7 24
14.78% 6.09% 20.87% Total 71 44 115
61.74% 38.26% 100% Source: Computed Primary data
Table 12 Chi-square Test
Calculated Value df Table Value
Chi-Square tests 5.77 4 9.49
Table 12 expounds that the calculated value is (5.77) less than the table value (9.49). The null hypothesis is accepted. Hence, it is concluded that there is no significant relationship between income and satisfaction with advertised product at the time of using.
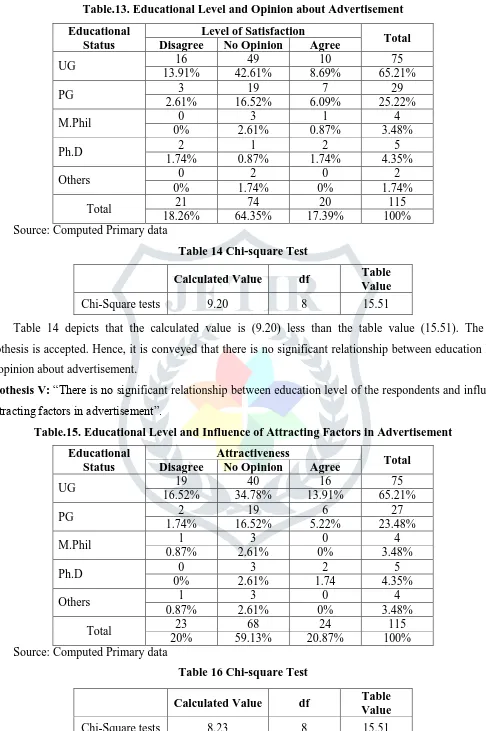
Table.13. Educational Level and Opinion about Advertisement
Educational Status
Level of Satisfaction
Total Disagree No Opinion Agree
UG 16 49 10 75 13.91% 42.61% 8.69% 65.21% PG 3 19 7 29
2.61% 16.52% 6.09% 25.22% M.Phil 0 3 1 4
0% 2.61% 0.87% 3.48% Ph.D 2 1 2 5
1.74% 0.87% 1.74% 4.35% Others 0 2 0 2
0% 1.74% 0% 1.74% Total 21 74 20 115
18.26% 64.35% 17.39% 100% Source: Computed Primary data
Table 14 Chi-square Test
Calculated Value df Table Value
Chi-Square tests 9.20 8 15.51
Table 14 depicts that the calculated value is (9.20) less than the table value (15.51). The null hypothesis is accepted. Hence, it is conveyed that there is no significant relationship between education level and opinion about advertisement.
Hypothesis V: “There is no significant relationship between education level of the respondents and influence of attracting factors in advertisement”.
Table.15. Educational Level and Influence of Attracting Factors in Advertisement
Educational Status
Attractiveness
Total Disagree No Opinion Agree
UG 19 40 16 75 16.52% 34.78% 13.91% 65.21% PG 2 19 6 27
1.74% 16.52% 5.22% 23.48% M.Phil 1 3 0 4
0.87% 2.61% 0% 3.48% Ph.D 0 3 2 5
0% 2.61% 1.74 4.35% Others 1 3 0 4
0.87% 2.61% 0% 3.48% Total 23 68 24 115
20% 59.13% 20.87% 100% Source: Computed Primary data
Table 16 Chi-square Test
Calculated Value df Table Value
Table 16 shows that the calculated value is (8.23) less than the table value (15.51). The null hypothesis is accepted. Hence, it is inferred that there is no significant relationship between education level of the respondents and influence of attracting factors in advertisement.
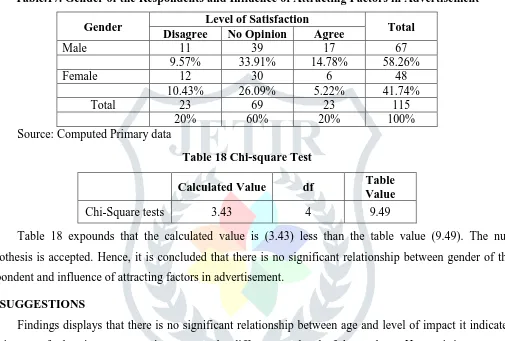
Hypothesis VI: There is no significant relationship between gender of the respondent and influence of attracting factors in advertisement.
Table.17. Gender of the Respondents and Influence of Attracting Factors in Advertisement
Gender Level of Satisfaction Total
Disagree No Opinion Agree
Male 11 39 17 67 9.57% 33.91% 14.78% 58.26% Female 12 30 6 48
10.43% 26.09% 5.22% 41.74% Total 23 69 23 115
20% 60% 20% 100% Source: Computed Primary data
Table 18 Chi-square Test
Calculated Value df Table Value
Chi-Square tests 3.43 4 9.49
Table 18 expounds that the calculated value is (3.43) less than the table value (9.49). The null hypothesis is accepted. Hence, it is concluded that there is no significant relationship between gender of the respondent and influence of attracting factors in advertisement.
11. SUGGESTIONS
Findings displays that there is no significant relationship between age and level of impact it indicates that impact of advertisements remains same at the different age level of the students. Hence, it is suggested that one good advertisement is enough to influence consumers in their age group.
It is found that advertisement only discloses the advertisement good features of the products and since the product is not physically available the advertisement can also give some drawbacks of the products. It will help the consumer is better decision making.
It is suggested that promotional schemes should be often given, as consumers are ready to move on to other brands.
More product information should be given in the website regarding the product. Since physical feel of the product is not available.
12. CONCLUSION
consumers. The advertising should be genuine, correct and serve the informational needs of the consumers. The companies should use attractive and informative content to create the awareness in the consumers and they should not rely on the advertisement for changing the perception of the consumers instead they should use new ways of sales promotion or other mediums for changing the perception of the people. It will be easy for any company to change the buying behaviour of consumer by creating awareness and building strong perception in the mind of their customers.
REFERENCES
1. Antoine Lamarre, Simon Galarneau and Harold Boeck, “Mobile Marketing and Consumer Behaviour Current Research Trend”, International Journal of Latest Trends Computing, Vol. 3, No. 1, pp. 1-9, 2012.
2. Abdul Ghafoor, Awan Muhammad Ismail, Captain Fauzia and Majeed Farisa Ghazal, “Effects of Advertisement on Consumer’s Buying Behaviour with References to FMCGs in Southern Punjab-Pakistan”, Journal of Marketing and Consumer Research, Vol. 19, pp. 22-30, 2014.
3. P. Sathya and R. Indirajith, “A Study on Purchase Behavior of Consumer Durable Goods with Special Reference to Tiruvarur District”, International Journal of Scientific Research and Management, Vol. 6, No. 2, pp. 100-107, 2014.
4. Ashish Kumar and Poonam Gupta, “To Analyze Consumer Buying Behaviour and Preferences in the Home Appliances Market of Hailer”, International Journal of Engineering and Technical Research, Vol. 3, No. 4, pp. 132-140, 2015.
5. K.T. Kalaiselvi and D. Muruganandam, “An Analysis on Purchase Behaviour towards Selected White Goods”, Asia Pacific Journal of Research, Vol.1, No. 23, pp. 80-90, 2015.
6. Samar Fatima and Samreen Lodhi, “Impact of Advertisement on Buying Behaviors of the consumers: Study of Cosmetic Industry in Karachi City”, Journal of Marketing and Consumer Research, Vol. 19, pp. 22-30, 2015.
7. Seema Johar, “To Study the Consumer Decision Making Behavior to Purchase of Durable Goods”,