A Soil Gas Radon Survey to Determine Fault at
Southern Part of Rajabasa Geothermal Field,
Lampung Indonesia
Nandi Haerudin, Wahyudi, Suprajitno Munadi, Wiwit Suryanto
Abstract-- A soil gas survey for radon was carry out at the southern part of Rajabasa geothermal field, Lampung Indonesia. S urvey area included 5.25 km2 and choosed 56
measurement point that was range 250 - 350 m spacing distance. The Radon concentration was measured by S cintrex Radon detector RDA 200. The result of radon soil gas survey performed high radon concentration in the three manifestations wich was included survey area; those are 123 cpm in Gunung Botak hot spring, 145 cpm Kunjir fumarole and 76 cpm Bulakan (Cugung) fumarole. Three manifestation connected by two fault that were the fist went from Gunung Botak tended west-southwest to east-northeast direction through Kunjir and the other went from south-southwest to north-northeast accros the fist line to Bulakan fumarole.
Index Term-- geothermal field, Radon, soil gas survey.
I. INTRODUCTION
The presence of geothermal manifestations were controlled by structures that were formed in the fracture area, both as the surface and buried faults. Meteoric water entered to the earth through recharged area, then if it contact with the hot igneous rocks at depth caused the temperature increas ing to be a hot fluid. It would rise to the surface through the process of convection because of higher temperature and lighter mass. If the fluid is running up and got the high porosity area with impermeable layer lied on upper part, then it accumulated as a geothermal reservoir. The fluid in the reservoir could rise to the surface if there found permeable zones such as faults, fractures or uncomportmity. Fault is a structure that plays an important role in the transfer of geothermal fluid from the reservoir to the surface [1]. So, a permeable zone alike fault to be important to study geothermal field.
Nandi Haerudin
Department of Geophysics Engineering, Faculty of Engineering, Lampung University, Lampung, Indonesia.
Student of Department of Physiscs, Faculty of Mathematics and Natural Science, Gadjah Mada University, Yogyakarta, Indonesia.
nandithea@yahoo.com, nandithea@unila.ac.id Wahyudi
Department of Physiscs, Faculty of Mathematics and Natural Science, Gadjah Mada University, Yogyakarta, Indonesia
pwahyudi2002@yahoo.com Suprajitno Munadi
Institution Of Oil and Gas (LEMIGAS), Ministry of Energy and Mineral Resource Republic Indonesia
smunadi@yahoo.com, suprajitnom@lemigas.esdm.go.id Wiwit suryanto
Radon method is cheap, accurate and easy method to detect the presence of permeable zone in the geothermal field. This method measure the radon radioactivity counting as a parameter to determine the characteristics of study area. Radon method originally used in mineral exploration techniques, especially uranium (238-U). It is the main source of radon (222-Rn). The utility of radon as an indicator of the hidden uranium deposits have been quite widely carriy out.
Measurements of radioactivity radon was used in the exploration of geothermal areas adopted from mineral exploration techniques. The anomalous radon concentrations can be observed in the active fault zone because it could provide a conduit for its enrichment and upward migration as in [2]-[ 3]-[4]. Radon method is mostly used as a device geochemical methods (Geochemistry tools). It began to be popularized in 1984 [5]. The research that using radon gas for geothermal exploration has been carried out by [6] in Mexico to find the source of geothermal energy, and then it was conducted for soil gas radon observation in Las Pailas geothermal area, Costarika [7]. Radon method has been also successful as an effective way to detect hidden faults as in [1].Then Reference [8] stated that the radon method carried out the geochemical and radon study in Arus and Bogoria geothermal areas to identify permeable zones. Furthermore, a qualitative analysis of counts of radon in the some geothermal prospects in Mexico was done as in [9]. This method mixed with geoelectric methods for determine fault or fracture zone. Reference [10] stated that In Indonesia, the soil gas radon has been made for hydrocarbon exploration for the fist and has successfully predicted the possibility of a hydrocarbon-containing regions that have or have not been exploited. Previously, this method has been done in some places e.g. China and Mongolia, Ontario, Canada and England [11]-[12]-[13]. Meanwhile, the radon method for geothermal exploration in Indonesia just has been done in Ungaran geothermal fieild central java as a geochemical tools by [14].
The aim of this study is determining of fault that conect and control three manifestations in the southern part of the Rajabasa geothermal area by radon survey.
II. GEOLOGY SETTING
Sukamandi, Maja, and Gunung Botak, also the large blowing fumarole/solfatara especially on Simpur (Kedaton), Kunjir (Way Merak) and Bulakan (Cugung). The eruptions of Rajabasa is not historically recorded and never shown the eruption, not an explotion nor an effution.
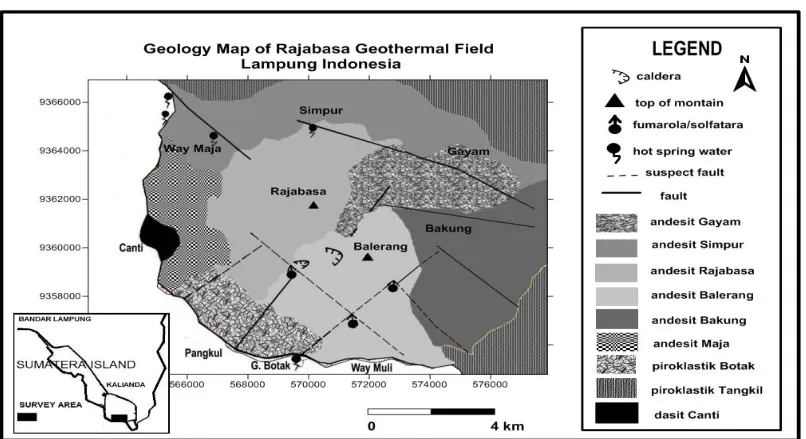
Base on the Geomorphology, the Rajabasa volcanism began with contruction period of pre-Rajabasa composite that was followed by crush period of the cone to shape the pre-Rajabasa caldera. From the pre-pre-Rajabasa caldera depression, The present Rajabasa volcano appeared along with cone of flank eruption. It considered as the second crush period [15] Some preliminary researchs relating to the exploration of Rajabasa geothermal prospects area have been done innitially by [16] but it was processed manually and unpublished. They mapped the geology of Rajabasa volcano relating to the structure and geological hazards that could occur in this region. The result of study is a geological map of Rajabasa volcano (Fig. 2) and the conclusion exposed that there were not existence geological hazards related to volcanology aspect. They also stated that Bulakan area was suspected as the heat source of the Rajabasa geothermal system. Geological mapping based on the structure of volcanic rocks and geological events was developed in that area as in [17].
The structure pattern developing in this complex area was influenced by regional structures such as Lampung Fault which closely associated to sliding of the Semangko fault. Reference [18] showed a preliminary investigation by the geochemical and geophysical resistivity method in manifestations zone of Rajabasa geothermal prospect. The results showed that the hot springs water tends sulfate type except Kalianda and Maja (bicarbonate type) and Gunung Botak (chloride type). By this result, source of geothermal tends to southern part. The Geoelectric measurements conducted in Sukamandi and Simpur geothermal manifestations at northern Rajabasa in squence year to located geothermal reservoir as in [19]-[20]. It founded a dispersion pattern of low anomalous at 450 m depth, but it is
too shalow for geothermal reservoir’s location. It could be ground water aquifer. Geothermal reservoir temperature was estimated by geotermometer Na-K is 212.08 oC and has a potential power about 12.5 MW/km2 including the midle level of reservoir. Reference [21] claimed that they conducted a study to investigate geomagnet for describing of the fault system. This study not cover the entire area of geothermal prospect Rajabasa. The data were dominantly taken in the northern Rajabasa volcano while in the southern were very less and almost nil. Beside that, the geological reference is the regional geology, not detil geological reference. Then the same data proceed to determine the magnetic permeability of the geothermal reservoir system by [22]. The geomagnetic research covered entire area of Rajabasa geothermal was carried out in 2011 and 2012 [23]-[24]. It result the 3D model of Rajabasa reservoir.
Fig. 1. Study Area in Lampung Province Map (inset Sumatera I sland)
Radon Migration Mechanism in Subsurface
The migration of radon from subsurface is divided into two main mechanisms i.e. diffusion and convection. These mechanisms determined a distance of radon atom that moved before undergoing radioactive decay.
Diffusion Processes
Diffusion is the mechanism of radon release from mineral grains due to differences in the concentration of the substance; radon moves from areas whose a greater concentration in to lower concentration areas. Difusional Movement is one of the major mechanisms of radon release from mineral grains (emanation), which is caused by a concentration gradient. Diffusion essentially occurs where the radon relatively moves to the fluid in the rock. The Diffusion coefficient depends on parameters such as porosity, permeability and fluid content of various media. Radon gas that was formed from radium decaying would escape from the minerals rock , then diffuses in the crevices of rocks and soil formed part of the soil gas. Radon gas which was in the near earth's surface would escape into the atmosphere and to be part of the air, so that radon gas to be tenuous near surface because it seemly always pumped out into the air and there was a gradient density of radon gas. Radon gas which is closer to the earth's surface tenuous than below depth which is originally the radon gas come from. Thus, the general diffusion of radon gas will occur continuously from depth of subsurface to the earth's surface.
Convection Process
Convection is transport mecanism fluid (liquid or gas) to move and "bring" a radon. According to [25], 222-Rn element can not be taken from the depth to the surface only by diffusion alone, but also be done by the convective motion in the fluid carrier, so that 222-Rn can carry information about the geological environment that lies in the depths up to the surface. Convective transport mechanism should be highlighted because that can be used to explain how radon can migrate at a significant distance. This migration in the subsurface can be considered to have lateral and vertical components that can be represented by the both lateral flow of groundwater and soil gas vertical motion. An important concept of convection introduced by [26] which stated that radon brought to the surface by convection. A generated convection cells by subsurface temperature gradient (either in water gas or soil gas) caused the hot fluid move up and cold fluid converserly move down. This is because the hot fluid has a lighter mass/density than cold fluid. Movement of soil gas was induced and enhanced by heating result in density declining. It is also dependent on temperature and soil permeability, which determined how far radon can be transported. Reference [27] considered for the case of a thermal gradient "normal" 30 °C/km that result a vertical distance convection through 100 m can be reached for air or water in the sand (hydraulic conductivity, K > 3 x 10⁻⁷ /cm2) and as far as 300 m for K > 3. 10-8/cm2 that could apply to sand and soil and high permeability sandstone within range for basal permeability (10-5 to 10-9/cm2).
They also concluded that in higher areas permeability than
Reference [28] stated that radon was transported by convective fluid could detectable over 100 m distance, as long as the velocity fluid is higher than 100 m per day (0.12 cm/s).
In depth of the earth of the geothermal area, a fluid derived from meteoric water was contact with magmatic rocks caused fluid heated and reacts (physically or chemically ) with elements in magmatic rocks such as uranium. The hot fluid below the surface moves upward due to a temperature gradient towards the surface whose lower temperature, but the it was trapped in the reservoir due to the impermeable caprock layer. High pressure fluid heated that uranium or radium containing could moved up to the earth's surface through cracks or faults. Because radon is a daugther element produced constantly by Radium through radioactive decay in uranium chain, it can be explained by simply how radon rises to the surface.
Radon as a Exploration Methods
There are three isotopes of radon is often occur in nature i.e. 222-Rn (radon) with a half-life time of 3825 days, 220-Rn (thoron) with a half-life of 54.5 seconds and 219-Rn (actinon) with a half-life of 4 seconds. Radon choosed as an exploration tool because of a suitable half-life and its source in the form of magmatic rocks derived from the decay of 238-U series while thoron decay series derived from thorium.
Radon is a unique element in the chain of radioactive uranium decay wich very different from other radioactive properties. It is able to be detected in very low concentrations. So, this became a basis for the highly sensitive geochemical methods [5]. In addition, there are several other reasons why radon is used as a tracer element as in [9]- [29] :
(i) To represent the thermodynamic activity. It is transported to the surface by geothermal gas in place where the thermodinamic activity is high.
(ii) To indicate active faults and fractures. It moved faster when passing through open fractures or fracture.
(iii) No correction required for the geochemical composition. As a noble gas, it is mixed with no other elements in the field.
(iv) To show recent geothermal activity because the new radon generated every 20 days.
Radon also can be used to refer high permeability and high heat flow areas because it is a noble gas and easily soluble in water. High values of total radon counts on surface will be taken to indicate fracture zones or cracks where the isotopes can migrate to the surface faster.
III. METHOD
The radon concentration was measured with radon detector (RDA-200, Scintrex). Soil gas was circulated through to detector by hand pump, replacing the air in the detection cell. The radon concentration was measured by an alpha-scintillation radon counter with soil gas pump ed directly into a scintillation chamber. When the alpha-particles produced during radon decay impact to the ZnS(Ag) layer in the scintillation counter, an energy pulse is created in the form of photons, measured by a photo -multiplier and a counter. By means of alpha emission, the concentration of radon was calculated from three counts in each sequentially 2 minute.
IV. RESULT
Survey area included 5.25 km2 and choosed 56 observations point with range 250 - 350 m spacing distance. The data covered three manifestation i.e. Gunung Botak, Kunjir and Bulakan (Cugung). Minimum Value of concentration radon is 11 cpm, Maximum is 382 cpm and background is 24 cpm. Survey found the high concentration in manifestation zones that are 76 cpm in Bulakan, 382 cpm western near Bulakan, 145 cpm in Kunjir and 123 cpm in Gunung Botak. Threshold value is calculated using the geometric mean value (average) plus the standard deviation. Standard deviation value obtained 59 cpm. It is used to identify the concentration anomalies within soil gas data [30]. In Bulakan, The value is smaller than 2 other manifestations , but still higher than standard deviation value. That could be caused of the thick clay overburden.
TABEL I
RADON COUNTING IN SOUTHERN P ART OF RAJABASA GEOTHERMAL FIELD
No. Station B G (cpm)
C1 (cpm)
C2 (cpm)
C3 (cpm)
1 RjB 5 36 146 149 125
2 RjB 6 29 115 77 82
3 RjB 8 25 155 99 78
4 RjB 11 31 121 99 83
5 RjB13 37 70 56 55
6 RjB 18 25 219 127 98
7 RjB 1 21 247 185 147
8 RjB 4 25 288 138 123
9 H 31 24 228 111 97
10 H 32 33 259 133 105
11 RjB 3 28 77 70 71
12 H 33 25 49 72 49
13 H34 21 181 125 100
14 H 35 24 151 167 172
15 H 36 23 258 127 188
16 H 38 22 282 141 117
17
H 38
N 20 241 120 281
18 H 37 25 177 202 176
19 KJR 7 41 136 109 107
20 KJR 2 36 220 159 121
21 PMR 3 16 96 75 67
22 PMR 2 20 240 127 86
23 PMR 1 13 140 123 86
24 PMR 5 18 121 70 66
25 PMR 4 24 103 106 57
26 H 43 32 206 144 103
27 H 44 27 204 146 121
28 H 45 26 181 126 138
29 KJR 1 14 254 139 84
30 KJR 8 15 113 71 53
31 PMR 6 22 86 65 63
32 AT 18 133 104 106
33 N 3 B 15 107 76 101
34 N 4 B 13 56 51 59
35 N 5 1 19 239 118 105
36 N 5 B 26 328 425 436
37 KJR 3 43 216 161 217
38 KJR 4 25 179 130 87
39 KJR 5 19 275 145 148
40
KJR
12 27 87 84 81
41 GB 1 22 110 83 87
44 GB 2 30 165 94 82
45 GB 3 22 230 149 198
46 KJR 9 23 159 146 144
47
KJR
10 20 350 144 140
48
H 41
G 19 277 108 184
49 H 32 29 325 151 197
50
KJR
13 23 399 240 197
51 NP 26 247 147 135
52 TP 3 22 235 138 95
53 H 30 26 249 194 131
54 KJR 29 249 183 184
55 KJR T 15 191 186 188
56 H 39 20 240 125 84
BG = Back Ground C1 = fist counting
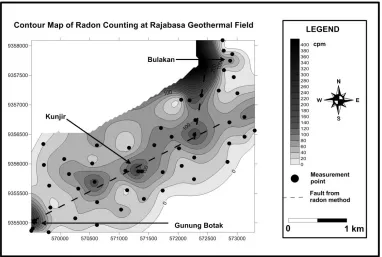
Fig. 3. Contour Map of Radon Concentration of Rajabasa Geothermal Field
The radon and background counting processed using radical sofware (Scintrex) by the following formula:
(1)
where:
RG = Radon Gas
C1’ = C1- cell background
C2’ = C2 - cell background
C3’ = C3 - cell background
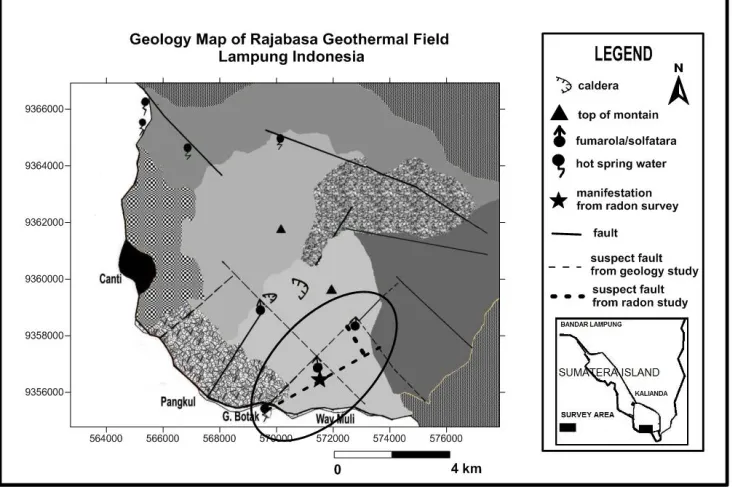
The result displayed as a countur map that showed in fig. 3. The data presented by kontur map that showed high anomaly made two strigth lines. The fist, went from Gunung Botak tended west-southwest to east-northeast direction (N 600 E) through Kunjir and the other went from south-southwest to north-northeast (N 80 E) accros the fist line to Bulakan (Fig. 3). That were define as a fault which connected and controled geothermal manifestation s. The faults passes fluid from the geothermal reservoir in depth to the surface. The value of high radon anomalies may be indicate an enlarged permeability where radon is rapidly migrating to the surface before it decay into daugther products. Faults supports gas transportation because it increase the permeability of the rock and assist geothermal fluid stream up to the surface. Furthermore, the fluid from deep sources migrating upward through the fault depends also on other factors including the level of cracking rock and soil capability to absorb water through the rocks. In order to decribe clearly, it displayed on the 3D contur map (fig. 4). Furthermore, contour map overlayed on the geology map that showed a litle diference fault with geolgy map performed. Budiardjo et. al. performed the suspect fault connected direcly three manifestation in a strigth line, but radon survey result described they connected by two fault. Position of Kunjir manifestation from GPS Garmin’s measurement shifted to south from geology performance
To determine the faults in the geothermal field by ground geological survei is extremely difficult. This is due to the complexity of the forces that shape the structure of the volcano area. The geological analysis expected three manifestations conected with fault that formed a straight line is resulting from the assumption that the manifestations controlled by the presence of faults. Meanwhile the radon released on suface from depth provided clearer description that fault is exist in this area. We would find some difficulty when the areas with high radon concentrations is few (e.g. only two) or more but do not form a line lined. It should be supported by other data or methods to strengthen existence of the fault and its direction in this area. The image from SRTM remote sensing is one wich recomended . It could show the detil structure image and direction trending.
Fig. 4. T he 3D Radon Map of Rajabasa
V. CONCLUSION
76 cpm in Bulakan. Three manifestation connected by two fault that The fist, went from Gunung Botak tended west -southwest to east-northeast direction (N 600 E) through Kunjir and the other went from south-southwest to north-northeast (N 80 E) accros the fist line to BulakanThe fist, went from Gunung Botak tended west-southwest to east-northeast direction (N 600 E) through Kunjir and the other went from south-southwest to north-northeast (N 80 E) accros the fist line to BulakanRemote sensing methode is recomended to construct. By Remote sensing method, we could see overview the image structure on surface and its direction.
ACKNOWLEDGEM ENT
This Research was Supported by Ministry of Energy and Mineral Resource Republic of Indones ia (LEMIGAS).
REFERENCES
[1] Chou Fu, C., Y. F., Walia, V., and Hong Chen, C., 2005. Recconnaissance of soil gas Composition Over the Buried Fault and Fracture Zone in Sourthen T aiwan, Geochemical Journal, vol 39, p. 427-439
[2] Ioannides K., Papachristodoulou C., Stamoulis K., Karamanis D., Pavlides S., hatzipetros A. & Karakala E., 2003. Soil Gas Gadon: A T ool for Exploring Active Fault Zones, Applied Radiation and Isotopes, vol. 59(2 – 3), p. 205 – 213.
[3] Jönsson G., 1995. Radon gas - where from and what to do? Radiation Measurements, vol. 25(1 – 4), p. 537 – 546.
[4] Swakon J., Kozak K., Paszkowski M., Gradzin'ski R., Loskiewicz J., Mazur J., Janik M., Bogacz J., Horwacik T . & Olko P., 2004. Radon Concentration in Soil Gas Around Local Disjunctive T ectonic Zones in The Krakow Area, Journal of Environm ental Radioactivity, vol. 78(2), p. 137 – 149.
[5] Gingrich J.E., 1984. Radon as A Geochemical Exploration T ool. Journal of Geochem ical Exploration, vol. 21, p. 19-39. [6] Lopez A., Gutierrez L., Razo A., & Balcazar M., 1987. Radon
Mapping for location Geothermal energy Source. Nuclear Instrum ents and Methods in Physics Research. vol. 255 P. 426-429 North Hoolland, Amsterdam.
[7] Rodriguez A., T orres Y., Chavarria L., & Molina F., 2008. Soil Gas Radon Measurement as A T ool to Identify Permeabel Zones at Las Pailas Geothermal Area, Costa Rica. Geotherm al Training Proggrame 30th Anniversary workshop Orkustofnun, Grensasvegur 9, Iceland, August 26-27 2008.
[8] Karingithi C. & Wambugu, J., 2010. The Geochemistry of Arus and Bogoria Geothermal Prospect. Proceeding World Geotherm al Congress 2010 Bali, Indonesia.
[9] Balcázar M., López Martínez A., Huerta M., Flores Ruíz J.H., & Peña P., 2011.Use of Environmental Radioactive Isotop es in Geothermal Prospecting. The 17th Pacific Basin Nuclear Conference, Instituto Nacional de Investigaciones Nucleares, Mexico.
[10] Munadi S., Saputro R.A. & Sutarman, 2011. Exploration of natural gas using nuclear radiation. Minerals & Energy Journal vol. 9, no. 1.
[11] Zuhui L., Yujin W., Donrong C., Youming L., Aijun X. & Fuxing J., 1993. Prospecting Oil and Gas Using CR-39 Detector, Nuclear Tracks Radiation Measurem ent, vol. 22, no 1-4, p. 387-392. [12] T ilstey, 1993. Investigation of Soil Gas Radon as a Petroleum
T echnique, Ontario Geological Survey, Open File Report 5876, Ministry of Northern Development and Mines.
[13] Duddrige G.A., 1995. Observations on Soil Gas Variations in the Bovey Basin, Proceeding of the Ussher Society.
[14] Phuong N.K., Harijoko A., Itoi R., Unoki Y., 2012. Water geochemistry and soil gas survey at Ungaran geothermal field, Central Java, Indonesia, Journal of Volcanology and Geotherm al Research, 229-230 (2012) 23 – 33.
[15] Bronto, P. Asmoro, G. Hartono and Sulistiyono, 2012. Evolution of Rajabasa Volcano area, Kalianda, South Lampung Regency. Indonesian Journal of Geology, Vol 7, No. 1 p. 11-25. [16] Budiardjo, B., Masdjuk and Leonardus, A.M. N., 1995. Detailed
geological report of Rajabasa Mountain, Lampung Region. Activity Report. Pertamina Geothermal Division, Indonesia (unpublished). [17] Suswati, Haerani, and Sutawidjaya I.S., 2001. Geological mapping of Rajabasa Volcano South Lampung, Lampung Regency. Activity Report. Directorate of Volcanology and Disaster Mitigation, Bandung Geological Agency (unpublish).
[18] Sulaeman B., Sri Widodo and Soetoyo, 2005. Geothermal investigations Rajabasa Volcano, Lampung, Sub Geothermal Activity Report, Geological Agency Bandung (unpublished). [19] Haerudin, N., S. Rasimeng and Yuliana E., 2008. Geoelectric
methods to determine fluid distribution patterns of regional potential geothermal of Rajabasa Volcano, Kalianda South Lampung, Proceedings of the National Sem inar SATEKS II, University of Lampung..
[20] Haerudin, N., Rasimeng S., and Vina, 2009. Regional analysis of potential geothermal reservoir of Rajabasa by resistivity method and geotermometer, Journal of Basic Science, 2009. Jember University of Malang.
[21] Rasimeng, 2008. Fault analysis of Rajabasa Geothermal Prospects South Lampung for regional data based on total magnetic field anomaly. Journal of Science and Technology Volume 14 No. 1 April 2008, the University of Lampung.
[22] Suharno, Soengkono and A. Hidayatika, 2010. Magnetic analysis to determine the permeability of a geothermal reservoir: case study of the Mt. Rajabasa geothermal system, South Lampung Indonesia. Proceedings World Geothermal Congress 2010 Bali, Indonesia, 25-29 April 2010
[23] Haerudin N., Wahyuningsih, R., Wahyudi, and Suryanto W., 2011. Interpretation of qualitative data to determine total magnetic anomaly overview of regional structure of Rajabasa geothermal subsurface, Proceedings of the National Sem inar on Research, Education and Application of Mathematics, Faculty of Science, Universitas Negri Yogyakarta, 14 May 2011.
[24] Haerudin N., Wahyudi, Suryanto W., and Sarkowi, 2012. T he 3D modeling of magnetic anomaly data for determining Geothermal Reservoir of Rajabasa, Lampung Province, Indonesia. Proceedings of the 12th annual meeting & conference of Indonesian Geothermal Association (INAGA) on 6-8 November, 2012, Bandung. [25] T anner A. B., 1964. Radon migration in the ground, a re-view, in
T he natural radiation environment, Chicago, Univ. of Chicago Press.
[26] Fleischer R. L., Hart H.R., & Mogro-Campero A., 1980. Radon emanation over an ore body: search for long-distance transport of Radon, Nuclear Instrum ents, vol. 2, p. 169-181.
[27] Mogro-Campero A., and Fleishcher R.L., 1977. Subterrestrial fluid convection: A hypothesis for long distance migration of radon within the earth. Earth and Planetary Science Letters, vol. 34, P. 321-325.
[28] Gasparini P. & Mantovani M.S.M., 1978. Radon anomalies and volcanic eruption. J. Volcanol. Geotherm. Res., vol. 3, p. 325-341. [29] Stoker A. K. & Kruger P., 1975. Radon in geothermal reservoir. Second U. N. Sym posium Devel. Use. Geotherm . Resour., San Francisco, 20-29 May, vol 3, p. 1797-1803.
[30] Klusman R.W., 1993. Soil Gas and Related Meth ods for Natural Resource Exploration, John Wiley & Son Ltd, England pp 483.