International Journal of Mechanical & Mechatronics Engineering IJMME-IJENS Vol:18 No:05 56
Abstract—The photovoltaic is the technique used widely in the electricity production in applications of the renewable energy sources, and it is important to have a capacity to evaluate the performance of the systems installed. In this work, a model of simulation to predict the performance of technology system polycrystalline, connected to the grid and working in the weather conditions of the installation location in the city of Meknes (Morocco). The model of the photovoltaic panel proposed gives us a view of the panel parameters as well to validate with the experimental data of a grid connected photovoltaic system of 2 KWp installed at the roof High School of Technology in Meknes under the project “propre.ma”.
Index Term— Experimental study, Polycrystalline, Photovoltaic, Simulink.
I. INTRODUCTION
The production of solar energy is the optimal solution to respond to the growth in demand for energy and preserve our environment in the future generation, which remains a free source, inexhaustible and profitable, in this perspective the research are launched to study the different parameters that influence the energy production of renewable energy technologies including the photovoltaic.
The design of each solar energy system requires knowledge of solar radiation data availability at the interest location .The average distribution of this solar radiation in the day is of fundamental importance in many areas of solar energy. It implements the basis for predicting instantaneous solar radiation from the monthly averages of daily insolation. For locations where data measurements are not available, empirical correlations developed by various investigators can be used to estimate the solar radiation. [1]
The photovoltaic technology is in progress, they are effective, sustainable and environment-friendly; The Photovoltaic module is the interface, which converts the light into electricity [2, 3]. The modeling of this device requires
inevitably taking meteorological data (irradiance and temperature) as variety of entrance; the exit can be the current, the tension, the powerful or another one.
The main objective of this study is to simulate the performance of a PV generator connected to the network. The methods of optimization of the PV generator are of great utility for manufacturers not having detailed information on future sites of implementation of their products. To achieve our goal, we have established a model simple and reliable, with an acceptable accuracy for predicting the performance of a PV generator in the climatic conditions of our site. This model is validated by data obtained from a PV generator installed on the site of Meknes (Latitude: 33.88°Nord, Longitude: 5.53°West) [4, 5].
A. Abbreviations and Acronyms
AC
EAC
Alternating current Net AC energy output
Ht Incident energy in the array plane I Current
Isc Short circuit current
Impp Maximum power point current G Irradiance
G0 Lc
Ls
Reference irradiance Array capture losses System losses PV
P
Photovoltaic Power
P0 Power at standard condition PR Performance ratio
Pmax Maximum power STC
T V
Standard test conditions Temperature of cell Voltage
Voc Open circuit voltage
Vmpp Maximum power point voltage Wp
W
Watt peak Watt
YF Final yield (energy to the grid) YR Reference yield
Modeling and Simulation of a Polycrystalline
Panel Connected to the Network Based on
Experimental Measurements
L. Bouhaki*, R. Saadani, M. Rahmoune, K. Sbai
Laboratory of Advanced Study of Materials and applications (LEM2A), Moulay Ismail Univeristy, Facuty of Science, Superior School of Technology Meknes, Km 5 , Rue Agouray , Meknes, 50040/B.P:
3103-Toulal,Morocco
International Journal of Mechanical & Mechatronics Engineering IJMME-IJENS Vol:18 No:05 57 II. SYSTEM DESIGN
The photovoltaic panel is installed in the south direction and angle of tilt equal to 30° in the floor of the High School of Technology Meknes-Morocco (Figure1) , the polycrystalline silicon module Sun Module Plus SW 255 poly of 156mm × 156mm series-connected with specific characteristics under the test conditions standard (STC) are given in the table above:
TABLE 1:
CHARACTERISTICS OF THE SOLAR WORLD 255 MODULE
Fig. 1. Real image of the Panel poly crystalline installed on the ground of the Superior School of Technology
III. EXPERIMENTAL STUDY
An acquisition system that allows us to recover the irradiation and temperature received at the level of the Panel as well the power produced during the installation with a data record every five minutes for each day, the monitoring of the installation is carried out in the course of the year 2017.
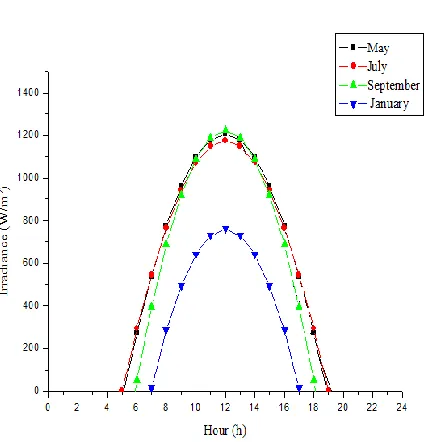
Fig.. 2. Daily irradiation variation
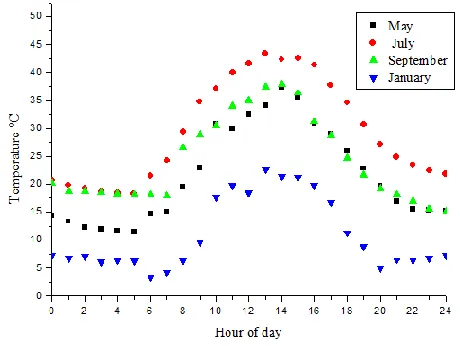
Fig. 3. Daily cell temperature variation
We choose a typical day on the 15th for the four months (May, July, September, January) which represents the four seasons respectively (spring, summer, autumn, winter). Figure 2 shows the evolution of solar irradiation during a day received by the polycrystalline panel installed on the floor of the Higher School of Technology in Meknes, with a tilt of 30° and south orientation. According to the graph, we notice that the profile of the solar irradiation is sinusoidal [6]. The sunrise varies at 5:00am in the morning for May, July and September, and 5h45am for the month of January with a maximum irradiation of 936.15w / m² reaches the month of May. Fig 3 shows the daily variation of the temperature of the cells, which follows the same profiles for the four months with a Temperature, arrives at 45 ° C in July. The solar irradiation and the T depend on the geographical site and its coordinates as well on the day and the hour, and which influences the production of the panels (see simulation fig. 10&11)
A. Performance analysis
For this technology, the performance of the grid-connected PV systems is analyzed using the following parameters [7, 8, 9,10].
Reference yield: The reference yield (YR) represents the ratio of the incident energy in the array plane Ht (kWh/m2) to the array reference irradiance (G0= 1 kW/m²). It expresses an equivalent number of hours at the reference irradiance. It can be written as:
(1)
Final yield: The final yield (YF) of a PV system for a given period (day, month or year) is the net AC energy output (EAC) divided by the rated power output of the installed PV array (P0) at standard test conditions (STC). The YF is an ideal indicator permitting the normalization of the energy produced in accordance with the system size [11, 12]. It can be calculated using Eq. (2):
Pmax 255Wp
Voc 38,0V
Vmpp 30,9V
Isc 8,88A
Impp 8,32A
International Journal of Mechanical & Mechatronics Engineering IJMME-IJENS Vol:18 No:05 58
Month
P
e
rf
o
rm
a
n
c
e
ra
ti
o
(%
)
1 2 3 4 5 6 7 8 9 10 11 12 0.72
0.74 0.76 0.78 0.8 0.82 0.84 0.86
PR
(2)
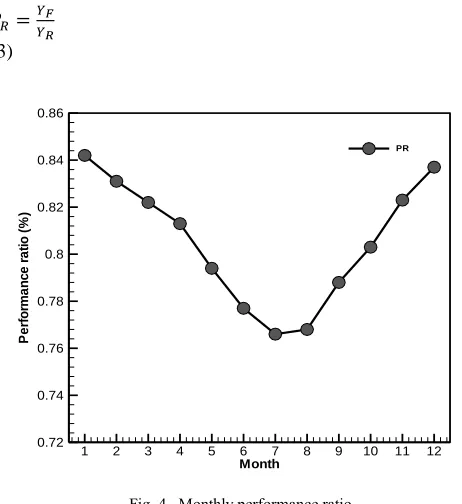
Performance ratio: The performance ratio PR is an indicator that normalizes the energy fed to grid with respect to the received irradiance. Consequently, it is equal to the final yield (YF) divided by the reference yield (YR). The PR gives an idea about the overall effect of losses (array capture losses and system losses) on the system productivity. The PR is given by:
(3)
Fig .4. Monthly performance ratio
Fig. 4 shows the monthly values of the performance ratio of the PV installed technology. It has been observed that the highest performance ratios are identified in January and December months when the available solar radiation is limited (below the yearly average). The performance ratio in January (84.2%) is slightly higher than in December (83.7%) mainly because the power generated in December is lower compared to January.
IV. SIMULATION STUDY
The simulation of the model 255 Wp is as follows, in the standard conditions an irradiation of 1000 W/ m ², spectrum AM 1.5 and of the temperature 25°C.
Fig. 5. Simulink model of solar world SW 255
Fig. 6. Characteristic curves of Polycrystalline
Fig. 6 illustrates the I-V and P-V curve of a solar panel. If no load is connected with solar panel, which is sitting in the sun, an open circuit voltage Voc will be produced, but no current flows.
We identify three essential zones:
- Area I: This is the region where the current remains constant (I=Isc), the generator therefore behaves as a current generator.
- Area II: Corresponds to the elbow of the characteristic, it is the preferred region for performance of the generator.
- Area III: In this area, the voltage varies little in function of the current is almost constant. The generator behaves as a voltage source.
International Journal of Mechanical & Mechatronics Engineering IJMME-IJENS Vol:18 No:05 59
A. Influence of the nature of the sky:
To understand the influence of the nature of the sky on the solar irradiation received by the poly crystalline panel, we propose the model of Liu and Jordan (see table 1).
Table 2:
A,B AND C COEFFICIENTS OF LIU &JORDAN MODEL
We developed within the environment Matlab a program which allows us to compare between three types (clear, average and polluted) by the model of Liu and Jordan, which is the best model for cloudy weather conditions, can also be used to estimate solar radiation on inclined surfaces[13]. so we obtain the following results:
Clear:
Fig. 7. Profile of solar radiation in clear sky
Average:
Fig. 8. Profile of solar radiation in average sky
Polluted:
Fig. 9. Profile of solar radiation in polluted sky
The profile of solar irradiation obtained is sinusoidal [6], the bedtime and sunrise, stay the same for the three configurations, However the maximum solar irradiation varies according to the nature of the sky (see table III)
Table III
THE MAXIMUM SOLAR IRRADIATION RECEIVED AT NOON
May July January September
Clear 1208,61 1174,51 761,31 1224,21
Average 1096,92 1066,65 717,81 1116,99
Polluted 1175,15 1144,81 765,67 1188,06
Nature of sky A B C
Clear 1300 87 6
Average 1230 125 4
Polluted 1200 87 6
International Journal of Mechanical & Mechatronics Engineering IJMME-IJENS Vol:18 No:05 60 The error of the solar irradiation between the average and
clear sky is of the order of 9%, and of 2% between the polluted and clear sky.
B. Influences of environmental and physical parameters
In this part, we make a parametric study, In the first place we maintain the temperature in 25°C and we vary the irradiation (fig. 10 & 12). Secondly, we fix the solar irradiation in 1000w / m ² and we vary the temperature of (10, 25, 40, 55, 70°C) (see Fig.11 & 13)
Fig. 10. Characteristic of the module for several of irradiation
Fig .11. Characteristic of the module for various values of temperature
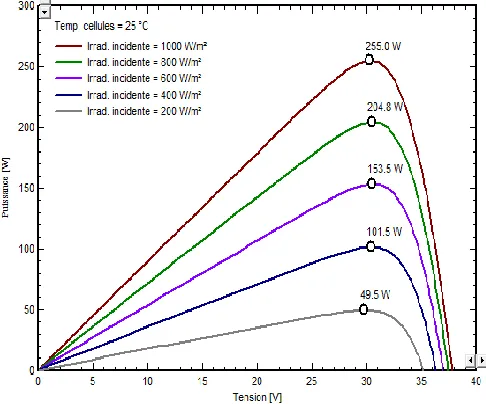
Fig. 12. Characteristic of the power for various values of irradiation
Fig. 13. Characteristic of the power for various values of temperature
Fig. 10 and Fig. 12 represents the effect of the illumination on Voc and Isc in consequence the power and the current and the tension follow the evolution of the irradiation.
International Journal of Mechanical & Mechatronics Engineering IJMME-IJENS Vol:18 No:05 61 We can conclude from this study that to reach an
important power it is enough to have an important illumination and keeping the temperature of acceptable cell.
V. LOSS ANALYSIS OVERVIEW
The losses at the photovoltaic panel are as follows:
Fig. 14. Loss diagram over the whole year
The part of the losses at the photovoltaic system on the solar panel is equal to Lc =0.99kwh/kwp/day which is more important than the system loss (cable, inverter) Ls=0.26kwh/kwp/day since the part on radiation is returned to space (air, pollutions, spraying).
VI. COMPARISON THE RESULTS OF PRODUCTION WITH EXPERIMENTAL AND PVSYST:
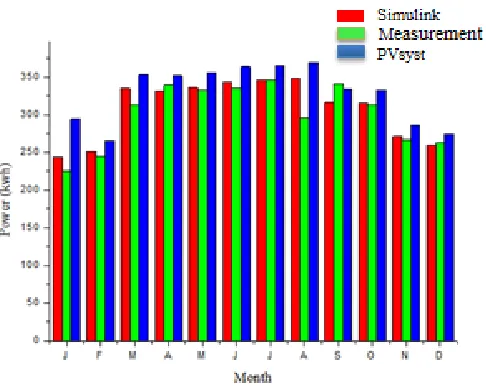
Fig.. 15. Annual production comparison
We compare that the results of the polycrystalline production system with the model created in Matlab Simulink and PVsyst reach a maximum in July 345,669kW and the average error between the real results and Simulink of the order of 2% , this value reaches 9% between real and PVsyst, the variation between the real and Simulink can be explained by the presence of dust or even the bird ejections
VII. CONCLUSION
In this paper, we presented a meteorological data received by our installation during the four months that represent the four seasons; the main findings of this article are the following ones:
The profile of irradiation is sinusoidal, which depends on the nature of the sky as it is shown by the model Liu and Jordan.
The calculation of the performance indicator of our
installation is an order of 80%.
The creation of a model about our installation under the Matlab-Simulink environment which allowed us to study the influence of the various parameters on the production.
The energy produced of the installation depends on the temperature of cell and on the irradiation receipt by the panel The analysis of the losses of the installation which are particularly at the solar collector based on PVsyst software. Comparison of production between PVsyst and MATLAB present an error about 2% between experience and simulation model and the order of 9% between experience and PVsyst.
ACKNOWLEDGEMENT
The authors acknowledge the support provided by the ―Institutde Recherche en Energie Solaire et Energies Nouvelles (IRESEN)‖under the project PROPRE.MA.
REFERENCES
[1] M. Jamil Ahmad and G.N. Tiwari, ‗‗Estimation of Hourly Global Solar Radiation for Composite Climate‘‘,Open Environmental Sciences, 2008, 2, 34-38.
[2] Hosenuzzaman M, Rahim NA, Selvaraj J, Hasanuzzaman M, Malek ABMA, Nahar A. Global prospects, progress, policies, and environmental impact of solar photovoltaic power generation. Renew Sustain Energy Rev 2015;41:284–97. [3] L.A. Dobrzański, A. Drygała, M. Giedroć, M. Macek,
Monocrystalline silicon solar cells applied in photovoltaic system, Journal of Achievements in Materials and Manufacturing Engineering 53/1 (2012) 7-13.
[4] M. EL-YADRI,R. SAADANI,I. ZORKANI and M.RAHMOUNE,‖ ―Propre.Ma‖ project: Modeling and simulation of Grid connected photovoltaic system for Meknes Climate‖
[5] L. Bouhaki, R. Saadani,R. Agounoun, K.Sbai, M.Rahmoune, Experimental study and modeling of three grid-connected photovoltaic technologies of Meknes City Vol. 9, No. 1, March 2018 : 390 – 396
[6] Charis Demoulias. A new simple analytical method for calculating the optimum inverter size in gid-connected PV plants. Electric Power Systems Research 80 (2010) 1197-1204 [7] D. Okello, E.E. van Dyk, F.J. Vorster, Analysis of measured and
simulated performance data of a 3.2 kWp grid-connected PV system in Port Elizabeth,South Africa, Energy Convers. Manage. 100 (2015) 10–15.
International Journal of Mechanical & Mechatronics Engineering IJMME-IJENS Vol:18 No:05 62 [9] E. Kymakis, S. Kalykakis, T.M. Papazoglou, Performance
analysis of a grid connected Photovoltaic Park on the island of Crete, Energy Convers. Manage.50 (3) (2009) 433–438. [10] P.M. Congedo, M. Malvoni, M. Mele, M.G. De Giorgi,
Performance measurements of monocrystalline silicon PV modules in South-eastern Italy, Energy Convers. Manage. 68 (2013) 1–10.
[11] A. Al-Otaibi, A. Al-Qattan, F. Fairouz, A. Al-Mulla, Performance evaluation of photovoltaic systems on Kuwaiti schools‘ rooftop, Energy Convers. Manage.95 (2015) 110–119. [12] Marion B., Adelstein J., Boyle K., Hayden H., Hammond B.,
Fletcher T., et al. (2005, January). Performance parameters for grid-connected PV systems. In Photovoltaic Specialists Conference.
[13] A.Q. Jakhrani, A. K. Othman, A. R. H. Rigit, S. R. Samo, L. P. Ling and R. Baini, Evaluation of Incident Solar Radiation on Inclined Plane by Empirical Models at Kuching, Sarawak, Malaysia.
[14] Orioli A, Gangi A D. A procedure to calculate the five- parameter model of crystalline silicon photovoltaic modules on the basis of the tabular performance data. Applied Energy 2013; 102(): 1160–1177.
[15] H. Can, D. Ickilli, and K. S. Parlak, ―A New Numerical Solution Approach for the RealTime Modeling of Photovoltaic Panels,‖ in Asia-Pacific Power and Energy Engineering Conference (APPEEC), 2012, pp. 1-4.
[16] Bellini A, Bifaretti S, Iacovone V, Cornaro C. Simplified model of a photovoltaic module. Proc. Applied Electronics Conference, 2009.
His area of research includes Thermal Comfort, Building Thermal Simulation, renewable energy and Porous Media
Miloud RAHMOUNE is a full professor at
Moulay Ismail University. He received his Msc. Degree in applied mechanics from Université Montpellier 2 (France) and his Ph.D. degrees in Mechatronics from University Montpellier 2 (France) and University Montpellier 2 (France) and University Hassan II – Mohammedia, in 1993 and 1996 respectively. His research interests include structural Dynamics, active control, and smart materials.
Khalid SBAI is a full professor since 2001 in
Electronics. He received his Msc. Degree in Electronics from Valencienne University (France) in 1996 and his Habilitation in Physics from Moulay
Ismail University in 2008. His research interests include Structural studies, vibrational and electronic properties of carbon nanotubes
Lamiae BOUHAKI is a Ph.D student at
Moulay Ismail University. She received the Engineering Degree Energy at Faculty of Science and Technology. His Ph.D subject is about photovoltaic technologies.
Rachid SAADANI is a full professor at