121
International Journal of Pharmaceutical Sciences and Drug Research
2016; 8(2): 121-127
Research Article
CODEN (USA): IJPSPP
ISSN: 0975-248X
Development and Validation of RP-HPLC Method for Ziprasidone
Hydrochloride Monohydrate
Abhay R. Shirode
*, Arpita P. Nath, Vilasrao J. Kadam
Department of Quality Assurance, Bharati Vidyapeeth’s College of Pharmacy, Navi Mumbai-400 614, Maharashtra, India
ABSTRACT
A new isocratic simple and rapid reverse phase high performance liquid chromatographic (RP-HPLC) method was developed and successively validated for the estimation of ziprasidone hydrochloride monohydrate (ZHM). In this newly developed method chromatographic separation of ZHM was achieved on a Hemochrom-Intertsil C18-5U column (250 × 4.6) mm within a short runtime of 6.5min using mobile phase containing HPLC grade water (pH adjusted to 3.0 with glacial acetic acid AR) and methanol in the ratio of 45:55% v/v. ZHM was estimated with UV detection at 317nm and it was found to be eluted at 4.8min. The above mentioned method was validated as per International Conference on Harmonization (ICH) guidelines with respect to accuracy, precision, linearity, lower limit of detection (LOD) and lower limit of quantitation (LOQ) and robustness. The method was found specific for ZHM and linear (r2 =0.998) over concentrations ranging from 2 to12μg/ml. The
method was found statically accurate (mean recovery = 100.46%), precise with both intra-day and inter-day relative standard deviation (RSD) values < 1.0% and robust. The obtained results concluded that the proposed RP-HPLC method is convenient, reliable and useful in routine analysis for estimation of ZHM in its bulk form and dosage form.
Keywords: Ziprasidone hydrochloride monohydrate (ZHM), RP-HPLC method development and validation,
ICH and recovery.
INTRODUCTION
Reversed-phase high performance liquid chromatography (RP-HPLC) is known by various names such as reversed-phase high pressure liquid chromatography and reversed-phase high speed liquid chromatography. RP-HPLC is an analytical chromatographic technique that is useful for separating ions or molecules that are dissolved in the solvent and includes any chromatographic method that uses a
*Corresponding author: Mr. Abhay R. Shirode,
Department of Quality Assurance, Bharati Vidyapeeth’s College of Pharmacy, C.B.D. Belapur, Navi Mumbai-400 614, Maharashtra, India; Tel.: +91-9819231834; E-mail: [email protected] Received: 08 March, 2016; Accepted: 18 March, 2016
hydrophobic stationary phase. [1] The primary
difference between reversed-phase chromatography (RPC) and normal phase chromatography is that the stationary phase in RPC utilizes a non-polar or hydrophobic surface as opposed to a polar (Si-OH) surface used in normal phase chromatography. [2]
Reversed-phase chromatography employs a polar (aqueous) mobile phase. As a result, hydrophobic molecules in the polar mobile phase tend to adsorb to the hydrophobic stationary phase, and hydrophilic molecules in the mobile phase will pass through the column and are eluted first. [3]
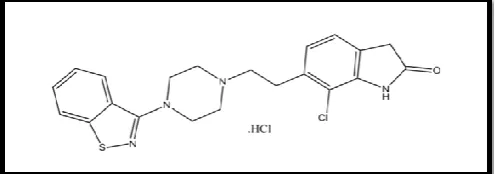
Ziprasidone HCl Monohydrate (ZHM) is an antipsychotic agent that belongs to a group of benz-isothiazoylpiperazine derivative [4] that is chemically
Int. J. Pharm. Sci. Drug Res. March-April, 2016, Vol 8, Issue 2 (121-127)
antipsychotic agents. [5] ZHM is chemically known as
5-[2-[4-(1, 2-benzothiazol-3-yl) piperazin-1-yl] ethyl]-6-chloro-1, 3-dihydroindol-2-one hydrochloride (shown in Figure 1). ZHM is approved by the Food and Drug Administration as a typical second-generation antipsychotic drug [6] used in schizophrenia, mixed
states associated with bipolar disorder and acute agitation. [7] ZHM’s antipsychotic activity is likely due
to a combined antagonistic function at D2 receptors in
the mesolimbic pathways and at 5HT2A receptors in the
frontal cortex. [8] ZHM is available in the market as
capsules of different strengths.
Therapeutic category: Schizophrenia and acute mania The objective of this work was to develop an economic and safe analytical method and validate the same as per the recommendations of ICH guidelines of analytical method validation.
Rationale behind the present investigation is that an economic solvent i.e. water is used for development of the method. Water has following advantages as compared to buffer during Method development and Validation:
Water is universally available
Water is economical
Water prevents precipitation during long term use which is a common disadvantage seen with buffers.
With water back pressure can be prevented
Time taken for preparation of buffers will be saved
Increase in life span of column
The main objective of the work is to introduce with an economical and time saving RP-HPLC method for estimation of ziprasidone from its bulk as well as from its marketed formulation. During literature survey we found the following RP-HPLC methods reported in analytical scientific citations given in Table 1. From Table 1 we can conclude that everywhere buffers are used which can be replaced with HPLC grade water and sharp peak can thus be obtained at flow rate 1ml/min and at short elution time of 4.8min.
Fig. 1: Chemical structure of Ziprasidone hydrochloride Monohydrate (ZHM); Molecular formula: C21H21 ClN4OS.
HCl. H2O.; Molecular weight: 412.936
MATERIALS AND METHODS
Experimental work is generally presented in two sections, namely analytical method development and analytical method validation.
Analytical Method Development Materials and Reagents
Ziprasidone hydrochloride Monohydrate (ZHM) was obtained as generous gift sample from Wockhardt Limited, Mumbai. Fixed dose tablets (Brand Name: Zipsydon) containing 20 mg ZMH were procured from SUN Pharma. HPLC grade methanol, HPLC grade glacial acetic acid was purchased from SD Fine Chemicals, Mumbai.
Instrument
Quantitative HPLC was performed on Agilent 1200 series with Auto Sampler equipped with variable wavelength detector (UV detector). The chromatograms were recorded using EZChrom software.
Selection of wavelength detection
The multiple spectra scan of 10μg/mL of the ZHM were recorded on UV- visible spectrophotometer in the UV range of 200-700nm. From the UV spectrum, wavelength showing maximum absorbance was selected for detection of HPLC method.
Stationary phase
Hemochrom C18-5U reverse phase column (250 × 4.6) mm dimension was used as stationary phase.
Selection of the mobile phase
Selection of appropriate mobile phase is major step in HPLC method development. Mobile phase selection and optimization was done on “trial and error” basis using literature search. 10μg/mL (10 ppm) solution of ZHM was used to study chromatographic behaviour. Chromatographic behaviour of ZHM was studied under various set of chromatographic conditions. Different mobile phases were made by changing mobile phase composition and flow rate. Run time for each mobile phase composition was set as per retention time of analyte obtained for a specific condition. The best suited mobile phase in terms of resolution, shape of chromatographic peak, run time and cost effectiveness was selected for estimation of ZHM.
Optimisation of Chromatographic Conditions
Selection of appropriate mobile phase is major step in HPLC method development. Mobile phase selection and optimization was done on “trial and error” basis using literature survey. Different mobile phases were made by changing mobile phase composition and flow rate. Run time for each mobile phase composition was set as per retention time of analyte obtained for a specific condition. The best suited mobile phase in terms of resolution, shape of chromatographic peak, run time and cost effectiveness was selected for estimation of ZHM.
Preparation of Standard Stock solution of ZHM
Int. J. Pharm. Sci. Drug Res. March-April, 2016, Vol 8, Issue 2 (121-127)
Table 1: Summary including literature review on method development using different mobile phases with its ratio and run time for ZHM S.
No. Title Mobile phase Column Used Ratio Run Time (min) Number Ref. 1. Development and validation of a rapid
RP-HPLC method for the estimation of Ziprasidone hydrochloride monohydrate
in bulk and its capsule dosage forms
Phosphate buffer (pH 3.0 adjusted with orthophosphoric acid )
and methanol
C18 column (150 × 4.6
mm, 3μm) 60:40% v/v 2.750 [4]
2. Development and validation of a rapid RP-HPLC method for the estimation of Ziprasidone hydrochloride monohydrate
in drug substance and its dosage forms
Sodium phosphate monohydrate buffer (pH 6.0 adjusted with orthophosphoric acid)
and Acetonitrile
Sunsil C18 column
(150 × 4.6 mm, 5μm) 40:60% v/v 2.50 [5]
3. A new simple and rapid validated
RP-HPLC method for determination of Ziprasidone in Ziprasidone capsules
Buffer (pH =3.0 adjusted with orthophosphoric
acid) and methanol
Zorbax SB C-8 (50 ×
4.6 mm, 3.5μm) 45:55% v/v 2 [6]
4. Method development and validation for the estimation of Ziprasidone hydrochloride in pellets by RP-HPLC
Methanol: 0.05%v/v ortho-phosphoric acid in
water
Inertsil ODS C18 column (150 × 4.6 mm,
5μm)
90:10%
v/v 3 [7]
5. RP-HPLC method for the estimation of
Ziprasidone 20 mM ammonium acetate buffer (pH adjusted to 3.0 with orthophosphoric acid)
and methanol
Lichrospher RP-18 column (250 × 4.0 mm, 5μm)
30:70%
v/v 4.76 [8]
6. Development and Validation of an
HPLC Method for Determination of Ziprasidone and Its Impurities in
Pharmaceutical Dosage Forms
0.05 M buffer solution, adjusted to pH 2.5 with orthophosphoric acid)
and acetonitrile
Waters Spherisorb® ODS (5.0μm particle
size, 250 × 4.6 mm)
80:20%
v/v 7.9 [9]
7. Development and Validation of Stability Indicating RP-HPLC method for the estimation of Ziprasidone in Capsule
Dosage Form
0.05 M KH2PO4 (pH-3) buffer, Methanol and
Triethanolamine
Hypercil C8 column
(150 × 4.6mm, 5.0 μm) 70:30:0.1% v/v/v 6.204 [10]
Fig. 2: UV Spectrum of 10μg/mL ZHM in methanol solution
Fig. 3: Calibration Curve Indicating Linearity for ZHM
Preparation of Working Standard solutions of ZHM
For the preparation of working Standard solutions of ZHM suitable aliquots of drug solution from standard stock solution were pipetted and transferred into 10 ml volumetric flask and volume was made up with mobile phase to get concentrations in the range of 2 to 12µg/ml respectively.
Preparation of Sample solutions
For the preparation of sample solutions, ten capsules were weighed, opened and the powder was collected and mixed. A quantity equivalent to 20 mg of ZHM was transferred into 10ml volumetric flask, to this flask 5ml of mobile phase was added and the mixture was subjected to sonication for 20 min for complete extraction of drug. After 20 min. the solution was filtered into 10ml of volume flask through 0.45µ membrane filter before injection. The volume was then made up to the mark with mobile phase. Further, it was diluted with methanol to get the concentration of 10μg/ml concentration of ZHM.
Analytical Method Validation
The objective of validation of an analytical procedure is to demonstrate that it is suitable for its intended purpose as stated in ICH guidelines Q2 (R1) on validation of analytical procedures: text and methodology. Parameters to be considered during validation of the developed method as per ICH guidelines are as given in Table 2.
RESULTS AND DISCUSSION Analytical Method Development Selection of wavelength detection
UV spectra of ZHM showed maximum absorbance at a particular wavelength of 317.5nm at concentration of 10μg/mL as shown in Figure 2.
Optimization of Chromatographic Conditions
Int. J. Pharm. Sci. Drug Res. March-April, 2016, Vol 8, Issue 2 (121-127)
Table 2: Summary of analytical method validation parameters with its method to be followed according to ICH guideline Q2 (R1) [11, 12, 13, 14]
S.
No. Parameter Definition Method / Procedure to be followed
1. Specificity
Specificity is the ability to assess unequivocally the analyte in the presence of components which may be expected to be present. Typically these might include impurities, degradants, matrix, etc.
To determine specificity chromatograms were obtained for blank and ZHM
2. Linearity
The linearity of an analytical procedure is its ability (within a given range) to obtain test results which are directly proportional to the concentration (amount) of analyte in the sample.
A linear relationship was evaluated across the range of 2 to 12μg/mL for ZHM. It was obtained by plotting peak area against concentration of standard and finding regression coefficient (r2).
3. Accuracy
The accuracy of an analytical procedure expresses the closeness of agreement between the value which is accepted either as a conventional true value or an accepted reference value and the value found.
Accuracy was assessed using a minimum of 9 determinations over a minimum of 3 concentration levels covering the specified range (e.g. 3 replicates each of 3 concentrations each of the total analytical procedure). In the present work percent recovery was calculated by performing recovery studies in triplicates of three concentration levels viz. 80%, 100%, 120% by adding known amount of standard solution of DMP. These samples were then analysed and the results obtained were compared with expected results.
4. Precision
The precision of an analytical procedure expresses the closeness of agreement (degree of scatter) between a series of measurements obtained from multiple sampling of the same homogeneous sample under the prescribed conditions. Precision may be considered at three levels: repeatability, intermediate precision and reproducibility.
Precision is reported as standard deviation and relative standard deviation (Coefficient of variation) for each type of precision investigated. (Acceptance Criteria -% RSD of low, mid and high should be less than 2%)
5. Repeatability
Repeatability expresses the precision under the same operating conditions over a short interval of time. Repeatability is also termed intra-assay precision.
Repeatability was assessed by using minimum of 9
determinations covering the specified range for the procedure (e.g. 3 replicates each of 3 different concentrations - low, mid and high i.e. 4, 8 and 12μg/mL)
6. Intermediate Precision Intermediate laboratories variations: different days, different precision expresses within-analysts, different equipment, etc.
Intermediate Precision was established to study the effects of random events i.e. days, on the precision of the analytical procedure.
Intra-day and inter-day precision studies were performed by taking 9 determinations of 3 concentrations low, mid and high i.e. 4, 8 and 12μg/mL 3 replicates each, at 3 times in a same day and on 3 different days, respectively.
7.
Limit of Detection
(LOD)
The detection limit of an individual analytical procedure is the lowest amount of analyte in a sample which can be detected but not necessarily quantitated as an exact value.
The values of Limit of Detection (LOD) and Limit of Quantitation (LOQ) were determined based on the standard deviation of the response and the slope of calibration graph. The quantitation was done with the help of following expression,
LOD=3.3×σ/S
LOQ=10×σ/S
σ = Standard deviation of response estimated based on the calibration curve. S = Slope of the calibration curve.
Limit of Quantification
(LOQ)
The quantitation limit of an individual analytical procedure is the lowest amount of analyte in a sample which can be quantitatively determined with suitable precision and accuracy.
8. Robustness
The robustness of an analytical procedure is a measure of its capacity to remain unaffected by small, but deliberate variations in method parameters and provides an indication of its reliability during normal usage.
Robustness was evaluated for proving the reliability of an analytical method with respect to deliberate variations in method parameters. To establish robustness of analytical method following factors were studied
Int. J. Pharm. Sci. Drug Res. March-April, 2016, Vol 8, Issue 2 (121-127)
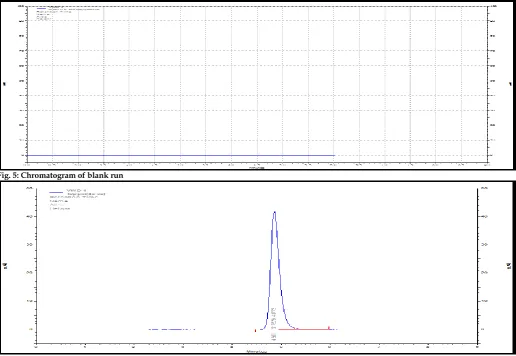
Fig. 5: Chromatogram of blank run
Fig. 6: Chromatogram of 10μg/mL ZHM in mobile phase
Table 3: Mobile phase trials for optimisation at 1 ml/min flow rate Mobile phase used Composition (% v/v) Inference ACN : Water (pH-3 made
up with glacial acetic acid) 50:50 Peak tailing was observed ACN : Water (pH-3 made
up with glacial acetic acid) 30:70 tailing was observed Broad peak with Methanol : Water (pH-3
made up with glacial acetic
acid) 60:40
Peak was eluted very fast i.e. at 2 min Methanol : Water (pH-3
made up with glacial acetic
acid) 50:50 Peak was not sharp
Methanol : Water (pH-3 made up with glacial acetic
acid) 45:55
Desired peak with satisfying RT, sharpness and area
was obtained
Table 4: Chromatographic method development parameters Parameters Specifications
Column Type Hemochrom-Intertsil C18-5U reverse phase column (250 × 4.6) mm dimension
Temperature 25 ± 2°C
Mobile Phase Water (pH 3) & Methanol in 45:55% v/v ratio respectively
Flow Rate 1 ml/min.
Injection volume 50µl
Detection wavelength 317 nm
Retention time (RT) 4.8 min.
Run time 6.5 min.
Column Pressure 130 bar
Different flow rate in the range of 0.5 to 1.5 ml/min and different injection volumes in the range of 20μl to 100μl
were tried. Mobile phase selected was optimised at the composition of Methanol: Water (pH-3 made up with glacial acetic acid) in the ratio of 45:55%v/v. Optimized chromatographic conditions are tabulated in Table 4. Representative chromatogram using these optimised chromatographic conditions mentioned above retained at 4.8 min is shown in Figure 3.
Analytical Method Validation
Validation of the developed method was carried out as per ICH guidelines with respect to parameters such as specificity, linearity, precision, accuracy, robustness, limit of quantification (LOQ) and limit of detection (LOD).
Linearity
The standard curve was observed by preparing six serial dilutions of ZHM using a standard stock solution and dilution were made with mobile phase Methanol: Water (pH 3 made up with glacial acetic acid) in the ratio of 45:55% v/v. Responses were recorded as peak area. The peak areas were plotted against concentrations to obtain the calibration curve. Linear relationship was observed across the range of 2-12μg/mL. Linearity range and linear regression data of calibration plot for ZHM is given in table no.5 and calibration curve is represented in Figure 4.
Specificity
Int. J. Pharm. Sci. Drug Res. March-April, 2016, Vol 8, Issue 2 (121-127)
chromatograms recorded for the blank showed almost no peaks, interfering peak or baseline noise within a retention time range of 4.8min. Chromatogram of blank run and of 10 ppm of ZHM in mobile phase is given Figure 5 and 6.
Precision
Intra-day precision: It was performed at three different
concentration levels low (4μg/mL), mid (8μg/mL) and high (12μg/mL) within the same day at three different times (session 1, 2, 3).
Inter-day precision: It was carried out at same
concentration levels on three consecutive days, using same homogeneous sample. The % RSD values for both intra-day and inter-day precision were found within acceptable limit. Results are presented in Tables 6 and 7 respectively.
LOD and LOQ
Values of LOD and LOQ were calculated using slope of calibration curve. LOD and LOQ values of ZHM for HPLC method are tabulated in Table 8. Determined based on the standard deviation of the response and slope of the calibration curve.
Accuracy
The accuracy of the method was determined on three concentration levels by recovery experiments. Accuracy of the method is reported as present recovery of known added amount of analyte in the sample. The accuracy of the method was established by performing recovery studies in triplicates of three concentration levels viz. 80%, 100%, 120% by adding known amount of ZHM. Results obtained were found to be within acceptable limits as shown in Table 9.
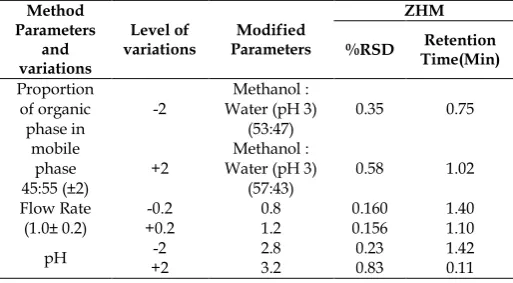
Robustness
Robustness of method was studied by making slight but deliberate changes in chromatographic conditions such as proportion of organic phase in mobile phase
composition and flow rate. Effects of these changes on both the retention time (RT) and peak area were evaluated by calculating the relative standard deviations (%RSD). The results obtained are tabulated in Table 10.
Table 5: Values for linearity
Parameters Result Obtained
Linearity range (μg/mL) 2-12
Correlation coefficient (r2) 0.9986
Slope 43691
Intercept 10842
Table 6: Intra-day precision results ZHM
Inference Level Low Mid High
Concentration
(μg/mL) 4 8 12
Peak Area (mAU)
Session 1 164950 326213 517748
Acceptable %RSD,
hence precise. Session 2 165106 327270 521914
Session 3 165234 327398 523345 Average Peak Area 165097 326960 521002 Standard Deviation 142.229 650.336 2907.74 %RSD 0.086 0.198 0.0558
Table 7: Inter-day precision results ZHM
Inference
Level Low Mid High
Concentration
(μg/mL) 4 8 12
Peak Area (mAU)
Session 1 164950 326213 517748
Acceptable %RSD,
hence precise. Session 2 164026 325310 522152
Session 3 162364 320588 515771 Average Peak Area 163781 324037 503044 Standard Deviation 1310.716 3020.853 3266.52
%RSD 0.800 0.932 0.629
Table 8: Results of LOD and LOQ
Parameters Result
LOD 0.254 μg/mL
LOQ 0.770 μg/mL
Table 9: Recovery studies indicating accuracy on capsule formulation
Drug Percentage Level of recovery (%)
Amount present in extract (μg/mL) Amount added (μg/mL) Total amount (μg/mL) Amount recovered (μg/mL) % recovery Average
% recovery % RSD Inference
ZHM
80 10 8 18 18.44 102.49
100.50
0.0031 Acceptable
recovery Hence accurate.
100 10 10 20 19.90 99.44 0.0032
120 10 12 22 23.83 99.59 0.0032
Table 10: Effect on retention time and response by variation in mobile phase composition and its pH, column temperature and flow rate Method Parameters and variations Level of
variations Parameters Modified
ZHM
%RSD Retention Time(Min) Proportion of organic phase in mobile phase 45:55 (±2)
-2 Water (pH 3) Methanol :
(53:47) 0.35 0.75
+2 Water (pH 3) Methanol :
(57:43) 0.58 1.02
Flow Rate
(1.0± 0.2) +0.2 -0.2 0.8 1.2 0.1600.156 1.401.10
pH +2 -2 2.8 3.2 0.230.83 1.420.11
The proposed RP HPLC method developed for ZHM with UV detection has been statistically validated following the ICH guidelines recommendations and it is successfully found to be specific, precise, accurate and robust. This method is economic as water constitute one among the two mobile phase used. So the mobile phase is simple to prepare and economical. Also as elution time of ZHM was fast i.e. 4.8min; it saves time for analysis and reduces mobile phase consumption. Hence, the developed method can be conveniently used for determining the quality control of ZHM in bulk pharmaceuticals.
ACKNOWLEDGEMENT
Int. J. Pharm. Sci. Drug Res. March-April, 2016, Vol 8, Issue 2 (121-127)
Navi Mumbai for providing all the research facilities to carry out the research work.
REFERENCES
1. Mcnaught AD and Wilkinson A. The “Gold Book”. IUPAC. Compendium of Chemical Technology. 2nd edition, Blackwell Scientific Publications, Oxford, 1997.
2. Mehta A. Principle of Reversed-Phase Chromatography HPLC/UPLC". Pharmaxchange. 2013.
3. Molnár, Horváth C. Reverse-Phase Chromatography of Polar Biological Substances: Separation of Catechol Compounds by High-Performance Liquid Chromatography". Clinical Chemistry 2013; 22 (9): 1497-1502.
4. Chudasama JD, Channabasavaraj KP, Pandya CB, Mani TT. Development and Validation of a rapid RP-HPLC method for the estimation of Ziprasidone hydrochloride monohydrate in bulk and its capsule dosage forms. International Journal of Pharmaceutical Sciences Review and Research 2010; 4(3):193-197.
5. Ramanaiah G, Ramachandran D, Srinivas G, Srilakshmi V, Rao P. Development and Validation of a Rapid RP-HPLC Method for the Estimation of Ziprasidone Hydrochloride Monohydrate in Drug Substance and its Dosage Forms. International Journal of Pharmacy and Pharmaceutical Sciences 2012; 4(2):623-625.
6. Bansal R, Chandrabose K, Hari Narayana Moorthy NS, Singh DP, Singh D, Trivedi P. A New Simple and Rapid Validated RP-HPLC Method for Determination of Ziprasidone in Ziprasidone Capsules. Journal of Saudi Chemical Society. 2012; 1:1-7.
7. Sri. Manikonda M, Bayyavarapu D, Prabahar EA, Ramarao N. Method Development and Validation for the Estimation of Ziprasidone Hydrochloride in Pellets by RP-HPLC. International Journal of Pharmaceutical Research and Novel Sciences 2014; 1(1):53-59.
8. Rao KS, Keshar NK, Choudhury PR, Rao MEB, Pattnaik AK. RP-HPLC method for the estimation of ziprasidone. Inernational Journal of Pharma Medicines & Biological Sciences 2013; 2(1):45-52.
9. Bhaskar, Shrivastava P. Development and Validation of an HPLC Method for Determination of Ziprasidone and its Impurities in Pharmaceutical Dosage Forms. Journal of AOAC International. 2011; 94(3): 1-10.
10. Pavlovic M, Malesevic M. Development and Validation of Stability Indicating RP-HPLC Method for the Estimation of Ziprasidone in Capsule Dosage Form. International Research Journal of Pharmacy 2012; 3(2): 222-225.
11. ICH Harmonised Tripartite Guideline Validation of Analytical Procedures: Text and Methodology Q2 (R1). 12. Shirode AR, Deodhar MS, Maduskar PD, Kadam VJ.
Development and Validation of RP-HPLC Method for Simultaneous Estimation of Metformin Hydrochloride and Sitagliptin Phosphate from Bulk and Combined Dosage Form. International Journal for Pharmaceutical Research Scholars 2014; 3, 1-2.
13. Shirode AR, Deodhar MS, Kadam VJ. RP-HPLC and HPTLC
Methods for Simultaneous Estimation of Metformin Hydrochloride and Vildagliptin from Bulk and Marketed Formulation: Development and Validation. British Journal of Pharmaceutical Research 2014; 4(20): 2370-2386.
14. Shirode AR, Jadhav BG, Kadam VJ. HPTLC Method
Development and Validation of Zolpidem Tartrate in Bulk and Marketed Formulation. Internation Journal of Pharmaceutical Sciences and Drug Research 2015; 7(2):193-197.
![Table 2: Summary of analytical method validation parameters with its method to be followed according to ICH guideline Q2 (R1) [11, 12, 13, 14] S](https://thumb-us.123doks.com/thumbv2/123dok_us/1423425.1655724/4.595.40.562.596.778/table-summary-analytical-validation-parameters-followed-according-guideline.webp)