e
-ISSN: 2278-067X,
p
-ISSN: 2278-800X, www.ijerd.com
Volume 7, Issue 2 (May 2013), PP. 45-51
Blanking process optimization using Taguchi method
T.Z.Quazi1, R. Shaikh2, Amol Totre3 Rahul Nishad3 Sagar Bodke 3 Angad Chauhan3
1
Saraswati college of engg,HOD(auto). Navi Mumbai.
2
Saraswati college of engg, lecturer, Navi Mumbai.
3
Saraswati college of engg, B.E.student, Navi Mumbai.
Abstract:- Metal blanking is a widely used process in high volume production of sheet metal components. The Research work carried out for investigating the effect of potential parameters, influencing the blanking process and their interactions. This helped in choosing the process leading parameters for two identical products manufactured from two different materials blanked with a reasonable quality on the same mold. The study has helped to evaluate the influence of tool clearance, sheet thickness and sheet material thus optimizing clearance which affects other process parameters. The designs of experiments (DOE) approach by Taguchi method is used in order to achieve the intended model objectives.
Keywords:- blanking, clearance ,thickness optimization, brass ,aluminum
I. INTRODUCTION
Blanking is a metal fabricating process, during which a metal work piece is removed from the primary metal strip or sheet when it is punched. The material that is removed is the new metal work piece or blank. The blanking process forces a metal punch into a die that shears the part from the larger primary metal strip or sheet The illustration that follows provides a two-dimensional look at a typical blanking process. Note how the primary metal work piece remains and the punched part falls out as scrap as the punch enters the die. The scrap drops through the die and is normally collected for recycling.
Fig.1. Die Punch set up
The most common materials used for blanking include aluminium, brass, bronze, mild steel, and stainless steel. Due to its softness, aluminium is an excellent material to be used in the blanking processes
Different zones of part edge:-
The shear edge is made of different zones based on the method of material that has occurred. The ratio of the different zones is influenced by different parameters, such as the punch corner radius, to name a few, in general it is preferred to have large shear zone and smaller burr the zones and deformation modes of the blanked part edge are given as follows and in fig. 2
Rollover zone (zr): caused by plastic material deformation
Shear zone (zs) : smooth and shiny area created during material shearing Fracture/rupture zone (zf) : rough surface, result after the material cracks Burr zone (zb) : caused by plastic deformation
Fig.2. Different zones of part edge
PROBLEMS IN BLANKING PROCESS.
1. Blanking process design: - The design of blanking processes in industrial practice is still based largely on experimentations and it is often governed by time-consuming and expensive trial and-error iterations caused by limited, mostly empirical, knowledge of these processes.
2. More cycle time and inaccurate product dimensions and specification (especially sheared edge). 3. Quality of component is not at satisfactory level.
4. High rejection when there is a manual Quality control.
II. FACTORS INFLUENCING BLANKING PROCESS
a) Influence of Blanking Clearance
Fig.3.Clearance between Die and Punch
In blanking processes, the clearance (Fig. 3.2.3) expressed as a percentage of the sheet thickness, is defined by: C=100 (%)
Dm, Dp, and t are, respectively, the die diameter, the punch diameter, and the sheet thickness In order to study the influence of this design parameter, four tools have been designed corresponding to four different clearances, 5%, 10%and 15%. These values correspond to the most used clearances in industry
b) Influence of the Sheet Thickness
For a given material, the energy requirement in blanking is influenced by the sheet thickness. It has been observed that:
1. The blanking energy decreases with increasing clearance-to-sheet thickness ratio c/t and increases with increasing sheet thickness.
2. The proportions of the different depth characteristics of the sheared profile are affected by the thickness.
The part edge quality also depends on the material being blanked. Materials with large ductility, low yield strength, and homogeneity will have better blanked edge quality, dimensional tolerances, and longer tool life
III. DESIGNED EXPERIMENT BY TAGUCHI METHOD
Table.1. Taguchi Design
Above Experiment was carried on 10 Tonne Power Presss
The mesasurement was done using Digital Vernier Height Gauge(Least Count 0.001mm)
The analysis was carried out using Design Of experiments.
Experimental Data For
1. Aluminium
Table.2.Data for Aluminum 2.Brass
Table.3.Data for Brass
IV. ANALYSIS FOR BRASS
3 2 1 2 8 2 6 2 4 2 2 2 0 3 2 1 A M e a n o f S N r a t io s B M a in E f f e c ts P l o t f o r S N r a ti o s
D a ta M e a n s
S ig n a l- to - n o is e : S m a lle r is b e tte r
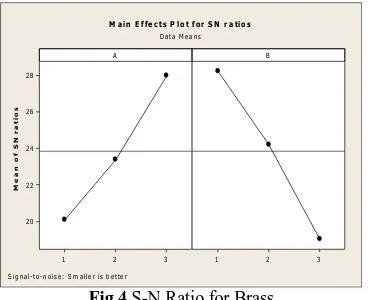
Fig.4.S-N Ratio for Brass
Fig.4. shows the S/N ratio graph where the horizontal line is the value of the total mean of the S/N ratio. Basically, larger the S/N ratio, the better is the quality characteristics for the blank. As per the S/N ratio analysis from graph the levels of parameters to be set for getting optimum value of burr height are A3B1
Analysis of variance for SNR, using adjusted SS ANOVA
Source DF Seq SS Adj SS Adj MS F P
Thickness 2 92.86 92.86 46.431 11.06 0.014
Clearance 2 126.64 126.64 63.311 15.08 0.23
Error 4 16.79 16.79 4.199
Total 8 236.29
Table.4. Analysis of variance for SNR, using adjusted SS ANOVA
According to ANOVA analysis as shown in Table.4, the most effective parameter with respect to burr height is clearance. Percent contribution indicates the relative power of a factor to reduce variation. For a factor with a higher percent contribution, a small variation will have a great influence on the performance. The percent contributions of the blanking parameters on the burr height are shown in Table.4. According to this, clearance was found to be the major factor affecting the burr height (23%). A percent contribution of sheet thickness is much lower, being (1.4%). As we conduct full factorial experimentation & the optimum level condition A3B1
has already perform, hence there is no need of confirmation experiment.
Regression analysis
The regression equation is MEAN = 0.0600 - 0.0269 Thickness + 0.0342 Clearance
S = 0.00901688 R-Sq = 95.9% R-Sq(adj) = 94.5%
Predictor Coef SE Coef T P
Constant 0.06000 0.01084 5.54 0.001
Thickness -0.026862 0.003681 -7.300.0 0.000
Clearance 0.034222 0.003681 9.30 0.000
Table.5. Regression analysis of burr height Solving above regression equation
X Y Z
0.04843 0.04531 0.0602468
0.07357 0.06509 0.0602470
0.10215 0.11375 0.0611424
Table 6.
Fig.5. scattered plots for X,Y&Z
Fig.5. shows that the minimum Burr height (0.0602468) corresponds to clearance value of (0.04531). It proves that the optimum clearance corresponds to minimum burr height is 4.53%.
V. ANALYSIS FOR ALUMINIUM
Signal to noise ratio
3 2 1 2 6 2 5 2 4 2 3 2 2 2 1 2 0 1 9 1 8 1 7 3 2 1 A M e a n o f S N r a t io s B M a i n E f f e c ts P l o t f o r S N r a ti o s
D a ta M e a n s
S ig n a l- to - n o is e : S m a lle r is b e tte r
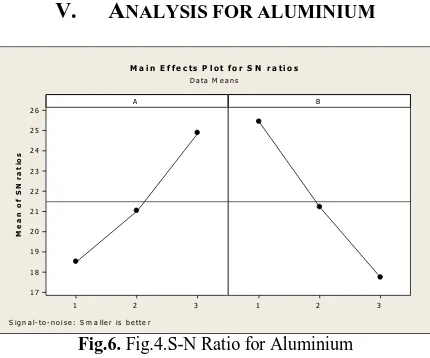
Fig.6. Fig.4.S-N Ratio for Aluminium
The above figure shows the S/N ratio graph where the horizontal line is the value of the total mean of the S/N ratio. Basically, larger the S/N ratio, the better is the quality characteristics for the blank. As per the S/N ratio analysis from graph the levels of parameters to be set for getting optimum value of burr height are A3B1
analysis of variance
Table 6.3 Analysis of variance for SNR, using adjusted SS ANOVA
Source DF Seq SS Adj SS Adj MS F P
Thickness 2 61.32 61.32 30.661 11.51 0.011
Clearance 2 89.33 89.33 44.666 16.76 0.22
Error 4 10.66 10.66 2.664
Total 8 161.31
Table.7.Analysis of variance for SNR, using adjusted SS ANOVA
Table.7. shows the most effective parameter with respect to burr height is clearance. Percent contribution indicates the relative power of a factor to reduce variation. For a factor with a higher percent contribution, a small variation will have a great influence on the performance. The percent contributions of the blanking parameters on the burr height are shown in Table-6.11. According to this, clearance was found to be the major factor affecting the burr height (22%). A percent contribution of sheet thickness is much lower, being (1.1%). As we conduct full factorial experimentation & the optimum level condition A3B1 has already perform, hence
there is no need of confirmation experiment.
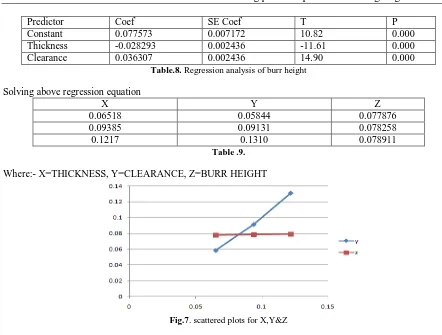
Regression analysis
The regression equation is MEAN = 0.0776 - 0.0283 Thickness + 0.0363 Clearance
Predictor Coef SE Coef T P
Constant 0.077573 0.007172 10.82 0.000
Thickness -0.028293 0.002436 -11.61 0.000
Clearance 0.036307 0.002436 14.90 0.000
Table.8. Regression analysis of burr height
Solving above regression equation
X Y Z
0.06518 0.05844 0.077876
0.09385 0.09131 0.078258
0.1217 0.1310 0.078911
Table .9.
Where:- X=THICKNESS, Y=CLEARANCE, Z=BURR HEIGHT
Fig.7. scattered plots for X,Y&Z
shows that the minimum Burr height (0.077876) corresponds to clearance value of (0.05844). It proves that the optimum clearance corresponds to minimum burr height is 5.84%.
Comparison Plot for Aluminium and Brass
Fig.8. Comparison Plot Where, Y= Aluminium
Z= Brass
VI. CONCLUSION
The developed experimental investigation of the sheet metal blanking process makes it possible to study the effects of process parameters such as the material type, the punch-die clearance, the thickness of the sheet and their interactions on the geometry of the sheared edge especially the burrs height. The Design of experiments (Taguchi Method) method is used in order to obtain a better understanding of the blanking manufacturing response. The process signatures indicate that the material types as well as the geometric characteristics of the tools and their configuration influence the burrs height of the sheared edge.
consuming experiments. This will make the design process faster and more reliable. From another point of view, it is possible to build quality into products from the early design phases by predicting the shape of the cut edge and the burs height of a blanked product. This will improve the final products quality and reduce burrs removal rework in addition to increasing the manufacturing process flexibility and reducing its cost through building one blanking setup for different materials. In conclusion, it can be stated that the Design of Experiments technique can be used in order to contribute towards the optimization of sheet metal blanking processes.
REFERENCE
[1]. R. Hambli, (2002), “Design of Experiment Based Analysis for Sheet Metal Blanking Processes Optimization”. The International Journal of Advanced Manufacturing Technology, Vol.19, Page No.403-410.
[2]. F. Faura, A. Garcia, and M. Estrems, (1998), “Finite element analysis of optimum clearance in the blanking process”. Journal of Materials Processing Technology, Vol.80-81, Page no.121-125.
[3]. R. Hambli, S. Richir, P. Crubleau, and B. Taravel, (2003), “Prediction of optimum clearance in sheet metal blanking processes”. International Journal of Advanced Manufacturing Technology, Vol. 22, page no. 20-25.
[4]. Emad Al-Momani, Ibrahim Rawabdeh, (Mar. 2008), “An Application of Finite Element Method and Design of Experiments in the Optimization of Sheet Metal Blanking Process” Jordan Journal of Mechanical and Industrial Engineering. Volume 2, Number 1, Pages 53 -63.
[5]. S. Maiti, A. Ambekar, U. Singh, P. Date, and K. Narasimhan, (2001), “Assessment of influence of some process parameters on sheet metal blanking”.Journal of Materials Processing Technology, Vol. 102, page no. 249-256.
[6]. R. Hambli, (2003), “BLANKSOFT: a code for sheet metal blanking processes optimization”. Journal of Materials Processing Technology, Vol. 141, page no. 234-242.