A Scheme for Classifying Integrated
Approaches for a multivariate spatial data set
Sudan Jha
School of Computer Engineering
Room No F10, KIIT University, Campus 15,Odisha, India
Abstract- Scientific understanding of complex geographic problems often depends on the discovery, interpretation, and presentation of multivariate spatial patterns, e.g., detection of unknown multivariate spatial patterns or relationships between the incidence of various cancers and socioeconomic, demographic, or environmental factors can lead to important hypotheses about unexpected cancer risk factors. However, identifying such patterns becomes ever more challenging, as powerful data collection and distribution techniques produce geographic datasets of unprecedented size in many application and research areas. These datasets are not only large in data volume but also characterized by a high number of attributes or dimensions. It is an extremely challenging and yet urgent research problem to effectively and efficiently detect and understand relationships and patterns in such voluminous and high-dimensional data .
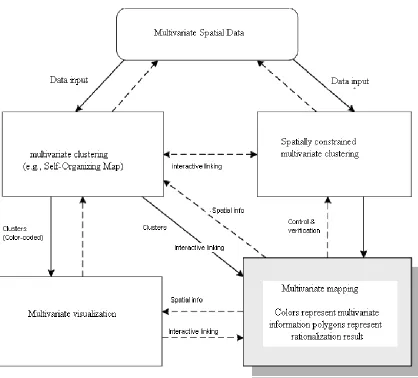
This project focuses primarily on four components in the framework, namely, multivariate analysis, multidimensional visualization, multivariate mapping, and human interaction. The discovery, interpretation, and presentation of multivariate spatial patterns are important for scientific understanding of complex geographic problems. This project integrates computational, visual, and cartographic methods together to detect and visualize multivariate spatial patterns. This integrated approach is able to perform multivariate analysis, dimensional reduction, and data reduction with the Self-Organizing Map. Hence this “mixed initiative” methods can mitigate each other’s weakness and collaboratively discover complex patterns in large geographic datasets, in an effective and efficient way.
Keywords – Complex Geographic Problems, Multivariate Spatial Patterns, dimensional data,
I. INTRODUCTION
1. BASIC INTRODUCTION
A. This Project introduces an integrated approach to multivariate analysis and geovisualization, which couples a suite of methods that are either complementary or competitive to each other. Complementary methods examine the data from different perspectives and together present an overview of complex patterns. On the opposite side, competitive methods focus on the same perspective or analysis task and their results can validate and crosscheck each other. The integrated approach couples a self-organizing map, a regionalization method a multidimensional visualization component, and a multivariate mapping component. On one hand, the SOM and the regionalization method are competitors as they both seek clusters. The integrated approach not only supports user interactions and multiple linked views but also merges or overlays results of different components into a single view. Such an overview facilitates an overall understanding of major patterns and efficiently guides user interactions toward the hot spots that warrant closer attention.
B. Basics of Multivariate Mapping And Clustering
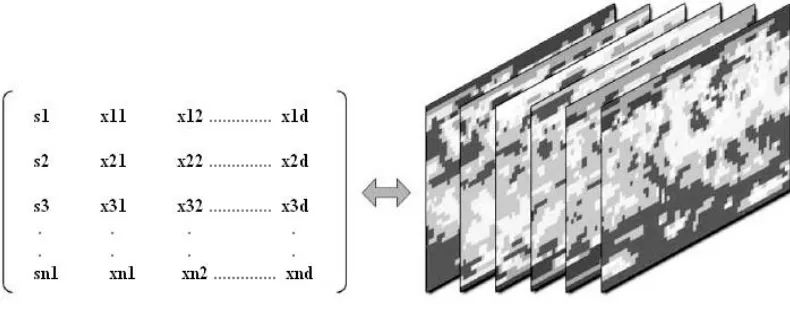
The study and understanding of complex geographic phenomena often depends on the analysis of multivariate spatial data to discover complex structures and gain new knowledge. This shows a conceptual representation of a typical data set that contains multiple variables and geographic information, which can be viewed as a spatial data matrix ,lattice data or a “map cube”.
exploratory spatial analysis and spatial data mining span across three main groups: computational, statistical, and visual approaches. Computational approaches resort to computer algorithms to search large volumes of data for specific types of patterns such as spatial clusters, spatial association rules, homogeneous regions, co-location patterns and spatial outliers. Statistical approaches include spatial scan statistics or models, geographically weighted regression, multivariate lattice models, and spatial association tests. Visualization-based methods for multivariate spatial analysis include, for example, multivariate mapping, spatial statistics graphics and other geovisualization techniques. D i f f e r e n t m e t h o d s
Fig 1.1 A multivariate spatial data set represented as a spatial data matrix .
have their own strengths and weaknesses. In general, computational methods are able to search for structures in large datasets with great efficiency but lack the ability to interpret and attach meaning to patterns. However, visualization- based methods alone usually can only handle relatively small data sets and primarily rely on users to pick up patterns, which can be very time consuming (to visually sort and summarize massive amounts of information across multiple dimensions) and sometime. Given the increasingly large volume and complexity of multivariate spatial data sets, it is not likely that any individual method can adequately support an exploratory process to detect, interpret, and present complex information lurking in the data. To leverage the power of different analysis approaches, there are recent research efforts that focus on the integration of visualization with statistical or computational methods.
C. Clustering Methods
Clustering methods can be broadly classified into two groups: partitioning clustering and hierarchical clustering. Partitioning clustering methods, such as K-means and maximum likelihood estimation (MLE), divide a set of data items into a number of non overlapping clusters. A data item is assigned to the “closest” cluster based on a proximity or dissimilarity measure. Hierarchical clustering, on the other hand, organizes data items into a hierarchy with a sequence of nested partitions or groupings. Hierarchical clustering can be represented with dendrograms, which consist of a hierarchy of nodes, each of which represents a cluster at a certain level. Commonly used hierarchical clustering methods include the Ward’s, single-linkage clustering, average-linkage clustering, and complete-linkage clustering.
SOM is a unique partitioning clustering method, which not only segments data into clusters but also orders the clusters in a two-dimensional layout so that nearby clusters are similar to each other. Therefore, SOM is also considered both a visualization method and a dimension reduction technique that projects multidimensional data to a 2-D space. SOMs are widely used in various research fields and application areas .There are also numerous applications of SOM in geographic analysis, for example, the visualization of census data, spatialization of nonspatial information, and exploration of health survey data .
a. Multiple simultaneous perspectives.
b. Ability to comprehend large amounts of data. c. Reduction in search time through visualization. d. Provides a better understanding of complex data sets.
e. Reveal relationships and properties through visual perception.
Disadvantages:
a. It is difficult to understand how much the vectors from one or other class correspond to a cell.
b. We do not know how many vectors are from of the same class or of different class, and what their proportions are.
E. Applications: - Broadly this concept may be applied in the following arenas. a. Image Processing
b. Market Research c. World Wide Web d. Medical diagnostic e. Pattern Recognition f. Spatial Data Analysis
g. Exploration of health survey data h. Visualization of patterns in census data
II. LITERATURE REVIEW
Dykes, MacEachren, and Kraak (2005) [1] discussed that geovisualization concerns the development of theory, methods, and tools for the visual analysis and presentation of geographic data. To analyze multivariate spatial data, geovisualization research often draws upon approaches from related disciplines such as information visualization, and exploratory data analysis.
D.B. Carr, D. White, and A.M. MacEachren(2005) [2] suggested that mapping is essential in visualizing geographic patterns.Multivariate mapping has long been a challenging and interesting research problem. Multivariate representation that depicts each dimension independently through some attribute of the display and then integrates all variable depictions into one map using composite glyphs, attributes of color .
D. Guo, M. Gahegan, A.M. MacEachren, and B. Zhou( 2005) [3] discussed that self-organizing map (SOM) are used to cluster multivariate profiles each of which is a multivariate vector for a specific state/year combination. More importantly, the SOM orders clusters in a two-dimensional layout so that nearby clusters are similar.. Thus, the SOM effectively transforms the multivariate data into a two-dimensional space.
S. Park, C. Bajaj, and I. Ihm(2004) [4] proposed that large data sets can cause serious problems for most visualization techniques and these problems can be divided into two groups: the computational efficiency problem and the visual effectiveness problem. Computational efficiency concerns the time needed to process data and render views. A visualization technique has to be computationally efficient and scalable with very large data sets to allow human interactions.
P.C. Wong, K.K. Wong, H. Foote, and J. Thomas(2003) [5] discussed that ordering is widely used in visualization techniques to accentuate patterns. In the visualization of bacterial genomes, pixel arrangement is used to place adjacent nucleotides as close to each other as possible and thus to help bring out data patterns that otherwise would be difficult to perceive . Ordering is also used in arranging the layout of treemaps . Their framework can be applied to the arrangement of unordered factors for quantitative data and frequency data, and to the arrangement of variables and observations in multivariate displays.
preprocessing; selection of an interesting subspace for subsequent analysis; detection of multivariate patterns in the data visualization of multivariate patterns, multivariate mapping to examine the spatial distribution of the discovered multivariate patterns, and interactive exploration and interpretation by expert users.
Kohonen (2001) [7] discussed that each SOM node is associated with a vector which represents the position of this node in the input attribute space. The SOM first initializes each node by assigning its codebook vector randomly.During the iterative learning process, each codebook vector is adjusted according to the data items falling inside and the codebook vectors of its neighboring nodes are adjusted accordingly. After the learning process is complete, each node has a new position in the input attribute space.
R.L. Harris(1999) [8] proposed that multivariate visualization methods range from commonly used information graphics (e.g., tables, histograms, scatter plots, and charts through a suite of techniques introduced in the exploratory data analysis and information visualization literature. It is impractical to provide a comprehensive review of the range of multivariate visualization methods here, thus the reader is directed to a paper that provides a categorization of both data types and visualization methods, with illustrations of most of the methods cited above and as well as others and each pattern can involve a different subset of variables.
Fayyad et al(1996) [9] discussed that clustering analysis, in its broad definition, has been one of the most widely used computational approaches. Clustering methods organize a set of objects into groups (or clusters) such that objects in the same group are similar to each other and different from those in other groups. However, although cluster analysis is an efficient method for extracting patterns from data, caution must be exercised in accepting the discovered clusters. Different clustering methods, or the same method with a different parameter configuration, can generate quite different clusters.
Openshaw and Rao (1995) [10] described the general-purpose clustering methods normally do not consider geographic information or spatial constraints. Therefore, data items in a cluster are not necessarily close or contiguous in the geographic space. In contrast, regionalization is a special form of clustering that seeks to group data into spatially contiguous clusters while optimizing an objective function. Regionalization has long been an important analysis task for a large spectrum of research and application domains, for example, climatic zoning , eco-region analysis , map generalization, census reengineering and public health analysis.
Existing regionalization methods can be classified into four groups: -
i. Optimization through a trial-and-error search
ii. Multivariate clustering followed by spatial processing iii. Clustering with a spatially weighted dissimilarity measure iv. Contiguity constrained clustering and partitioning.
Jain and Dubes (1988) [11] stated that cluster analysis is a widely used data analysis approach, which organizes a set of data items into groups so that items in the same group are similar to each other and different from those in other groups. Many different clustering methods have been developed in various research fields such as statistics, pattern recognition, data mining, machine learning, and spatial analysis. Different methods, or even the same method with different parameter configurations, can give quite different clustering results.
III.OBJECTIVE OF THE PAPER
1. To integrate computational, visual methods together to detect and visualize multivariate spatial patterns.
2. To perform multivariate clustering and abstraction with a Self Organizing Map
3. To encode SOM result with colors derived from a two-dimensional color scheme.
4. To visualize spatial variations of multivariate patterns.
5. To support human interactions to explore patterns from different perspectives.
IV. PROBLEM FORMULATION AND VIEW
4.1 PROBLEM FORMULATION
To build an integrated approach, it is necessary to examine the relations between different methods, which can be either complementary or competitive. Complementary methods usually analyze the data from different perspectives and help each other overcome weaknesses. For example, multidimensional visualization can be complemented by a cartographic map to explore multivariate spatial data interactively. Computational and visual approaches are usually complementary to each other as the former process and summarize large data sets while the latter can help present and understand the findings. In contrast, competitive methods usually focus on the same analysis task. For example, two different clustering methods often produce different clusters from the same data due to different searching strategies or underlying constraints. It would be useful and often critical to be able to compare the results of such competitive
methods, find commonalities, examine differences, crosscheck each other’s validity, and thus better understand the data and patterns. Although there are considerable efforts on integrating complementary methods, few have focused on competitive approaches.
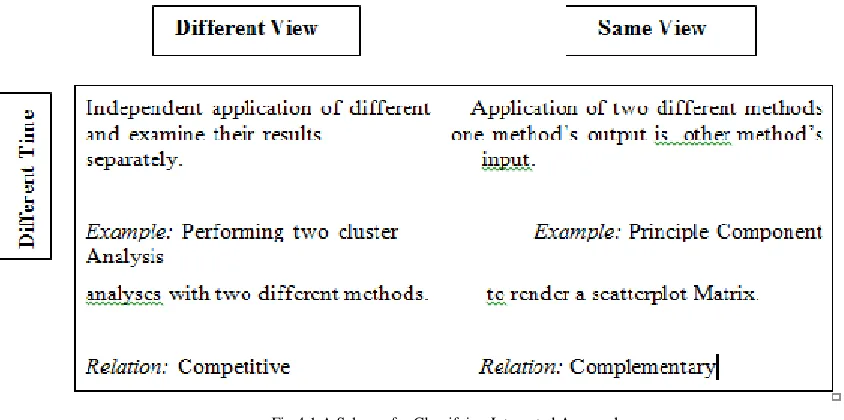
The strategies to couple different methods may be classified into four groups.
1. Different time and different view, for example, independently applying different methods to analyze the same data and examine their results separately.
2. Different time and same view, for example, one method’s output being another’s input so that the final output is a joint outcome of the two methods.
3. Same time and different view, for example, simultaneously feeding the data into multiple linked views and examining their results side by side through brushing linking.
4. Same time and same view, for example, immersing or overlaying the results of different methods in a unified view.
Parallel application of different Parallel application of different methods
methods and comparing results and immersing or overlaying results in a
in different views with the user unified overview.
Interactions such as linking.
Example: Multiple linked views. Example: Multivariate patterns are coded with colors and shown in a map,
Relation: Complementary and/or Relation: Complementary
competitive
This classification scheme is borrowed from the research in collaborative decision making or group work, which distinguishes four different types of collaboration among people according to location and time . The primary difference between the third group and fourth group is that the former has to rely on human interactions to perceive the connection between multiple views, while the latter merges different results into the same view so that one can perceive an overview of major patterns even without human interactions. However, interactive exploration and multiple linked remain important when it comes to concise understanding and detailed inspection of specific patterns.
The integrated approach presented in this approach :
(1) Couples both complimentary approaches and competitive methods, and
(2) Supports both the same-time-different view and same-time-same-view coupling
A regionalization method, as a competitor to the SOM, takes the same data input and derives homogeneous regions, which are overlaid in the multivariate map. Thus, one can easily perceive an overall picture of how the multivariate patterns change over the geographic space and how the two clustering results agree with or differ from each other. With interactions, the analyst may focus on specific patterns and examine details. The following section focus on individual components in the framework, i.e., clustering with SOM, multivariate visualization and mapping, and regionalization.
Sa
me
T
ime
IV. METHODOLOGY
4.1 METHODOLOGY
To implement multivariate mapping, clustering and visualization netbeans software for java is used.
The methodology will include following steps:
1) To perform multivariate mapping of the given data.
2) To perform multivariate clustering with a Self Organizing Map (SOM);
3) To integrate both multivariate mapping and clustering to visualize multivariate data simultaneously.
4.2 DATA FORMAT
The easiest way to create a data set is to take a standard set of ESRI ArcGIS shape file and save its .dbf file as a .csv file. This will need both the .shp file and the .csv file. For example, following is the example data set. The “48states.csv” file was directly converted from the “48states.dbf” file. The sample data has been taken from www.census.gov/population/www/cen2000/maps/files/tab04.xls
4.3 MULTIVARIATE MAPPING
To reveal the multivariate meaning of SOM clusters, an extended version of a PARALLEL COORDINATE PLOT (PCP) is used. The PCP can visualize the data at two different levels: the cluster level or the data item level. At the cluster level, the PCP shows each cluster as a single entity and thus partially avoids the overlapping problem. Each string has the same color as the cluster does in the SOM.. The thickness of each string is proportional to the cluster size. At the data item level, each string in the PCP represents an individual data item . Each string has the same color as that of its containing cluster. Evidently, the colors dramatically improve the visual effectiveness of the PCP in presenting multivariate patterns. Without colors, it would be very difficult to track each string across many dimensions. By comparing the PCP at the two different detail levels, we can also see that the aggregation of data items to a univariate map except that colors now represent multivariate information. This map is an overview of the spatial distribution of multivariate patterns. The PCP introduced previously serves as the legend for interpreting the meaning of colors. The three visual components allow a variety of user interactions such as selection-based brushing and linking. A selection made in one component will be highlighted in all other components simultaneously. A selection can be progressively refined by, for example, adding or subtracting new selections. The user may select at either the cluster level or the data item level.
4.4 MULTIVARIATE CLUSTERING
A SOM is a special clustering method that seeks clusters in multivariate data and orders the clusters in a two-dimensional layout so that nearby clusters are similar in terms of multivariate characteristics. Each cluster is associated with a multivariate vector , which represents the centroid of the cluster in the multivariate space. A SOM first arranges a user-specified number of nodes in a regularly spaced grid and then initializes each node by assigning its codebook vector randomly. During the learning process, the SOM iteratively adjusts each codebook vector according to the data items falling inside the node and the codebook vectors of its neighboring nodes. Once the learning is complete, each node has a position in the multivariate space and all the nodes in the SOM form a nonlinear surface in the multivariate space. Then data items are projected onto the surface by assigning each item to its nearest cluster . Although SOM nodes are equally spaced in the two-dimensional layout, their codebook vectors are not equally spaced in the multivariate space. Rather, the distribution of nodes adapts to the actual data density — dense areas tend to have more clusters.
According to the number of data items that it contains. Nodes are equally spaced in a two-dimensional space. Behind the nodes , there is a layer of hexagons, which are shaded to show the multivariate dissimilarity between neighboring nodes — darker tones represent greater dissimilarity.. Clusters in a brighter area are more similar to each other than those in a darker area are.
4.5 MULTIVARIATE CLUSTERING AND VISUALIZATION
a. Abstraction and Encoding of Multivariate Patterns
4.b Visualization of Multivariate Patterns
The meaning of the colors in the SOM however, cannot be defined by a simple legend , since each color represents a multivariate cluster. Thus, the colors, which signify the relative similarity of clusters, must be supplemented by a multivariate visualization method that allows analysts to understand the characteristics of each cluster and thus the meaning of each color. To accomplish this, we extend an earlier version of a parallel coordinate plot to visualize the data clusters identified by the SOM. The earlier version of the PCP visualizes clusters instead of original data items, and thus partially avoids the overlap problem. Each string has the same color as it does in the SOM, which in turn dramatically improves the visual effectiveness of the PCP in presenting multivariate patterns. The PCP uses a nested-means scaling on each axis and, thus, further alleviates the overlapping problem. Nested-means is a nonlinear scaling method that recursively calculates a number of mean values and uses these values as break points to divide each axis into equal-length segments. Therefore, nested-means scaling always puts the mean value at the center of each axis and thus makes axes defined by different units and data ranges comparable.
V. RESULTS
5.1 LOADING DATA
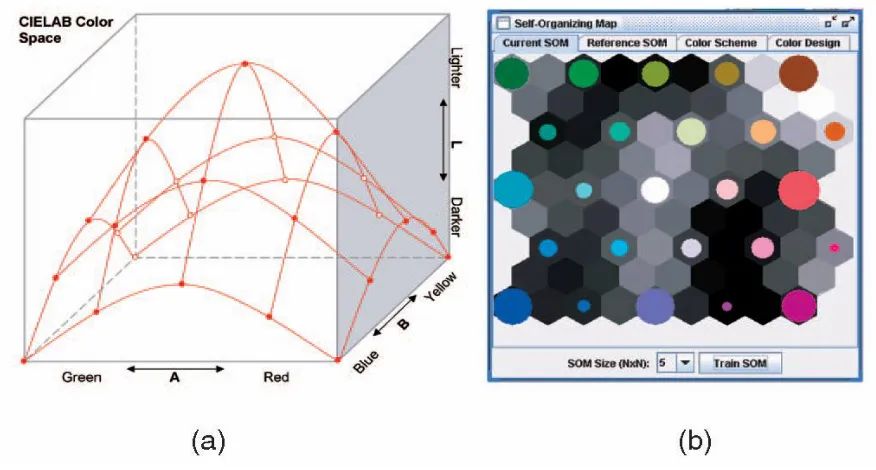
Fig 4.3 (a) The two-dimensional color model and (b) the color-encoded SOM.
Form Name-Load Data
Form Name-Multivariate Mapping
Description-It will perform Mapping of Multivariate Data.
Form Name-Multivariate Clustering
Description-In this multivariate data is processed by a Self-Organizing Map (SOM) to derive clusters of spatial objects based on their multivariate similarity.
Description-It will show the multivariate visualization. IV. CONCLUSIONS AND FUTURE SCOPES
CONCLUSION
This research paper introduces an integrated approach to multivariate clustering and geovisualization, which builds upon the synergy of multiple computational and visual methods. Its unique strength is evident in several aspects. First, by leveraging the power of computational methods it can handle larger datasets and more variables than would be possible with visual methods alone. Second, it effectively synthesizes different perspective information to enable an overview of complex patterns across multiple spaces. Third, its component-based design provides flexibility to extend the system by adding new components or replacing current components. Through the static linking and user interactions, complex relationships can be perceived and understood easily. However, there is a limitation on the color configuration — it is not always possible to assign a cognitively meaningful color to each cluster. The color surface must be smooth and continuous, meaning that the user may not always be able to assign a desirable color to a cluster, for example, a red color to represent a warming trend and a blue color to represent a cooling trend.
It remains a challenging problem when it comes to extremely large data sets (e.g., several gigabytes of data).In this case, our approach relies on data aggregation in the preprocessing stage to reduce the data size to a range that the system can handle. On the other hand, in future our framework can also replace current components with any other efficient methods if available and needed. Further usability studies are needed to empirically validate this approach and learn how actual users interact with the system.
REFERENCES
[1] Dykes, J.A., MacEachren, A.M., and Kraak, M.-J. (Eds.), 2005, Exploring Geovisualization.Elsevier, Amsterdam.
[2] D.B. Carr, D. White, and A.M. MacEachren, “Conditioned Choropleth Maps and Hypothesis Generation,” Annals of the Assoc. of Am. Geographers, vol. 95, no. 1, pp. 32-53, 2005. Carr, D.B., D. White and A.M. MacEachren, 2005.
[3] D. Guo, “Coordinating Computational and Visualization Approaches for Interactive Feature Selection and Multivariate Clustering,” Information Visualization, vol. 2, no. 4, pp. 232-246,
[4] S. Park, C. Bajaj, and I. Ihm, “Visualization of Very Large Oceanography Time-Varying Volume Data Sets,” Proc. Int’l Conf. Conceptual Structures (ICCS ’04), pp. 419-426, 2004.
[5] P.C. Wong, K.K. Wong, H. Foote, and J. Thomas, “Global Visualization and Alignments of Whole Bacterial Genomes,” IEEE Trans. Visualization and Computer Graphics, vol. 9, no. 3, pp. 361-377, 2003.
[6] M. Gahegan, “Scatterplots and Scenes: Visualization Techniques for Exploratory Spatial Analysis,” Computers, Environment, and Urban Systems, vol. 22, no. 1, pp. 43-56, 2002. Dykes, J., 2002.
[7] T. Kohonen, Self-Organizing Maps, third ed., Springer series in information sciences,501, 2001.
[8] R.L. Harris, Information Graphics: A Comprehensive Illustrated Reference, p. 448, Oxford, UK: Oxford Press, 1999.
[9] Fayyad, U., G. Piatetsky-Shapiro, and P. Smyth. 1996. From data mining to knowledge discovery: A review. Advances in knowledge
discovery. In: U. Fayyad, G. Piatetsky-Shapiro, P. Smyth, and R. Uthurusay (eds), Cambridge, Massachusetts: AAAI Press/The MIT Press.
pp. 1-33.
[10] Openshaw, S., 1977, A geographical solution to scale and aggregation problems in regionbuilding, partitioning, and spatial modelling.
Transactions of the Institute of British Geographers, NS 2, 459–472..
[11] Jain, A.K. and R.C. Dubes, 1988, Algorithms for Clustering Data. Englewood Cliffs, NJ: Prentice Hall.