e-ISSN: 2278-067X, p-ISSN: 2278-800X, www.ijerd.com
Volume 12, Issue 1 (January 2016), PP.28-32
Classification of Programming Language
Dr.Seetharam K, Sharana B Gowda, Basavaraj Chunchure
1
Professor, Dept. of EEE, Christ University Bangalore- 560029
2Sharana. B.Gowda, Asst.Professor, Dept of CSE JSSATE Bangalore- 560060 3Basavaraj Chunchure, Research Scholar,Dept of CSE, BIGCE,Solapur-413255
Abstract:- Classification of database of programming languages is useful in system modeling situations to
produce a concise representation of the behaviour of a system. Such analysis can be formed using different similar algorithms to aggregate the number of data sets to manage number of subsets /categories. Here ten languages are classified based on five different methods.1) based on weight of criteria, 2) based on Bayesian theory, 3) Based on MCDM, Multi criterion decision making. 4) Based on Defect 5) Based on productivity.
Keywords: - Function point, Productivity
I.
INTRODUCTION
Classification is a classical problem extensively studied by statisticians and machine learning researchers. It is the process of separation or ordering of objects into classes. In the literature new classification techniques are developed to deal with millions of objects having some number of attributes. It is defined as a process in which classes have been predefined needs a method that will train to allocate objects to the classes. It ensures that the data sets in a group are more similar to each other. Five cases of classification are discussed in this paper.1) weights of criteria, 2) Multi criterion decision making (MCDM) 3) Bayesian method 4) Based on the defect and 5) Based on ranking of productivity. The data used is directly taken from different activities of software development using ten versions of the same software project. [1],[7]
A. MULTIDIMENSIONAL SCALING (MDS):
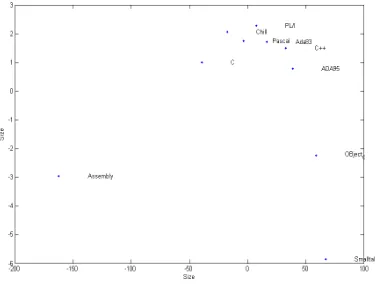
Multidimensional scaling is one ofseveral multivariate techniques that aim to reveal the structure of a data set by plotting points in one or two dimensions [9]. In the literature typical MDS problem there is often a degree of arbitrariness in the definition of distance. Input data for MDS is in the form of a distance matrix representing distance between pair of objects, which, in this case it is based on subjective assessment of relationship between lines of code and function point. The basic idea is different programming languages (here ten languages) are shown in the two dimensional graphical example. „Multi‟ itself refers to the fact that data representation is not restricted to constructing maps in one or two dimensions. Ten languages are distinguished by line of code (loc) per function point. They are demonstrated by multidimensional scaling shown in the Graph [2],[9].
B. WEIGHTS OF CRITERIA:
Entropy is a term that measures the uncertainty associated with random phenomena of the expected information content of a certain message and this uncertainty is represented by a discrete probability distribution. The entropy method estimates the weights of the various criteria from the given payoff matrix and is independent of the views of the decision maker. Hwang and Yoon [8] mentioned that Entropy method is particularly useful to explore contrasts between sets of data. These sets of data can be mapped as a set of alternative solutions in the payoff matrix where each alternative solution is evaluated in terms of its outcome. The philosophy of the method is based on the amount of information available and its relationship with importance of the criterion. The method uses weights of various criteria from the available payoff matrix and is independent of decision maker. By organizing observations or objects of similar properties into meaningful groups, the ten languages considered are Assembly, C, Chill, Pascal, PL/I, Ada83, C++, Ada95, Objective C, and Smalltalk. Six different activities (req, design, code, test, doc, mgt) each 1500 function points in size are taken as the criteria. Entropy and weights of criteria with reference to languages is used. The results are shown in table A1 languages. Entropy /weights of criteria with respect to six activities are shown in table A1 activities.
C.NAIVE BAYES DECISION:
The probability of a record belonging to a certain class is now evaluated not only based on the prevalence of that class but also on the additional information that is given on that record in terms of its X information. It works only with predictors that are categorical. Numerical predictors must be binned and converted to categorical variables before the naïve Bayes classifier can use them. A hypothesis is generated that the given data belongs to a particular class. We then calculate the probability for the hypothesis to be true. The approach requires one scan of the whole data. To define Bayes theorem: P (A/B) =P (B/A). P (A) /P (B) gives equation P (A/B) is prior probability and P (B/A) is posterior probability of the system. The results are shown in Table B1 with respect to languages, and also with respect to activities.
D. MCDM (Multi criterion decision making):
Technique for order preference by similarity to an ideal solution (TOPSIS) is based on the principle that the chosen alternative should have the shortest distance from the ideal solution and farthest distance from the negative ideal solution. The methodology consists of
1. Computation of weighted normalization payoff matrix
2. Determination of ideal f* value and negative ideal f** value for each criterion.
3. Calculation of separation measure, Relative closeness of each alternative with respect to negative ideal measure is C1.Higher the C1 value, better the alternative. Measurement of separation measures, are Dimensional Euclidean distances. These are measured and made use to calculate better weights of criteria. Table C1 gives result when languages taken as reference and also when activities taken as reference [4].
E. DEFECT POTENTIALS FOR TEN VERSIONS:
Defect potential of asoftware project is the sum of the errors found in requirements, design code, user documentation and bad fixes secondary errors introduced when repairing prior defects. Defect removal efficiency of a project is the total percentage of defects eliminated prior to delivery of software to its intended clients. This will be calculated on anniversary of delivery of software. Considering defect potentials for ten versions of the same software project each 1500 function points in size. The defect at each stage of development is taken into consideration. Taking the columns of total defects and documentation defects were held constant using the data normalization. Ten Programming languages are classified and the result is shown in Table D1. Classification with respect to activities is also given [6], [11], [12].
F. PRODUCTIVITY BASIS:
When using the standard economic definition of productivity, [3],[10] which is "goods or services produced per unit of labour or expense" the function point ranking matches economic productivity assumption. Taking measurement of the productivity rates of ten versions using LOC per staff month is in table F1. It is in opposite to productivity expressed in terms of function points per staff month. Table E1 gives ranking of ten versions with respect to function points in descending order of productivity. Table E1 is completely in reversed order as that of Table F1.
G.CLASSIFICATION OF PROGRAMMING LANGUAGES AND ACTIVITIES
Based on Weight of criteria
ASSEMBLY > C > CHILL > PASCAL > SMALL TALK >
ADA83 > C++ > OBJECTIVE C > ADA95
LANGUAGES
doc > req > design > test > code > mgt Activity
Table: A1
Based on Bayesian
ADA95 > C++ > OBJECTIVE C > ADA83 > PL/1 >
PASCAL > SMALLTALK > CHILL > C > ASSEMBLY
LANGUAGES
design > req/doc > mgt> test > code Activity
Based on MCDM
CHILL > PASCAL > C > PL/I > C++ > ADA95 > ADA83 > OBJECTIVE C> SMALLTALK >
ASSEMBLY
LANGUAGES
doc > test > design > code> mgt > req Activity
Table: C1
Based on DEFECT
ASSEMBLY > C > CHILL > SMALLTALK > PASCAL >
OBJECTIVE C > PL/I > ADA83 > C++ > ADA95
LANGUAGES
design > doc > test > code > mgt > req Activity
Table: D1
Based on productivity ranking by Function point
SMALLTALK > OBJECTIVE C > ADA95 > C++ >
ADA83 > PL/I > PASCAL > CHILL > C > ASSEMBLY LANGUAGES
design > doc > test > code > mgt > req Activity
Table : E1
Based on productivity ranking by LOC point
ASSEMBLY > C > CHILL > PASCAL > PL/I >
ADA83 > C++ > ADA95 > OBJECTIVE C > SMALLTALK
LANGUAGES
design > doc > test > code > mgt > req Activity
Table: F1
Table 1 CORRELATION COEFFICIENT
Assembly C CHILL PASCAL PL/I ADA83 C++ ADA95 OBJECTIVE SMALLTALK
Assembly 1 1 0.987 0.981 0.974 0.966 0.95 0.934 0.878 0.84
C 1 0.998 0.996 0.99 0.988 0.978 0.967 0.925 0.89
CHILL 1 0.99 0.997 0.995 0.987 0.979 0.943 0.916
PASCAL 1 0.99 0.997 0.992 0.985 0.953 0.929
PL/I 1 0.999 0.995 0.99 0.962 0.94
ADA83 1 0.998 0.994 0.971 0.951
C++ 1 0.998 0.98 0.967
ADA95 1 0.99 0.977
OBJECTIVE 1 0.997
SMALLTALK 1
Table: G
Fig. 1: Relationship between lines of code and function point.
Fig. 2: Dendogram of lines of code and function point.
II.
CONCLUSIONS
REFERENCES
[1]. Jones, Capers "Applied software measurement Global analysis of productivity and quality". Tata McGraw Hill Edition 2010.
[2]. Jones, Capers "Estimating software costs, 2nd edition, N, McGraw Hill 2007.
[3]. Jones, Capers, "Programming productivity", New York McGraw Hill publishing company; 1986
[4]. Guanrong Chen and etal Introduction to fuzzy sets, fuzzy logic and fuzzy control systems. CRC Press,
2000.
[5]. Daniel T Larose Data Mining: methods and models. Wiley inter science 2006.
[6]. John D Musa Software Reliability Engineering McGraw Hill 1999
[7]. Conte, S., Dunsmore H. and Shen, V., Software Engineering Metrics and models, Benjamin
Cummings, Menlo Park CA, 1986.
[8]. R. Kelley Pace and Ronald Berry, sparse spatial auto-regressions, statistics and probability letters, vol. 33 No.3,pp 291-297, May 5,1997 Data set available from stat lib http: // lib.stat.cmu.edu /datasets/houses.zip
[9]. Richard A Johnson and Dean Wichern, Applied multivariate statistical analysis, Prentice Hall, upper Saddle River, NJ, 1998.
[10]. Carr, D. and R J Kizior, “The case for continued COBOL Education”, IEEE Software, Volume17, Number2 March/April 2000, pp.33-36.
[11]. Arranga E., “In COBOL‟s Defense”, IEEE Software, volume 17, number 2, March/April 2000,
pp.70-75.
![Table: G Table G represents Correlation matrix of programming languages [5]](https://thumb-us.123doks.com/thumbv2/123dok_us/1401830.1652233/3.595.58.532.79.735/table-g-table-represents-correlation-matrix-programming-languages.webp)